Electric Vehicle Market Report Scope & Overview
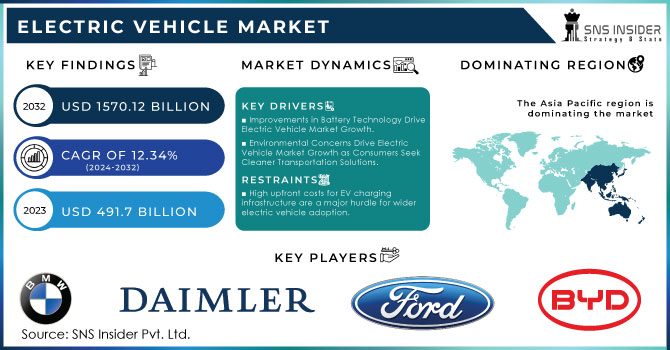
The Electric Vehicle Market size was estimated USD 491.7 billion in 2023 and is expected to reach USD 1570.12 billion by 2032 at a CAGR of 12.34% during the forecast period of 2024-2032.
Get Sampel Report on Electric Vehicle Market - Request Sample Report
Technological advancements, particularly in battery technology, have led to longer driving ranges and faster charging times, addressing key consumer concerns. A recent study by SNS Insider revealed that 70% of consumers consider environmental impact a crucial factor when purchasing a vehicle, while 65% are willing to pay a premium for an electric option. Additionally, the declining cost of ownership for EVs, coupled with rising fuel prices, is making them a financially attractive choice for many.
The major advantage EVs hold over traditional cars is zero tail-pipe emissions, thus cleaner air and less reliance on fossil fuels. They're getting cheaper to run than traditional gasoline-powered cars as well, which places them as one of the more attractive options for lots of drivers nowadays. It's not just governments and consumers starting to look at EVs as a cleaner alternative to the gasoline-powered vehicle, thus reducing greenhouse gasses. Improvements in battery technology are extending the range of EVs and facilitating charging stations. Many governments subsidize the use of EVs through tax credits and subsidies, with rulings that a certain percentage of new vehicles must be electric. Automakers are investing billions in research to make EVs more powerful, safer, and cheaper.
MARKET DYNAMICS:
KEY DRIVERS:
-
Improvements in Battery Technology Drive Electric Vehicle Market Growth.
-
Environmental Concerns Drive Electric Vehicle Market Growth as Consumers Seek Cleaner Transportation Solutions.
The electric vehicle market is being driven by concerns for environmental sustainability and climatic change. Ever since conventional gasoline-powered cars have become huge contributors to greenhouse gases and air pollution, then governments, environmental groups, and individuals are looking out for cleaner transportation solutions. Electric vehicles with zero tailpipe emissions offer a promising alternative, significantly reducing harmful pollutants and thus improving air quality. With increased public awareness about the environment of traditional vehicles, demand for EVs also increases as a way of travel cleaner and more sustainable. A strong used EV market is coming to democratize electric vehicle ownership.
With rising new EV sales, a growing supply of pre-owned models will make their way to market, offering significant cost savings for budget-conscious consumers. Kelley Blue Book found that used EV prices in the US actually fell by an average 10% last year, making them increasingly competitive alternatives to new gasoline-fueled vehicles. Moreover, with continuous improvements in battery technology, range anxiety attributed to most of the early models of EVs is also improving, hence developing belief in used EVs.
RESTRAINTS:
-
High upfront costs for EV charging infrastructure are a major hurdle for wider electric vehicle adoption.
A major hurdle to widespread electric vehicle (EV) adoption has been the high upfront cost of setting up fast-charging stations. Compared to petrol, CNG, or LPG stations, the equipment and infrastructure needed for rapid EV charging are significantly more expensive. This has limited the development of charging networks globally, despite growing concerns about vehicle emissions. The high cost of transformers and charging equipment translates to a hefty initial investment for EV charging infrastructure, which can then impact EV sales.
KEY MARKET SEGMENTS:
By Propulsion Type:
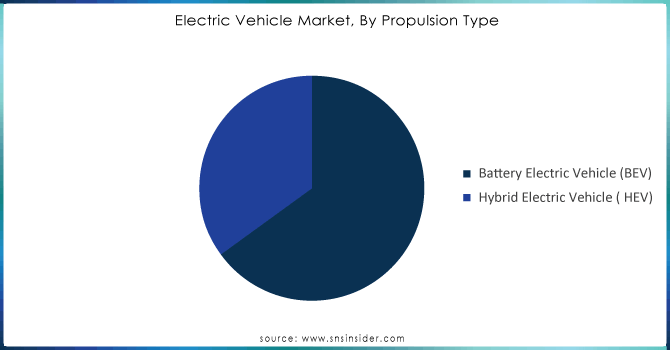
Battery Electric Vehicles (BEVs) is the dominating sub-segment in the electric vehicle market by propulsion type holding around 70-75% of market share. The advancements in battery technology have increased their range, addressing a major consumer concern. Government incentives and falling battery costs are making BEVs more affordable. A wider variety of BEV models catering to different needs and budgets is attracting a larger customer base.
Get Customized Report as per your Business Requirement - Enquiry Now
By Vehicle Type:
The passenger car is the dominating sub-segment in the electric vehicle market by vehicle type holding around 80-85% of market share. The government regulations and emission reduction targets are primarily focused on passenger cars. The consumer awareness and environmental concerns are driving a shift towards electric passenger cars.
REGIONAL ANALYSES
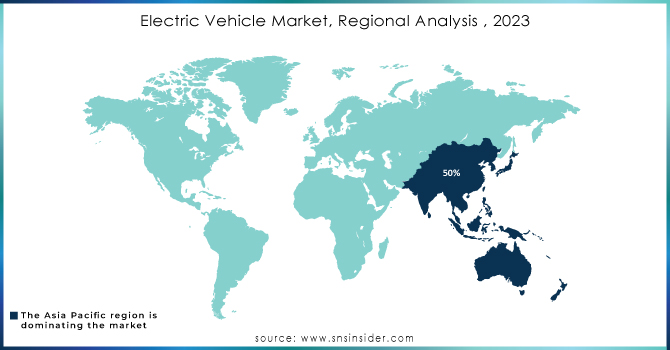
The Asia Pacific dominates the EV market, holding around 50% of the market share. China, being a powerhouse in battery manufacturing, drives this charge well with strong government support wherein subsidies, quotas, and lax emission regulations have been provided. Growing environmental awareness and rising disposable incomes in China further fuel this dominance. Europe comes as the second highest region in this market. The strict emission regulations across the continent have spurred automakers to prioritize EV development. These, coupled with government incentives such as tax breaks, are solidifying the position of Europe, which has environmentally conscious consumers.
North America represents the fastest-growing region for the electric vehicle market. The rapid growth is fueled by increasing environmental awareness and technological advancements in EV by major automakers. Government incentives in the form of tax credits are attracting consumers to shift towards EVs.
KEY PLAYERS
The major key players are BMW Group, BYD Company Ltd., Daimler AG, Ford Motor Company, General Motor Company, Nissan Motor Corporation, Tesla, Toyota Motor Corporation, Volkswagen AG, Group Renault and other key players.
RECENT DEVELOPMENT
-
In June 2023: EVBox launches the EVBox Troniq High Power, its most powerful charging station yet at 400 kW. This pacesetting technology is the first standalone charger of its kind to be field-tested in Europe, ensuring a reliable and efficient EV charging experience.
-
In April 2023: Stellantis NV introduced the 2025 Ram 1500 REV, Ram Truck's first-ever electric light-duty pickup. This marks Ram's debut in the EV market, showcasing their dedication to sustainable solutions and innovative technology. The 1500 REV paves the way for a future lineup of electrified Ram vehicles.
| Report Attributes | Details |
| Market Size in 2023 | US$ 491.7 Bn |
| Market Size by 2032 | US$ 1570.12 Bn |
| CAGR | CAGR of 12.34 % From 2024 to 2032 |
| Base Year | 2023 |
| Forecast Period | 2024-2032 |
| Historical Data | 2020-2022 |
| Report Scope & Coverage | Market Size, Segments Analysis, Competitive Landscape, Regional Analysis, DROC & SWOT Analysis, Forecast Outlook |
| Key Segments | • By Vehicle Type (Passenger Car, Commercial Vehicle) • By Propulsion Type (BEV, HEV) • By Drive Type (All Wheel Drive, Front Wheel Drive, Rear Wheel Drive) • By Range (Upto-150 Miles, 151-300 Miles, Above300 Miles) • By Component (Battery Pack & High Voltage Component, Motor, Brake, Wheel & Suspension, Body & Chassis, Low Voltage Electric Component) |
| Regional Analysis/Coverage | North America (US, Canada, Mexico), Europe (Eastern Europe [Poland, Romania, Hungary, Turkey, Rest of Eastern Europe] Western Europe] Germany, France, UK, Italy, Spain, Netherlands, Switzerland, Austria, Rest of Western Europe]). Asia Pacific (China, India, Japan, South Korea, Vietnam, Singapore, Australia, Rest of Asia Pacific), Middle East & Africa (Middle East [UAE, Egypt, Saudi Arabia, Qatar, Rest of Middle East], Africa [Nigeria, South Africa, Rest of Africa], Latin America (Brazil, Argentina, Colombia Rest of Latin America) |
| Company Profiles | BMW Group, BYD Company Ltd., Daimler AG, Ford Motor Company, General Motor Company, Nissan Motor Corporation, Tesla, Toyota Motor Corporation, Volkswagen AG, Group Renault |
| Key Drivers | • The price increase is due to increased demand for gasoline. |
| Market Restraints | • The initial cost of constructing a quick charging system is significantly higher when compared to gasoline, CNG, or LPG fuel stations. |
Frequently Asked Questions
Ans: Some of the best-selling pure electric vehicles in the world include the Tesla Model 3, Wuling Hongguang Mini EV, Tesla Model Y, VW ID.4, Li Xiang One, BYD Han EV, BYD Dolphin, Changan EV, VW ID.3, and Nissan Leaf.
Ans: For the past 2-3 years, global automotive manufacturers, including BYD, Tesla, and Nissan, have led the EV industry.
Ans: Electric Vehicle Market size was valued at USD 491.7 billion in 2023.
Ans: The market is is expected to reach at USD 1570.12 billion by 2032.
Ans: Electric Vehicle Market is anticipated to expand by 12.34% from 2024 to 2032.
Get in Touch
