Electric Wall Heater Market Report Scope & Overview:
To get more information on Electric Wall Heater Market - Request Free Sample Report
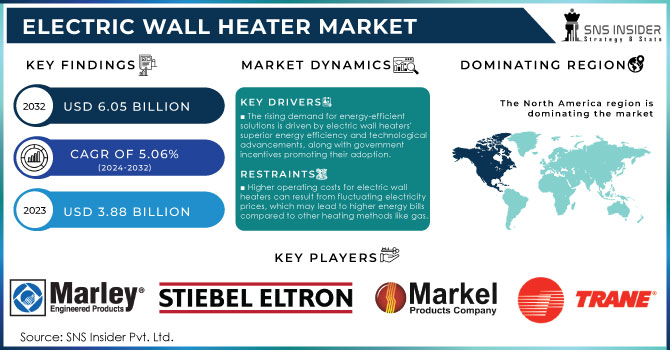
The Electric Wall Heater Market size was esteemed at USD 3.88 billion in 2023 and is supposed to arrive at USD 6.05 billion by 2032, with a growing CAGR of 5.06% over the forecast period 2024-2032.
The Electric Wall Heater Market has been experiencing steady growth driven by the increasing demand for energy-efficient heating solutions in residential, commercial, and industrial spaces. These heaters are popular due to their ability to provide localized heating with minimal space usage. They are typically installed in areas where central heating is unnecessary, like smaller rooms, garages, or offices. The rise in smart home technologies and the growing trend towards green, energy-saving appliances have boosted the market. Consumers are opting for electric wall heaters as a more environmentally friendly and cost-effective option compared to traditional fuel-based heaters.
Current market growth is fueled by rising construction activities, urbanization, and advancements in heating technologies. The market is also benefiting from the integration of features like programmable thermostats and Wi-Fi connectivity, which enable users to control heaters remotely, optimizing energy use. North America, particularly the United States, remains one of the key markets for electric wall heaters. The demand is high in colder regions and in residential applications where older heating systems are being replaced. In terms of recent trends, there has been a shift towards more compact and aesthetically designed heaters that complement modern interiors. Smart features, like app-based control and energy efficiency tracking, are becoming common, appealing to tech-savvy consumers. Additionally, the demand for low-noise, quick-heating models is growing, particularly in office and residential settings.
The United States is facing challenges related to electric wall heater sales and manufacturing volumes, largely due to fluctuations in raw material costs and supply chain disruptions. While domestic manufacturing remains strong, there has been a push towards sourcing components from overseas suppliers, which has impacted production timelines. Sales in the U.S. market have remained stable, with a growing preference for energy-efficient, eco-friendly heaters. However, manufacturers are under pressure to balance affordability with advanced features, as consumers expect better functionality without significantly higher costs.
MARKET DYNAMICS
DRIVERS
- The rising demand for energy-efficient solutions is driven by electric wall heaters' superior energy efficiency and technological advancements, along with government incentives promoting their adoption.
The increasing demand for energy-efficient solutions is significantly influenced by the advancements in electric wall heaters, which are renowned for their superior energy efficiency. These heaters use advanced technologies such as infrared heating and precise temperature controls to minimize energy wastage. Unlike traditional heating systems, electric wall heaters convert nearly all the electrical energy into heat, ensuring optimal performance with minimal energy loss. This efficiency is further enhanced by innovations such as smart thermostats and programmable timers that allow users to tailor heating schedules and reduce unnecessary energy consumption.
Government incentives have also played a crucial role in driving the adoption of these energy-efficient solutions. Many governments offer rebates, tax credits, and subsidies to encourage the use of energy-efficient appliances, including electric wall heaters. These incentives not only make the initial investment more affordable but also highlight the long-term savings on energy bills. By promoting the adoption of such technologies, governments aim to reduce overall energy consumption and greenhouse gas emissions, aligning with broader environmental goals. Consequently, the combination of technological advancements in electric wall heaters and supportive government policies creates a compelling case for their increased adoption, as consumers seek both cost-effective and eco-friendly heating solutions.
- Technological advancements, including smart features like Wi-Fi connectivity and programmable thermostats, are attracting consumers by enhancing convenience and control in electric wall heaters.
Technological advancements in electric wall heaters, such as smart features including Wi-Fi connectivity and programmable thermostats, are significantly boosting consumer interest by offering enhanced convenience and control. Wi-Fi connectivity allows users to remotely monitor and adjust heater settings through smartphone apps, providing greater flexibility and energy management from anywhere. Programmable thermostats enable users to set precise heating schedules, optimizing energy use and maintaining comfort efficiently. These innovations not only streamline operation but also integrate seamlessly into modern smart home systems, appealing to tech-savvy consumers seeking convenience and cost savings. As a result, electric wall heaters with these advanced features are increasingly favored for their ability to deliver personalized comfort and energy efficiency, thereby driving market growth.
RESTRAIN
- Higher operating costs for electric wall heaters can result from fluctuating electricity prices, which may lead to higher energy bills compared to other heating methods like gas.
Higher operating costs for electric wall heaters can be a significant concern, primarily due to fluctuating electricity prices. Unlike gas heating systems, which often benefit from more stable and sometimes lower fuel costs, electric heaters are directly impacted by the volatility of electricity rates. When electricity prices spike, the cost of running an electric heater increases correspondingly, leading to higher energy bills. This fluctuation can make electric heating less predictable and potentially more expensive over time, especially during periods of high demand or price surges. In contrast, gas heating systems might offer more consistent and often lower operating costs, providing a more stable and economical heating solution. Thus, while electric wall heaters can be convenient, their susceptibility to rising electricity prices can result in elevated and unpredictable operating expenses compared to alternative heating methods.
KEY MARKET SEGMENTATION
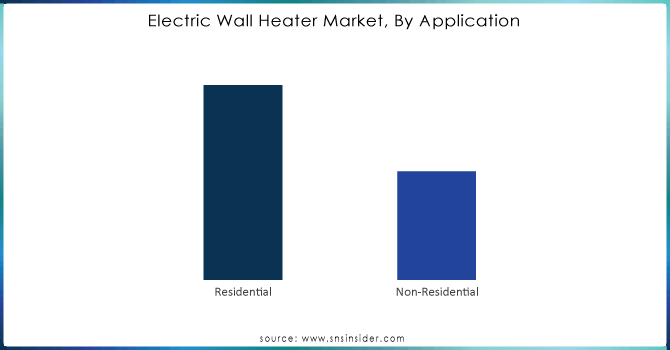
By Application
The residential segment dominated the market share over 65.02% in 2023. This dominance stems from the ease of installation, efficient heating in targeted areas, and overall convenience electric wall heaters offer for homes.
Need any customization research on Electric Wall Heater Market - Enquiry Now
By Power
The 1000 to 1600-Watt segment dominated the market share over 36.08% in 2023, because of the requirement for energy proficient high limit warmers and warming arrangements in private and business applications. This is supposed to expand the interest of 1000 to 1600-Watt electric wall radiators during the estimated time frame.
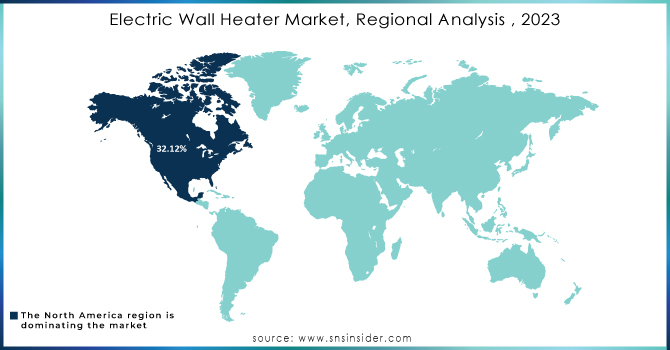
REGIONAL ANALYSIS
The North American dominated the market share over 32.12% in 2023., owing to rising urbanization, a surge in demand for comfort and convenience in homes, and a quickly changing lifestyle.
The Asia-Pacific Electric Wall Heater Market is expected to grow at the fastest CAGR from 2024 to 2032. This is due to increased usage of smart home technologies, and the growing trend towards home automation. Moreover, China’s Electric Wall Heater Market held the largest market share, and the Indian Electric Wall Heater Market was the fastest growing market in the Asia-Pacific region.
KEY PLAYERS
Some of the major key players of Electric Wall Heater Market
- Marley Engineered Products,- (Electro-Motive series)
- Stiebel Eltron Inc. - (CK 15 E, CK 25 E)
- Markel Products Company - (Electric Wall Heater Model 01893)
- Trane - (Trane Electric Wall Heater)
- Broan, Inc. - (Broan 198 Wall Heater)
- WarmlyYours.com, Inc.,. - (TempZone™ Electric Radiant Wall Heater)
- King Electric - (W Series Wall Heater)
- Indeeco - (Indeeco Electric Wall Heater)
- Glen Dimplex Group,- (Dimplex Panel Heater)
- Radiant System - (Radiant Wall Heater)
- Cadet Manufacturing Company - (Cadet Com-Pak Plus)
- Dimplex North America Limited - (Dimplex Touch Screen Heater)
- Fahrenheat - (Fahrenheat FUH Electric Wall Heater)
- QMark Heating Products - (QMark Electric Wall Heater)
- Honeywell International Inc. - (Honeywell Electric Wall Heater)
- DeLonghi America, Inc. - (DeLonghi Slim Style Convection Heater)
- Econo-Heat, Inc. - (Econo-Heat Panel Heater)
- Rinnai Corporation - (Rinnai Electric Wall Heater)
- Convectair NMT, Inc. - (Convectair Wall Heater)
- NewAir - (NewAir Electric Wall Heater)
- Others
RECENT DEVELOPMENT
In February 2024: industry veteran Marley Engineered Products announced a new line of eco-friendly heaters boasting recycled steel bodies and improved insulation for minimized heat loss.
In March 2024: Stiebel Eltron, a German powerhouse, unveiled its latest model, focusing on smart home integration with voice-controlled temperature adjustments and Wi-Fi connectivity.
| Report Attributes | Details |
|---|---|
| Market Size in 2023 | US$ 3.88 Billion |
| Market Size by 2032 | US$ 6.05 Billion |
| CAGR | CAGR of 5.06% From 2024 to 2032 |
| Base Year | 2023 |
| Forecast Period | 2024-2032 |
| Historical Data | 2020-2022 |
| Report Scope & Coverage | Market Size, Segments Analysis, Competitive Landscape, Regional Analysis, DROC & SWOT Analysis, Forecast Outlook |
| Key Segments | • by Application (Residential and Non-Residential) • by Power (<1000>2000 Watt) |
| Regional Analysis/Coverage | North America (US, Canada, Mexico), Europe (Eastern Europe [Poland, Romania, Hungary, Turkey, Rest of Eastern Europe] Western Europe] Germany, France, UK, Italy, Spain, Netherlands, Switzerland, Austria, Rest of Western Europe]), Asia Pacific (China, India, Japan, South Korea, Vietnam, Singapore, Australia, Rest of Asia Pacific), Middle East & Africa (Middle East [UAE, Egypt, Saudi Arabia, Qatar, Rest of Middle East], Africa [Nigeria, South Africa, Rest of Africa], Latin America (Brazil, Argentina, Colombia, Rest of Latin America) |
| Company Profiles | Marley Engineered Products,- (Electro-Motive series), Stiebel Eltron Inc. - (CK 15 E, CK 25 E), Markel Products Company - (Electric Wall Heater Model 01893), Trane - (Trane Electric Wall Heater), Broan, Inc. - (Broan 198 Wall Heater), WarmlyYours.com, Inc.,. - (TempZone™ Electric Radiant Wall Heater), King Electric - (W Series Wall Heater), Indeeco - (Indeeco Electric Wall Heater), Glen Dimplex Group,- (Dimplex Panel Heater), Radiant System - (Radiant Wall Heater), Cadet Manufacturing Company - (Cadet Com-Pak Plus), Dimplex North America Limited - (Dimplex Touch Screen Heater), Fahrenheat - (Fahrenheat FUH Electric Wall Heater), QMark Heating Products - (QMark Electric Wall Heater), Honeywell International Inc. - (Honeywell Electric Wall Heater), DeLonghi America, Inc. - (DeLonghi Slim Style Convection Heater), Econo-Heat, Inc. - (Econo-Heat Panel Heater), Rinnai Corporation - (Rinnai Electric Wall Heater), Convectair NMT, Inc. - (Convectair Wall Heater), NewAir - (NewAir Electric Wall Heater) |
| Key Drivers | • The rising demand for energy-efficient solutions is driven by electric wall heaters' superior energy efficiency and technological advancements, along with government incentives promoting their adoption. • Technological advancements, including smart features like Wi-Fi connectivity and programmable thermostats, attract consumers by enhancing convenience and control in electric wall heaters. |
Get in Touch
