Overhead Cranes Market Report Scope & Overview:

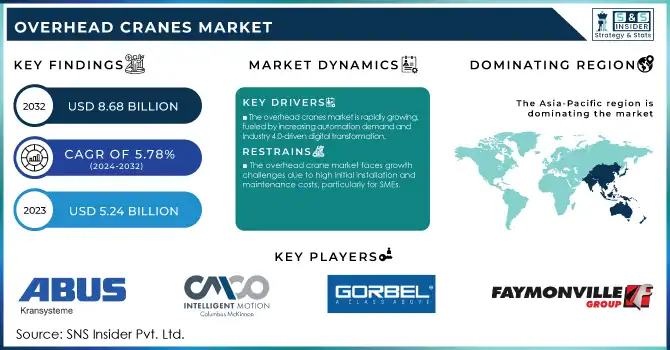
The Overhead Cranes Market size was valued at USD 5.54 Billion in 2024 and is expected to reach USD 8.69 Billion by 2032 and grow at a CAGR of 5.78% over the forecast period 2025-2032.

The Overhead Cranes Market has experienced substantial growth, driven by technological advancements, rising industrial demand, and increased automation in key sectors. Approximately 70% of cranes used in the market today are being integrated with IoT technologies and AI-driven systems to improve performance and maintenance scheduling, reducing downtime by up to 30%. The adoption of these smart systems is expected to grow as industries focus on predictive maintenance, energy savings, and overall efficiency. Electric overhead cranes are becoming increasingly popular, with a shift towards greener alternatives in line with stricter environmental regulations. 

Overhead Cranes Market Revenue Analysis

To Get More Information on Overhead Cranes Market - Request Sample Report

Demand for compact and lighter cranes has also surged, particularly in regions with high-density industrial setups. Companies are now focusing on reducing the size of cranes by utilizing advanced materials like aluminum and carbon fiber, which offer the same lifting capacity with a reduced structural weight. This trend has driven new design innovations that are expected to further revolutionize the market. Furthermore, overhead crane systems are increasingly being integrated with other material handling equipment, such as conveyor belts and automated guided vehicles (AGVs), to enhance workflow in warehouses and manufacturing plants. This integration is part of a broader move towards digitalization, with many large facilities investing in centralized control systems that can monitor and optimize crane performance in real-time.

Key Overhead Cranes Market Trends

  • Deployment of smart load-monitoring systems enabling real-time performance tracking and accident prevention.

  • Expansion of energy-efficient lifting solutions integrating regenerative drives for reduced operational costs.

  • Advancement in modular crane architectures facilitating flexible installation and easy scalability.

  • Increasing reliance on remote-controlled operations enhancing worker safety in hazardous zones.

  • Adoption of cloud-based fleet management platforms ensuring optimized scheduling and downtime reduction.

Overhead Cranes Market Growth Drivers:

  • The overhead cranes market is growing rapidly due to the rising demand for automation and smart technologies, driven by Industry 4.0 and digital transformation.

The overhead cranes market is experiencing significant growth driven by the increasing demand for automation and smart technologies, particularly with the rise of Industry 4.0 and digital transformation across industries. Automation technologies such as Internet of Things (IoT) sensors, AI-driven control systems, and predictive maintenance tools are revolutionizing crane operations by enhancing performance, reducing downtime, and optimizing workflow. These innovations enable industries to boost operational efficiency, improve safety, and minimize human intervention. Smart technologies allow cranes to adapt to changing environments, predict potential failures, and optimize load handling in real-time, further contributing to the rise in demand. As industries such as manufacturing, construction, and logistics adopt advanced solutions to meet the growing need for operational efficiency, overhead cranes with integrated smart technologies are becoming essential tools. Furthermore, the trend towards predictive maintenance is reducing long-term costs associated with repairs and unscheduled downtimes, adding to the appeal of technologically advanced cranes. This shift toward digitalized operations is not only enhancing productivity but is also helping industries achieve higher standards of precision and safety. Overall, the growing adoption of automation in manufacturing and material handling is fueling the expansion of the overhead cranes market, which is expected to continue growing as more sectors embrace smart, connected systems.

Overhead Cranes Market Restraints:

  • The overhead crane market faces growth challenges due to high initial installation and maintenance costs, particularly for SMEs.

The overhead crane market, while experiencing significant growth, faces a key restraint in the form of high initial installation and maintenance costs. These cranes are essential in industries such as manufacturing, construction, and logistics, but their adoption is hindered by the substantial upfront investment required for purchase, installation, and integration, especially for advanced models equipped with automation and smart features. For small and medium-sized enterprises (SMEs), this cost barrier can be prohibitive, limiting their ability to adopt these systems despite the potential productivity and efficiency benefits. Moreover, maintenance costs for these specialized cranes can be high, particularly for those used in heavy industries, which require frequent servicing and specialized parts. This ongoing expense further limits the affordability and accessibility of overhead cranes for many businesses. However, the market is seeing trends that aim to reduce these barriers, such as the development of cost-effective, modular crane systems, and advancements in predictive maintenance technology, which can reduce downtime and maintenance costs over time. Despite the initial financial challenges, the overhead crane market continues to grow, driven by technological innovations, increased automation, and the rising demand for efficient material handling solutions across industries.

Overhead Cranes Market Segment Analysis

By Type

Bridge cranes segment dominated with the market share over 37% in 2024, due to their high versatility and broad applications across various industries. They are designed to move heavy loads over large areas, making them ideal for complex lifting tasks in industries like construction, automotive, manufacturing, and shipping. The ability of bridge cranes to span vast workspaces and provide precise load handling boosts their demand, especially in heavy-duty environments. Their robust structure and high capacity for lifting heavy materials make them essential for operations requiring large-scale, efficient lifting solutions. Furthermore, the adaptability of bridge cranes in different industrial settings whether for lifting raw materials, assembling components, or loading goods further increases their popularity.

By Lifting Capacity

The Up to 5 Ton segment dominated with the market share over 42% in 2024, due to its widespread adoption across various industries. Cranes with a lifting capacity of up to 5 tons are commonly used in manufacturing, warehouses, and logistics, where they handle lighter loads and offer efficient lifting solutions for routine operations. These cranes are ideal for tasks such as material handling, assembly, and moving small equipment, making them essential in many sectors. The popularity of this segment is also driven by their cost-effectiveness, as they are less expensive to purchase, operate, and maintain compared to higher-capacity cranes. Furthermore, they cater to a broad range of applications, from small-scale manufacturing units to large distribution centers, offering versatility and ease of use.

Overhead Cranes Market Regional Outlook

Asia-Pacific Overhead Cranes Market Insights

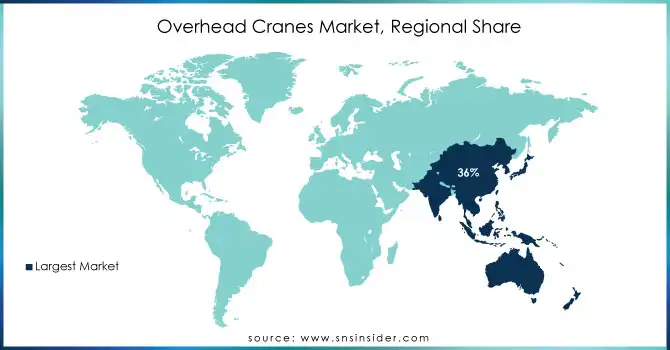
Asia-Pacific region dominated with the market share over 36% in 2024. This dominance is driven by the rapid industrialization in countries like China, India, Japan, and South Korea, where manufacturing and construction sectors are flourishing. The region’s extensive infrastructure development, including the expansion of ports, logistics, and warehouses, has led to an increased demand for overhead cranes for efficient material handling and lifting operations. Additionally, the presence of key crane manufacturers in Asia-Pacific, coupled with affordable production costs, has made the region a major hub for both production and consumption.

North America Overhead Cranes Market Insights

North America is witnessing the fastest growth in the overhead cranes market, driven by the surge in industrial activities, including automotive manufacturing, aerospace, and construction. In the United States and Canada, key industries are increasingly adopting automated overhead cranes to improve efficiency and safety in material handling. With technological advancements in crane systems, such as smart sensors and IoT connectivity, North America is moving toward more sophisticated, energy-efficient solutions. The region is also experiencing a shift towards modernization and retrofitting of existing crane systems to enhance performance and reduce downtime.

Europe Overhead Cranes Market Insights

Europe’s overhead cranes market growth is propelled by strong automotive, aerospace, and heavy manufacturing sectors. Industrial automation, facility modernization, and retrofitting of outdated cranes are increasing adoption of advanced crane solutions. Countries such as Germany, France, and Italy focus on energy-efficient, durable, and IoT-enabled cranes to improve productivity, safety, and reduce downtime. Government initiatives supporting industrial innovation further enhance market opportunities. Additionally, increasing demand for specialized lifting solutions in ports, warehouses, and manufacturing plants strengthens the region’s position, creating substantial opportunities for domestic and international overhead crane manufacturers and suppliers.

Middle East & Africa Overhead Cranes Market Insights

The Middle East and Africa region experiences steady growth due to large-scale construction, mining, and oil & gas projects. Countries like Saudi Arabia, UAE, and South Africa are investing in industrial infrastructure requiring heavy-duty and reliable overhead cranes. The market benefits from government initiatives in energy, logistics, and industrial automation. Crane adoption focuses on high durability, load capacity, and safety, suitable for challenging environments. Expansion of ports, warehouses, and manufacturing facilities further drives demand. Both domestic and international manufacturers are leveraging these opportunities to supply advanced material handling equipment tailored for the region’s industrial and infrastructural requirements.

Latin America Overhead Cranes Market Insights

Latin America’s overhead cranes market is expanding steadily, with Brazil, Mexico, and Argentina leading industrial growth. Infrastructure investments, including ports, warehouses, and manufacturing plants, are boosting demand for efficient material handling solutions. Key industries such as automotive, construction, and mining are increasingly adopting cranes to enhance operational efficiency, productivity, and safety. Technological adoption, including semi-automated and automated crane systems, is gradually rising, while modernization and replacement of obsolete equipment create additional opportunities. 

Overhead-Cranes-Market-Regional-Share

Do You Need any Customization Research on Overhead Cranes Market - Inquire Now

Overhead Cranes Market Companies:

  • ABUS Kransysteme GmbH

  • GH Cranes & Components

  • Konecranes Plc

  • Jaso Industrial Cranes

  • Columbus McKinnon Corporation (CMCO)

  • EMH, Inc.

  • Gorbel Cranes

  • Kito Corporation

  • Ralf Teichmann GmbH

  • Sumitomo Heavy Industries Material Handling Systems Co., Ltd.

  • Weihua Group

  • Terex Corporation

  • Liebherr Group

  • Sany Group

  • Cargotec Corporation

  • Dongqi Crane

  • DHS Crane

  • ZPMC (Shanghai Zhenhua Heavy Industries Co.)

  • Demag Cranes & Components

  • Faymonville

Competitive Landscape for Overhead Cranes Market:

Konecranes Oyj, founded in 1994, is headquartered in Hyvinkää, Finland. The company specializes in designing, manufacturing, and servicing cranes and lifting equipment, serving diverse sectors including manufacturing, automotive, steel, and paper industries. Konecranes operates globally, providing material handling solutions that enhance productivity and safety.

  • In August 2024: Konecranes unveiled the Konecranes X-series industrial crane, a successor to the popular CXT model. Featuring a compact design, advanced technology, and lifting capacities up to 20 tons, the X-series is designed to enhance industrial lifting with improved efficiency and operator experience, including wireless upgrades, ergonomic radio controls, and low headroom hoists, all while reducing environmental impact.

  • In September 2023: Engineered Material Handling (EMH) introduced a single-leg semi-gantry crane to optimize overhead crane usage. With a 10-ton capacity, its poly wheel design eliminates the need for floor rails, reducing costs and enhancing floor safety.

Overhead Cranes Market Report Scope:

Report Attributes Details
Market Size in 2024 USD 5.54 Billion 
Market Size by 2032 USD 8.69 Billion 
CAGR CAGR of 5.78% From 2025 to 2032
Base Year 2024
Forecast Period 2025-2032
Historical Data 2021-2023
Report Scope & Coverage Market Size, Segments Analysis, Competitive  Landscape, Regional Analysis, DROC & SWOT Analysis, Forecast Outlook
Key Segments • By Type (Gantry Cranes, Jib Cranes, Bridge Cranes, Others)
• By Lifting Capacity (Up to 5 Ton, 6-10 Ton, 11-50 Ton, More Than 50 Ton)
• By End Use Industry (Manufacturing, Automotive and Transportation, Construction, Metal and Mining, Power and Utilities, Ports and Shipyards, Others)
Regional Analysis/Coverage

North America (US, Canada), Europe (Germany, France, UK, Italy, Spain, Poland, Russsia, Rest of Europe), Asia Pacific (China, India, Japan, South Korea, Australia, ASEAN Countries, Rest of Asia Pacific), Middle East & Africa (UAE, Saudi Arabia, Qatar, Egypt, South Africa, Rest of Middle East & Africa), Latin America (Brazil, Argentina,     Mexico, Colombia Rest of Latin America)

Company Profiles ABUS Kransysteme GmbH, Columbus McKinnon Corporation (CMCO), EMH, Inc., GH Cranes & Components, Gorbel Cranes, Kito Corporation, Konecranes Plc, Ralf Teichmann GmbH, Sumitomo Heavy Industries Material Handling Systems Co., Ltd., Weihua Group, Terex Corporation, Liebherr Group, Jaso Industrial Cranes, Sany Group, Cargotec Corporation, Dongqi Crane, DHS Crane, ZPMC (Shanghai Zhenhua Heavy Industries Co.), Demag Cranes & Components, Faymonville.

Table Of Contents

1. Introduction

 1.1 Market Definition & Scope

 1.2 Research Assumptions & Abbreviations

 1.3 Research Methodology

2. Executive Summary

2.1 Market Snapshot

 2.2 Market Absolute $ Opportunity Assessment & Y-o-Y Analysis, 2021–2032

 2.3 Market Size & Forecast, By Segmentation, 2021–2032

  2.3.1 Market Size By Type

  2.3.2 Market Size By Lifting Capacity

  2.3.3 Market Size By End Use Industry

 2.4 Market Share & Bps Analysis By Region, 2024

 2.5 Industry Growth Scenarios – Conservative, Likely & Optimistic

 2.6 Industry CxO’s Perspective

3. Market Overview

 3.1 Market Dynamics

  3.1.1 Drivers

  3.1.2 Restraints

  3.1.3 Opportunities

  3.1.4 Key Market Trends

 3.2 Industry PESTLE Analysis

 3.3 Key Industry Forces (Porter’s) Impacting Market Growth

 3.4 Industry Supply Chain Analysis

  3.4.1 Raw Material Suppliers

  3.4.2 Manufacturers

  3.4.3 Distributors/Suppliers

  3.4.4 Customers/End-Users

 3.5 Industry Life Cycle Assessment

 3.6 Parent Market Overview

 3.7 Market Risk Assessment

4. Statistical Insights & Trends Reporting

 4.1 Eco-Friendly Operations & Regulatory Compliance in Manufacturing

 4.2 Adoption of Smart Control & Predictive Maintenance Systems

 4.3 Distribution Network Risk Analysis & Component Supply Dependence

 4.4 Advanced Automation & Intelligent Lifting Technologies

 4.5 Strategic Alliances, Mergers & Global Market Expansion

5. Overhead Cranes Market Segmental Analysis & Forecast, By Type, 2021 – 2032, Value (USD Billion)

 5.1 Introduction

 5.2 Gantry Cranes

  5.2.1 Key Trends

  5.2.2 Market Size & Forecast, 2021 – 2032

 5.3 Jib Cranes

  5.3.1 Key Trends

  5.3.2 Market Size & Forecast, 2021 – 2032

 5.4 Bridge Cranes

  5.4.1 Key Trends

  5.4.2 Market Size & Forecast, 2021 – 2032

 5.5 Others

  5.5.1 Key Trends

  5.5.2 Market Size & Forecast, 2021 – 2032

6. Overhead Cranes Market Segmental Analysis & Forecast, By Lifting Capacity, 2021 – 2032, Value (USD Billion)

 6.1 Introduction

 6.2 Up to 5 Ton

  6.2.1 Key Trends

  6.2.2 Market Size & Forecast, 2021 – 2032

 6.3 6–10 Ton

  6.3.1 Key Trends

  6.3.2 Market Size & Forecast, 2021 – 2032

 6.4 11–50 Ton

  6.4.1 Key Trends

  6.4.2 Market Size & Forecast, 2021 – 2032

 6.5 More Than 50 Ton

  6.5.1 Key Trends

  6.5.2 Market Size & Forecast, 2021 – 2032

7. Overhead Cranes Market Segmental Analysis & Forecast, By End Use Industry, 2021 – 2032, Value (USD Billion)

 7.1 Introduction

 7.2 Manufacturing

  7.2.1 Key Trends

  7.2.2 Market Size & Forecast, 2021 – 2032

 7.3 Automotive and Transportation

  7.3.1 Key Trends

  7.3.2 Market Size & Forecast, 2021 – 2032

 7.4 Construction

  7.4.1 Key Trends

  7.4.2 Market Size & Forecast, 2021 – 2032

 7.5 Metal and Mining

  7.5.1 Key Trends

  7.5.2 Market Size & Forecast, 2021 – 2032

 7.6 Power and Utilities

  7.6.1 Key Trends

  7.6.2 Market Size & Forecast, 2021 – 2032

 7.7 Ports and Shipyards

  7.7.1 Key Trends

  7.7.2 Market Size & Forecast, 2021 – 2032

 7.8 Others

  7.8.1 Key Trends

  7.8.2 Market Size & Forecast, 2021 – 2032

8. Oil Country Tubular Goods Market Segmental Analysis & Forecast By Region, 2021 – 2025, Value (USD Billion)

8.1 Introduction

8.2 North America

 8.2.1 Key Trends

 8.2.2 Oil Country Tubular Goods Market Size & Forecast, By Type, 2021 – 2032

 8.2.3 Oil Country Tubular Goods Market Size & Forecast, By Lifting Capacity, 2021 – 2032

 8.2.4 Oil Country Tubular Goods Market Size & Forecast, By End Use Industry, 2021 – 2032

 8.2.5 Oil Country Tubular Goods Market Size & Forecast, By Country, 2021 – 2032

  8.2.5.1 USA

   8.2.5.1.1 Oil Country Tubular Goods Market Size & Forecast, By Type, 2021 – 2032

   8.2.5.1.2 Oil Country Tubular Goods Market Size & Forecast, By Lifting Capacity, 2021 – 2032

   8.2.5.1.3 Oil Country Tubular Goods Market Size & Forecast, By End Use Industry, 2021 – 2032

  8.2.5.2 Canada

   8.2.5.2.1 Oil Country Tubular Goods Market Size & Forecast, By Type, 2021 – 2032

   8.2.5.2.2 Oil Country Tubular Goods Market Size & Forecast, By Lifting Capacity, 2021 – 2032

   8.2.5.2.3 Oil Country Tubular Goods Market Size & Forecast, By End Use Industry, 2021 – 2032

8.3 Europe

 8.3.1 Key Trends

 8.3.2 Oil Country Tubular Goods Market Size & Forecast, By Type, 2021 – 2032

 8.3.3 Oil Country Tubular Goods Market Size & Forecast, By Lifting Capacity, 2021 – 2032

 8.3.4 Oil Country Tubular Goods Market Size & Forecast, By End Use Industry, 2021 – 2032

 8.3.5 Oil Country Tubular Goods Market Size & Forecast, By Country, 2021 – 2032

  8.3.5.1 Germany

   8.3.5.1.1 Oil Country Tubular Goods Market Size & Forecast, By Type, 2021 – 2032

   8.3.5.1.2 Oil Country Tubular Goods Market Size & Forecast, By Lifting Capacity, 2021 – 2032

   8.3.5.1.3 Oil Country Tubular Goods Market Size & Forecast, By End Use Industry, 2021 – 2032

  8.3.5.2 UK

   8.3.5.2.1 Oil Country Tubular Goods Market Size & Forecast, By Type, 2021 – 2032

   8.3.5.2.2 Oil Country Tubular Goods Market Size & Forecast, By Lifting Capacity, 2021 – 2032

   8.3.5.2.3 Oil Country Tubular Goods Market Size & Forecast, By End Use Industry, 2021 – 2032

  8.3.5.3 France

   8.3.5.3.1 Oil Country Tubular Goods Market Size & Forecast, By Type, 2021 – 2032

   8.3.5.3.2 Oil Country Tubular Goods Market Size & Forecast, By Lifting Capacity, 2021 – 2032

   8.3.5.3.3 Oil Country Tubular Goods Market Size & Forecast, By End Use Industry, 2021 – 2032

  8.3.5.4 Italy

   8.3.5.4.1 Oil Country Tubular Goods Market Size & Forecast, By Type, 2021 – 2032

   8.3.5.4.2 Oil Country Tubular Goods Market Size & Forecast, By Lifting Capacity, 2021 – 2032

   8.3.5.4.3 Oil Country Tubular Goods Market Size & Forecast, By End Use Industry, 2021 – 2032

  8.3.5.5 Spain

   8.3.5.5.1 Oil Country Tubular Goods Market Size & Forecast, By Type, 2021 – 2032

   8.3.5.5.2 Oil Country Tubular Goods Market Size & Forecast, By Lifting Capacity, 2021 – 2032

   8.3.5.5.3 Oil Country Tubular Goods Market Size & Forecast, By End Use Industry, 2021 – 2032

  8.3.5.6 Russia

   8.3.5.6.1 Oil Country Tubular Goods Market Size & Forecast, By Type, 2021 – 2032

   8.3.5.6.2 Oil Country Tubular Goods Market Size & Forecast, By Lifting Capacity, 2021 – 2032

   8.3.5.6.3 Oil Country Tubular Goods Market Size & Forecast, By End Use Industry, 2021 – 2032

  8.3.5.7 Poland

   8.3.5.7.1 Oil Country Tubular Goods Market Size & Forecast, By Type, 2021 – 2032

   8.3.5.7.2 Oil Country Tubular Goods Market Size & Forecast, By Lifting Capacity, 2021 – 2032

   8.3.5.7.3 Oil Country Tubular Goods Market Size & Forecast, By End Use Industry, 2021 – 2032

  8.3.5.8 Rest of Europe

   8.3.5.8.1 Oil Country Tubular Goods Market Size & Forecast, By Type, 2021 – 2032

   8.3.5.8.2 Oil Country Tubular Goods Market Size & Forecast, By Lifting Capacity, 2021 – 2032

   8.3.5.8.3 Oil Country Tubular Goods Market Size & Forecast, By End Use Industry, 2021 – 2032

8.4 Asia-Pacific

 8.4.1 Key Trends

 8.4.2 Oil Country Tubular Goods Market Size & Forecast, By Type, 2021 – 2032

 8.4.3 Oil Country Tubular Goods Market Size & Forecast, By Lifting Capacity, 2021 – 2032

 8.4.4 Oil Country Tubular Goods Market Size & Forecast, By End Use Industry, 2021 – 2032

 8.4.5 Oil Country Tubular Goods Market Size & Forecast, By Country, 2021 – 2032

  8.4.5.1 China

   8.4.5.1.1 Oil Country Tubular Goods Market Size & Forecast, By Type, 2021 – 2032

   8.4.5.1.2 Oil Country Tubular Goods Market Size & Forecast, By Lifting Capacity, 2021 – 2032

   8.4.5.1.3 Oil Country Tubular Goods Market Size & Forecast, By End Use Industry, 2021 – 2032

  8.4.5.2 India

   8.4.5.2.1 Oil Country Tubular Goods Market Size & Forecast, By Type, 2021 – 2032

   8.4.5.2.2 Oil Country Tubular Goods Market Size & Forecast, By Lifting Capacity, 2021 – 2032

   8.4.5.2.3 Oil Country Tubular Goods Market Size & Forecast, By End Use Industry, 2021 – 2032

  8.4.5.3 Japan

   8.4.5.3.1 Oil Country Tubular Goods Market Size & Forecast, By Type, 2021 – 2032

   8.4.5.3.2 Oil Country Tubular Goods Market Size & Forecast, By Lifting Capacity, 2021 – 2032

   8.4.5.3.3 Oil Country Tubular Goods Market Size & Forecast, By End Use Industry, 2021 – 2032

  8.4.5.4 South Korea

   8.4.5.4.1 Oil Country Tubular Goods Market Size & Forecast, By Type, 2021 – 2032

   8.4.5.4.2 Oil Country Tubular Goods Market Size & Forecast, By Lifting Capacity, 2021 – 2032

   8.4.5.4.3 Oil Country Tubular Goods Market Size & Forecast, By End Use Industry, 2021 – 2032

  8.4.5.5 Australia

   8.4.5.5.1 Oil Country Tubular Goods Market Size & Forecast, By Type, 2021 – 2032

   8.4.5.5.2 Oil Country Tubular Goods Market Size & Forecast, By Lifting Capacity, 2021 – 2032

   8.4.5.5.3 Oil Country Tubular Goods Market Size & Forecast, By End Use Industry, 2021 – 2032

  8.4.5.6 ASEAN Countries

   8.4.5.6.1 Oil Country Tubular Goods Market Size & Forecast, By Type, 2021 – 2032

   8.4.5.6.2 Oil Country Tubular Goods Market Size & Forecast, By Lifting Capacity, 2021 – 2032

   8.4.5.6.3 Oil Country Tubular Goods Market Size & Forecast, By End Use Industry, 2021 – 2032

  8.4.5.7 Rest of Asia-Pacific

   8.4.5.7.1 Oil Country Tubular Goods Market Size & Forecast, By Type, 2021 – 2032

   8.4.5.7.2 Oil Country Tubular Goods Market Size & Forecast, By Lifting Capacity, 2021 – 2032

   8.4.5.7.3 Oil Country Tubular Goods Market Size & Forecast, By End Use Industry, 2021 – 2032

8.5 Latin America

 8.5.1 Key Trends

 8.5.2 Oil Country Tubular Goods Market Size & Forecast, By Type, 2021 – 2032

 8.5.3 Oil Country Tubular Goods Market Size & Forecast, By Lifting Capacity, 2021 – 2032

 8.5.4 Oil Country Tubular Goods Market Size & Forecast, By End Use Industry, 2021 – 2032

 8.5.5 Oil Country Tubular Goods Market Size & Forecast, By Country, 2021 – 2032

  8.5.5.1 Brazil

   8.5.5.1.1 Oil Country Tubular Goods Market Size & Forecast, By Type, 2021 – 2032

   8.5.5.1.2 Oil Country Tubular Goods Market Size & Forecast, By Lifting Capacity, 2021 – 2032

   8.5.5.1.3 Oil Country Tubular Goods Market Size & Forecast, By End Use Industry, 2021 – 2032

  8.5.5.2 Argentina

   8.5.5.2.1 Oil Country Tubular Goods Market Size & Forecast, By Type, 2021 – 2032

   8.5.5.2.2 Oil Country Tubular Goods Market Size & Forecast, By Lifting Capacity, 2021 – 2032

   8.5.5.2.3 Oil Country Tubular Goods Market Size & Forecast, By End Use Industry, 2021 – 2032

  8.5.5.3 Mexico

   8.5.5.3.1 Oil Country Tubular Goods Market Size & Forecast, By Type, 2021 – 2032

   8.5.5.3.2 Oil Country Tubular Goods Market Size & Forecast, By Lifting Capacity, 2021 – 2032

   8.5.5.3.3 Oil Country Tubular Goods Market Size & Forecast, By End Use Industry, 2021 – 2032

  8.5.5.4 Colombia

   8.5.5.4.1 Oil Country Tubular Goods Market Size & Forecast, By Type, 2021 – 2032

   8.5.5.4.2 Oil Country Tubular Goods Market Size & Forecast, By Lifting Capacity, 2021 – 2032

   8.5.5.4.3 Oil Country Tubular Goods Market Size & Forecast, By End Use Industry, 2021 – 2032

  8.5.5.5 Rest of Latin America

   8.5.5.5.1 Oil Country Tubular Goods Market Size & Forecast, By Type, 2021 – 2032

   8.5.5.5.2 Oil Country Tubular Goods Market Size & Forecast, By Lifting Capacity, 2021 – 2032

   8.5.5.5.3 Oil Country Tubular Goods Market Size & Forecast, By End Use Industry, 2021 – 2032

8.6 Middle East & Africa

 8.6.1 Key Trends

 8.6.2 Oil Country Tubular Goods Market Size & Forecast, By Type, 2021 – 2032

 8.6.3 Oil Country Tubular Goods Market Size & Forecast, By Lifting Capacity, 2021 – 2032

 8.6.4 Oil Country Tubular Goods Market Size & Forecast, By End Use Industry, 2021 – 2032

 8.6.5 Oil Country Tubular Goods Market Size & Forecast, By Country, 2021 – 2032

  8.6.5.1 UAE

   8.6.5.1.1 Oil Country Tubular Goods Market Size & Forecast, By Type, 2021 – 2032

   8.6.5.1.2 Oil Country Tubular Goods Market Size & Forecast, By Lifting Capacity, 2021 – 2032

   8.6.5.1.3 Oil Country Tubular Goods Market Size & Forecast, By End Use Industry, 2021 – 2032

  8.6.5.2 Saudi Arabia

   8.6.5.2.1 Oil Country Tubular Goods Market Size & Forecast, By Type, 2021 – 2032

   8.6.5.2.2 Oil Country Tubular Goods Market Size & Forecast, By Lifting Capacity, 2021 – 2032

   8.6.5.2.3 Oil Country Tubular Goods Market Size & Forecast, By End Use Industry, 2021 – 2032

  8.6.5.3 Qatar

   8.6.5.3.1 Oil Country Tubular Goods Market Size & Forecast, By Type, 2021 – 2032

   8.6.5.3.2 Oil Country Tubular Goods Market Size & Forecast, By Lifting Capacity, 2021 – 2032

   8.6.5.3.3 Oil Country Tubular Goods Market Size & Forecast, By End Use Industry, 2021 – 2032

  8.6.5.4 Egypt

   8.6.5.4.1 Oil Country Tubular Goods Market Size & Forecast, By Type, 2021 – 2032

   8.6.5.4.2 Oil Country Tubular Goods Market Size & Forecast, By Lifting Capacity, 2021 – 2032

   8.6.5.4.3 Oil Country Tubular Goods Market Size & Forecast, By End Use Industry, 2021 – 2032

  8.6.5.5 South Africa

   8.6.5.5.1 Oil Country Tubular Goods Market Size & Forecast, By Type, 2021 – 2032

   8.6.5.5.2 Oil Country Tubular Goods Market Size & Forecast, By Lifting Capacity, 2021 – 2032

   8.6.5.5.3 Oil Country Tubular Goods Market Size & Forecast, By End Use Industry, 2021 – 2032

  8.6.5.6 Rest of Middle East & Africa

   8.6.5.6.1 Oil Country Tubular Goods Market Size & Forecast, By Type, 2021 – 2032

   8.6.5.6.2 Oil Country Tubular Goods Market Size & Forecast, By Lifting Capacity, 2021 – 2032

   8.6.5.6.3 Oil Country Tubular Goods Market Size & Forecast, By End Use Industry, 2021 – 2032

9. Competitive Landscape

 9.1 Key Players' Positioning

 9.2 Competitive Developments

  9.2.1 Key Strategies Adopted (%), By Key Players, 2024

  9.2.2 Year-Wise Strategies & Development, 2021 – 2025

  9.2.3 Number Of Strategies Adopted By Key Players, 2024

 9.3 Market Share Analysis, 2024

 9.4 Product/Service & Application Benchmarking

  9.4.1 Product/Service Specifications & Features By Key Players

  9.4.2 Product/Service Heatmap By Key Players

  9.4.3 Application Heatmap By Key Players

 9.5 Industry Start-Up & Innovation Landscape

9.6 Key Company Profiles

9.6.1 ABUS Kransysteme GmbH

  9.6.1.1 Company Overview & Snapshot

  9.6.1.2 Product/Service Portfolio

  9.6.1.3 Key Company Financials

  9.6.1.4 SWOT Analysis

 9.6.2 Columbus McKinnon Corporation (CMCO)

  9.6.2.1 Company Overview & Snapshot

  9.6.2.2 Product/Service Portfolio

  9.6.2.3 Key Company Financials

  9.6.2.4 SWOT Analysis

 9.6.3 EMH, Inc.

  9.6.3.1 Company Overview & Snapshot

  9.6.3.2 Product/Service Portfolio

  9.6.3.3 Key Company Financials

  9.6.3.4 SWOT Analysis

 9.6.4 GH Cranes & Components

  9.6.4.1 Company Overview & Snapshot

  9.6.4.2 Product/Service Portfolio

  9.6.4.3 Key Company Financials

  9.6.4.4 SWOT Analysis

 9.6.5 Gorbel Cranes

  9.6.5.1 Company Overview & Snapshot

  9.6.5.2 Product/Service Portfolio

  9.6.5.3 Key Company Financials

  9.6.5.4 SWOT Analysis

 9.6.6 Kito Corporation

  9.6.6.1 Company Overview & Snapshot

  9.6.6.2 Product/Service Portfolio

  9.6.6.3 Key Company Financials

  9.6.6.4 SWOT Analysis

 9.6.7 Konecranes Plc

  9.6.7.1 Company Overview & Snapshot

  9.6.7.2 Product/Service Portfolio

  9.6.7.3 Key Company Financials

  9.6.7.4 SWOT Analysis

 9.6.8 Ralf Teichmann GmbH

  9.6.8.1 Company Overview & Snapshot

  9.6.8.2 Product/Service Portfolio

  9.6.8.3 Key Company Financials

  9.6.8.4 SWOT Analysis

 9.6.9 Sumitomo Heavy Industries Material Handling Systems Co., Ltd.

  9.6.9.1 Company Overview & Snapshot

  9.6.9.2 Product/Service Portfolio

  9.6.9.3 Key Company Financials

  9.6.9.4 SWOT Analysis

 9.6.10 Weihua Group

  9.6.10.1 Company Overview & Snapshot

  9.6.10.2 Product/Service Portfolio

  9.6.10.3 Key Company Financials

  9.6.10.4 SWOT Analysis

 9.6.11 Terex Corporation

  9.6.11.1 Company Overview & Snapshot

  9.6.11.2 Product/Service Portfolio

  9.6.11.3 Key Company Financials

  9.6.11.4 SWOT Analysis

 9.6.12 Liebherr Group

  9.6.12.1 Company Overview & Snapshot

  9.6.12.2 Product/Service Portfolio

  9.6.12.3 Key Company Financials

  9.6.12.4 SWOT Analysis

 9.6.13 Jaso Industrial Cranes

  9.6.13.1 Company Overview & Snapshot

  9.6.13.2 Product/Service Portfolio

  9.6.13.3 Key Company Financials

  9.6.13.4 SWOT Analysis

 9.6.14 Sany Group

  9.6.14.1 Company Overview & Snapshot

  9.6.14.2 Product/Service Portfolio

  9.6.14.3 Key Company Financials

  9.6.14.4 SWOT Analysis

 9.6.15 Cargotec Corporation

  9.6.15.1 Company Overview & Snapshot

  9.6.15.2 Product/Service Portfolio

  9.6.15.3 Key Company Financials

  9.6.15.4 SWOT Analysis

 9.6.16 Dongqi Crane

  9.6.16.1 Company Overview & Snapshot

  9.6.16.2 Product/Service Portfolio

  9.6.16.3 Key Company Financials

  9.6.16.4 SWOT Analysis

 9.6.17 DHS Crane

  9.6.17.1 Company Overview & Snapshot

  9.6.17.2 Product/Service Portfolio

  9.6.17.3 Key Company Financials

  9.6.17.4 SWOT Analysis

 9.6.18 ZPMC (Shanghai Zhenhua Heavy Industries Co.)

  9.6.18.1 Company Overview & Snapshot

  9.6.18.2 Product/Service Portfolio

  9.6.18.3 Key Company Financials

  9.6.18.4 SWOT Analysis

    9.6.19 Demag Cranes & Components

  9.6.19.1 Company Overview & Snapshot

  9.6.19.2 Product/Service Portfolio

  9.6.19.3 Key Company Financials

  9.6.19.4 SWOT Analysis

    9.6.20 Faymonville

  9.6.20.1 Company Overview & Snapshot

  9.6.20.2 Product/Service Portfolio

  9.6.20.3 Key Company Financials

  9.6.20.4 SWOT Analysis

10. Analyst Recommendations

 10.1 SNS Insider Opportunity Map

 10.2 Industry Low-Hanging Fruit Assessment

 10.3 Market Entry & Growth Strategy

 10.4 Analyst Viewpoint & Suggestions On Market Growth

11. Assumptions

12. Disclaimer

13. Appendix

 13.1 List Of Tables

 13.2 List Of Figures

Key Segmentation

By Type

  • Gantry Cranes

  • Jib Cranes

  • Bridge Cranes

  • Others

By Lifting Capacity

  • Up to 5 Ton

  • 6-10 Ton

  • 11-50 Ton

  • More Than 50 Ton

By End Use Industry

  • Manufacturing

  • Automotive and Transportation

  • Construction

  • Metal and Mining

  • Power and Utilities

  • Ports and Shipyards

  • Others

Request for Segment Customization as per your Business Requirement: Segment Customization Request

Regional Coverage

North America

  • US

  • Canada

Europe

  • Germany

  • UK

  • France

  • Italy

  • Spain

  • Russia

  • Poland

  • Rest of Europe

Asia Pacific

  • China

  • India

  • Japan

  • South Korea

  • ASEAN Countries

  • Australia

  • Rest of Asia Pacific

Latin America

  • Brazil

  • Argentina

  • Mexico

  • Colombia

  • Rest of Latin America

Middle East & Africa

  • UAE

  • Saudi Arabia

  • Qatar

  • Egypt

  • South Africa

  • Rest of Middle East & Africa

Request for Country Level Research Report: Country Level Customization Request

Available Customization

With the given market data, SNS Insider offers customization as per the company’s specific needs. The following customization options are available for the report:

  • Detailed Volume Analysis

  • Criss-Cross segment analysis (e.g. Product X Application)

  • Competitive Product Benchmarking

  • Geographic Analysis

  • Additional countries in any of the regions

  • Customized Data Representation

  • Detailed analysis and profiling of additional market players

An accurate research report requires proper strategizing as well as implementation. There are multiple factors involved in the completion of good and accurate research report and selecting the best methodology to compete the research is the toughest part. Since the research reports we provide play a crucial role in any company’s decision-making process, therefore we at SNS Insider always believe that we should choose the best method which gives us results closer to reality. This allows us to reach at a stage wherein we can provide our clients best and accurate investment to output ratio.

Each report that we prepare takes a timeframe of 350-400 business hours for production. Starting from the selection of titles through a couple of in-depth brain storming session to the final QC process before uploading our titles on our website we dedicate around 350 working hours. The titles are selected based on their current market cap and the foreseen CAGR and growth.


The 5 steps process:

Step 1: Secondary Research:

Secondary Research or Desk Research is as the name suggests is a research process wherein, we collect data through the readily available information. In this process we use various paid and unpaid databases which our team has access to and gather data through the same. This includes examining of listed companies’ annual reports, Journals, SEC filling etc. Apart from this our team has access to various associations across the globe across different industries. Lastly, we have exchange relationships with various university as well as individual libraries.

Secondary Research

Step 2: Primary Research

When we talk about primary research, it is a type of study in which the researchers collect relevant data samples directly, rather than relying on previously collected data.  This type of research is focused on gaining content specific facts that can be sued to solve specific problems. Since the collected data is fresh and first hand therefore it makes the study more accurate and genuine.

We at SNS Insider have divided Primary Research into 2 parts.

Part 1 wherein we interview the KOLs of major players as well as the upcoming ones across various geographic regions. This allows us to have their view over the market scenario and acts as an important tool to come closer to the accurate market numbers. As many as 45 paid and unpaid primary interviews are taken from both the demand and supply side of the industry to make sure we land at an accurate judgement and analysis of the market.

This step involves the triangulation of data wherein our team analyses the interview transcripts, online survey responses and observation of on filed participants. The below mentioned chart should give a better understanding of the part 1 of the primary interview.

Primary Research

Part 2: In this part of primary research the data collected via secondary research and the part 1 of the primary research is validated with the interviews from individual consultants and subject matter experts.

Consultants are those set of people who have at least 12 years of experience and expertise within the industry whereas Subject Matter Experts are those with at least 15 years of experience behind their back within the same space. The data with the help of two main processes i.e., FGDs (Focused Group Discussions) and IDs (Individual Discussions). This gives us a 3rd party nonbiased primary view of the market scenario making it a more dependable one while collation of the data pointers.

Step 3: Data Bank Validation

Once all the information is collected via primary and secondary sources, we run that information for data validation. At our intelligence centre our research heads track a lot of information related to the market which includes the quarterly reports, the daily stock prices, and other relevant information. Our data bank server gets updated every fortnight and that is how the information which we collected using our primary and secondary information is revalidated in real time.

Data Bank Validation

Step 4: QA/QC Process

After all the data collection and validation our team does a final level of quality check and quality assurance to get rid of any unwanted or undesired mistakes. This might include but not limited to getting rid of the any typos, duplication of numbers or missing of any important information. The people involved in this process include technical content writers, research heads and graphics people. Once this process is completed the title gets uploader on our platform for our clients to read it.

Step 5: Final QC/QA Process:

This is the last process and comes when the client has ordered the study. In this process a final QA/QC is done before the study is emailed to the client. Since we believe in giving our clients a good experience of our research studies, therefore, to make sure that we do not lack at our end in any way humanly possible we do a final round of quality check and then dispatch the study to the client.