Environmental Test Chamber Market Size Analysis:
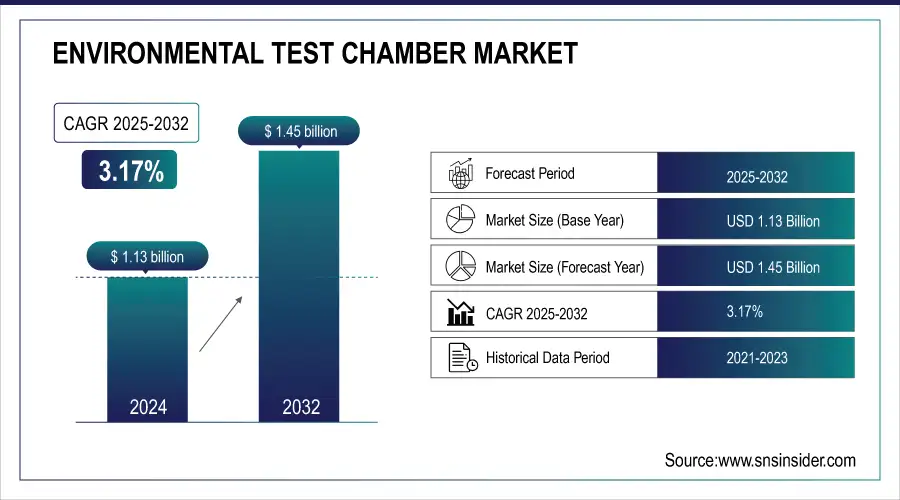
The Environmental Test Chamber Market size was valued at USD 1.16 Billion in 2025 and is projected to grow at 3.17% CAGR to reach USD 1.49 Billion by 2033.
The Environmental Test Chamber Market is witnessing strong growth, driven by rising demand across industries such as automotive, electronics, pharmaceuticals, and packaging for reliable product testing under extreme climatic conditions. These chambers are essential in simulating temperature, humidity, and other environmental factors to assess product durability, safety, and regulatory compliance before market launch. Advancements in sensor accuracy, energy efficiency, automation, and PLC-based touchscreen controls are enhancing performance and user experience. Growing emphasis on quality assurance, international safety standards, and reduced product failures are fueling adoption globally. Additionally, rapid industrialization in emerging economies and increasing R&D activities are creating new opportunities. The market is also being supported by innovations like fast heating/cooling cycles and modular designs for flexible testing applications.
Presto Stantest launched a new Environmental Test Chamber with 99.2% accuracy, supporting extreme climate testing for industries like automotive, electronics, and packaging.
To Get more information on Environmental Test Chamber Market - Request Free Sample Report
Market Size and Forecast: 2025E
-
Market Size in 2025 USD 1.16 Billion
-
Market Size by 2033 USD 1.49 Billion
-
CAGR of 3.17% From 2026 to 2033
-
Base Year 2025
-
Forecast Period 2026-2033
-
Historical Data 2021-2024
Environmental Test Chamber Market Trends:
-
Rising adoption of high-precision, programmable environmental test chambers to meet stricter regulatory and international compliance standards.
-
Increasing focus on product reliability and durability testing across automotive, electronics, aerospace, and pharmaceutical industries.
-
Growth in R&D investments and accelerated product development cycles driving demand for advanced testing solutions.
-
Expanding use of non-invasive LIDAR and laser survey technologies for environmental monitoring and archaeological applications.
-
Greater emphasis on sustainable development, climate resilience, and heritage conservation supporting advanced environmental testing and analysis tools
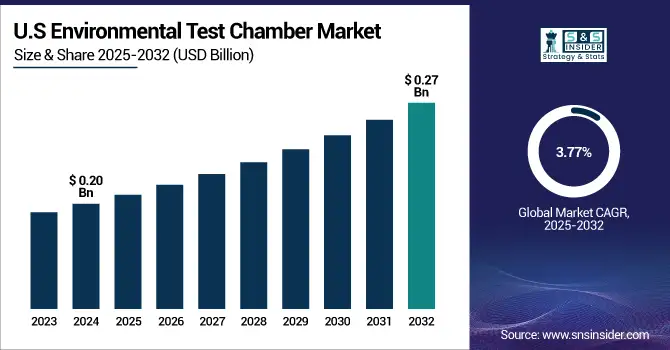
The U.S Environmental Test Chamber Market size was valued at USD 0.20 Billion in 2025 and is projected to reach USD 0.27 Billion by 2033, growing at a CAGR of 3.77% during 2026-2033. This growth is driven by increasing demand from industries such as aerospace, automotive, electronics, and defense, which rely on precise simulation environments to test product reliability and safety. Additionally, technological advancements, growing emphasis on product quality, and stringent regulatory standards are further supporting the market’s steady expansion across the country.
Environmental Test Chamber Market Growth Drivers:
-
Growing Regulatory Compliance and Product Reliability Needs Drive Environmental Test Chamber Market Expansion
The increasing emphasis on product reliability, quality assurance, and regulatory compliance across industries is a major driver for the Environmental Test Chamber market. As manufacturers face stricter standards for safety, performance, and durability especially in sectors like automotive, electronics, aerospace, and pharmaceuticals the demand for advanced testing solutions is rising. Environmental chambers allow simulation of extreme conditions such as temperature, humidity, and vibration to ensure products perform reliably in real-world environments. Additionally, rising R&D investments, globalization of manufacturing, and the push for faster product development cycles further boost market growth. These factors collectively fuel the adoption of high-precision, programmable environmental chambers to meet evolving industrial and international compliance requirements.
In CAAF24, climate experts warned that Africa's climate crises are increasing and require immediate attention in green innovation and investment. The Summit resulted in announcement of new initiatives including the Billion Trees for Africa as well as the establishment of a USD 20M Pan African Climate Action Fund to accelerate sustainable development efforts.
Environmental Test Chamber Market Restraints:
-
High Capital Investment and Maintenance Costs Restrict Environmental Test Chamber Market Growth
The Environmental Test Chamber Market faces key restraints primarily due to the high capital investment required for advanced testing equipment. These chambers involve sophisticated technology for precise control over environmental parameters, making them expensive to procure and install, especially for small and medium-sized enterprises. Additionally, ongoing operational and maintenance costs, including calibration, sensor replacements, and energy consumption, further burden end-users. The need for skilled personnel to operate complex systems and interpret test results adds to the overall cost of ownership. These financial and technical barriers can deter adoption, particularly in price-sensitive markets or regions with limited technological infrastructure, thereby hindering widespread market penetration despite growing demand for reliability testing.
Environmental Test Chamber Market Opportunities:
-
Increasing Adoption of Advanced LIDAR Technology Drives Market Expansion Through Dual Environmental and Archaeological Applications
The growing application of advanced LIDAR and laser survey technologies presents significant opportunities in the environmental and archaeological testing markets. As non-invasive methods gain traction for mapping dense and sensitive environments, these technologies enable precise data collection without disrupting natural or cultural sites. This dual-use potential combining environmental monitoring with archaeological exploration can reduce costs and resource requirements for research institutions and governments. Additionally, increasing interest in heritage conservation and sustainable environmental management drives demand for sophisticated surveying solutions. With technological advancements lowering barriers to entry, expanding LIDAR adoption across sectors promises to boost market growth by offering innovative, efficient tools for accurate environmental analysis and cultural preservation.
LIDAR surveys of a thickly wooded area in Campeche, Mexico, have uncovered an enormous ancient Maya city complete with plazas, pyramids and ball courts. The finding shows the importance of using environmental laser surveys as simultaneously economical archaeological tools.
Environmental Test Chamber Market Segment Analysis:
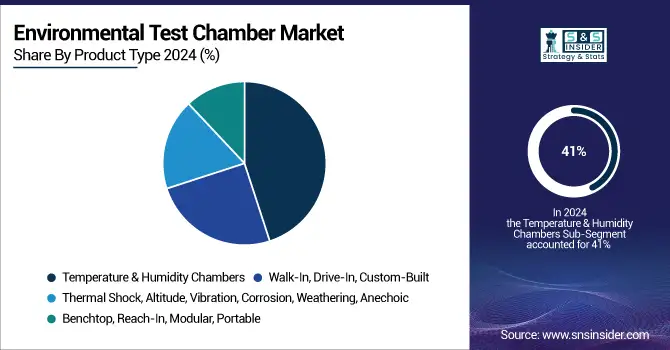
By Product Type
In 2025, the Temperature & Humidity Chambers segment accounted for approximately 41% of the Environmental Test Chamber share, on account of booming demand out of automotive, electronics as well as the aerospace sector, The precise capabilities of climate simulation and experienced professionals conforming to stringent quality standards serve as the key factors for growth. Increased regulatory requirements and continual technology advances are predicted to continued stimulate adoption of the market in the forecast period. The Walk-In, Drive-In, Custom-Built segment is expected to experience the fastest growth in Environmental Test Chamber over 2026-2033 with a CAGR of 4.58%, owing to growing demand of large scale and customized testing solutions in automotive, aerospace and defence industries. Factors such as improved flexibility and increased capacity for handling larger specimens are driving the segment growth.
By Parameter
In 2025, the Temperature segment accounted for approximately 33% of the Environmental Test Chamber share, owing to rising demand for simulating different thermal conditions for the product it is a significant factor that provides value to Temperature segment in the market. Growing demand from automotive, electronics, and aerospace industries where accurate temperature control is required to meet durability and reliability requirements are some of the factors driving growth of this segment. The rise in regulatory standards and increasing requirement for effective quality assurance also drives the growth of the temperature test chamber market globally. The Corrosion segment is expected to experience the fastest growth in Environmental Test Chamber over 2026-2033 with a CAGR of 4.20%, This growth is fueled by increasing demand for corrosion testing in industries such as automotive, aerospace, and construction to ensure product longevity and safety. Stringent quality standards and rising awareness about material durability are driving investments in advanced corrosion testing chambers worldwide.
By Application
In 2025, the Automotive, Aerospace & Defense segment accounted for approximately 34% of the Environmental Test Chamber share, This growth is fueled by the increasing demand for reliable testing of components under extreme conditions, stringent regulatory standards, and rising investments in advanced testing technologies to enhance product safety and durability across these industries. The Electronics & Semiconductors segment is expected to experience the fastest growth in Environmental Test Chamber over 2026-2033 with a CAGR of 4.01%, This growth is driven by the increasing demand for rigorous testing of electronic components to ensure reliability, performance, and durability in diverse environmental conditions, along with rapid advancements in semiconductor technology and growing consumer electronics markets worldwide.
By End User
In 2025, the OEMs segment held about 36% of the Environmental Test Chamber Market share. This significant share is attributed to OEMs’ continuous investments in advanced testing equipment to ensure product quality and compliance. Growing demand for customized and high-precision environmental chambers by OEMs across industries such as automotive, aerospace, and electronics is fueling market expansion. The Labs segment is expected to experience the fastest growth in Environmental Test Chamber over 2026-2033 with a CAGR of 3.86%, This growth is driven by increasing demand for advanced testing facilities in research and development sectors, pharmaceuticals, and quality assurance labs. Enhanced focus on product reliability and regulatory compliance is boosting the adoption of Environmental Test Chamber in lab environments globally.
Environmental Test Chamber Market Regional Analysis:
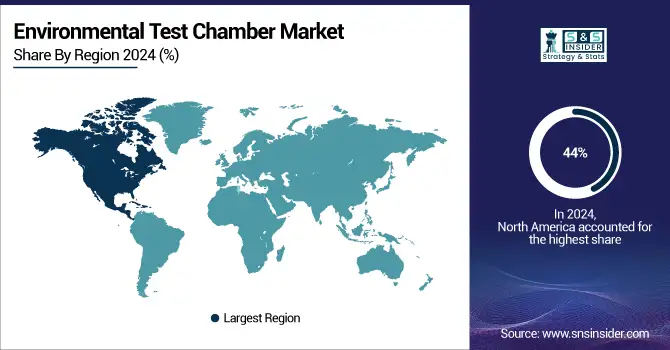
Asia Pacific Environmental Test Chamber Market Insights
In 2025, Asia-Pacific dominated the Environmental Test Chamber market and accounted for 44% of revenue share, due to swift industrialization, rising electronics and automotive manufacturing coupled with increasing R&D expenditures in China, Japan, and India (more than $100 million). Additionally, the growing need for quality testing and compliance with regulations also favors the market growth in Asia-Pacific, and hence environmental test chamber is prevailing in Asia-Pacific.
Get Customized Report as per Your Business Requirement - Enquiry Now
North America Environmental Test Chamber Market Insights
North America is expected to witness the fastest growth in the Environmental Test Chamber market over 2026-2033, with a projected CAGR of 4.78%. The rapid growth is driven by growing investments across advanced manufacturing and stringent regulatory standards coupled with their high requirement for truck, airplane, and electronics testing. Moreover, this market rapidly expands in the region due to technological developments and rising focus on quality and safety of the products
Europe Environmental Test Chamber Market Insights
In 2025, Europe emerged as a promising region in the Environmental Test Chamber market, due to high rate of implementation of market oriented testing technologies and stringent adherence to regulatory bodies. The regional emphasis on innovation, sustainability, and quality assurance in automotive, aerospace, and electronics sectors is driving the demand. On the other hand, increasing investment in research and development, as well as government initiatives, is boosting the growth of the European market.
Latin America (LATAM) and Middle East & Africa (MEA) Environmental Test Chamber Market Insights
LATAM and MEA are experiencing steady growth in the Environmental Test Chamber market, driven by expanding industrial sectors and increasing demand for reliable product testing. Rising investments in manufacturing infrastructure and growing awareness of quality standards are boosting market adoption. Additionally, government initiatives to support industrial development and environmental compliance contribute to the sustained market growth in these regions.
Environmental Test Chamber Market Key Players:
The Key Players in Environmental Test Chamber Market are
- KOMEG Technology
- ACMAS Technologies
- Weiss Technik
- Russells Technical Products
- Thermotron Industries
- TA Instruments
- Memmert GmbH
- BINDER GmbH
- Envisys Technologies
- ESPEC CORP
- Angelantoni Test Technologies
- Climatic Testing Systems
- CTS
- Hastest Solutions
- CM Envirosystems
- Corrosion Chambers
- Panasonic Corporation
- Thermo Fisher Scientific
- Shanghai Yiheng Scientific Instruments Co., Ltd.
- Labontech Co., Ltd.
Competitive Landscape for Environmental Test Chamber Market:
Panasonic Corporation is a global Japanese electronics and technology company that supports environmental test chamber applications through advanced testing facilities, including anechoic and climatic chambers, to ensure reliability and compliance of products across multiple industries, bolstered by its broad expertise in environmental controls and quality validation.
-
In July 2025, Panasonic verified that active chlorine from its hypochlorous acid solution suppresses over 99% of respiratory syncytial viruses in enclosed spaces within 8 hours. This technology builds on 40 years of research in sterilization and deodorization using electrolyzed salt water solutions.
KOMEG Technology is a China-based manufacturer of environmental test chambers, founded in 1990, specializing in climatic, thermal shock, walk-in, and humidity test chambers for reliability and durability testing across electronics, automotive, aerospace, and energy sectors; ISO-certified with global exports and continuous innovation in chamber design.
-
In October 2025, KOMEG published insights highlighting the role of its environmental reliability test chambers including high and low temperature humidity chambers—in enhancing robot performance and operational reliability under extreme environmental conditions.
| Report Attributes | Details |
|---|---|
| Market Size in 2025E | USD 1.16 Billion |
| Market Size by 2033 | USD 1.49 Billion |
| CAGR | CAGR of 3.17% From 2026 to 2033 |
| Base Year | 2025E |
| Forecast Period | 2026-2033 |
| Historical Data | 2021-2024 |
| Report Scope & Coverage | Market Size, Segments Analysis, Competitive Landscape, Regional Analysis, DROC & SWOT Analysis, Forecast Outlook |
| Key Segments | • By Product Type(Temperature & Humidity Chambers, Thermal Shock, Altitude, Vibration, Corrosion, Weathering, Anechoic, Walk-In, Drive-In, Custom-Built and Benchtop, Reach-In, Modular, Portable) • By Parameter (Temperature, Humidity, Shock, Altitude, Vibration, UV, Corrosion and Combined) • By Application(Automotive, Aerospace & Defense, Electronics & Semiconductors, Pharma & Life Sciences, Industrial, Telecom, Energy and Research, Academia, F&B, Others) • By End User (OEMs, Labs, Certification Bodies, R&D and QC) |
| Regional Analysis/Coverage | North America (US, Canada), Europe (Germany, UK, France, Italy, Spain, Russia, Poland, Rest of Europe), Asia Pacific (China, India, Japan, South Korea, Australia, ASEAN Countries, Rest of Asia Pacific), Middle East & Africa (UAE, Saudi Arabia, Qatar, South Africa, Rest of Middle East & Africa), Latin America (Brazil, Argentina, Mexico, Colombia, Rest of Latin America). |
| Company Profiles | The Environmental Test Chamber market companies KOMEG Technology, ACMAS Technologies, Weiss Technik, Russells Technical Products, Thermotron Industries, TA Instruments, Memmert GmbH, BINDER GmbH, Envisys Technologies, ESPEC CORP, Angelantoni Test Technologies, Climatic Testing Systems, CTS, Hastest Solutions, CM Envirosystems, Corrosion Chambers., Panasonic Corporation, Thermo Fisher Scientific, Shanghai Yiheng Scientific Instruments Co., Ltd., Labontech Co., Ltd. and Others. |
Frequently Asked Questions
Asia-Pacific dominated the Environmental Test Chamber Market in 2025.
The “Temperature & Humidity Chambers” segment dominated the Environmental Test Chamber Market
Increasing demand for reliable product testing under diverse environmental conditions is a key driver of the Environmental Test Chamber market.
The Environmental Test Chamber Market size was valued at USD 1.16 Billion in 2025 and is projected to reach USD 1.49 Billion by 2033
The Environmental Test Chamber Market is expected to grow at a CAGR of 3.17% during 2026-2033.
Get in Touch
