Flavor Enhancer Market Report Scope & Overview:
Get More Information on Flavor Enhancer Market - Request Sample Report
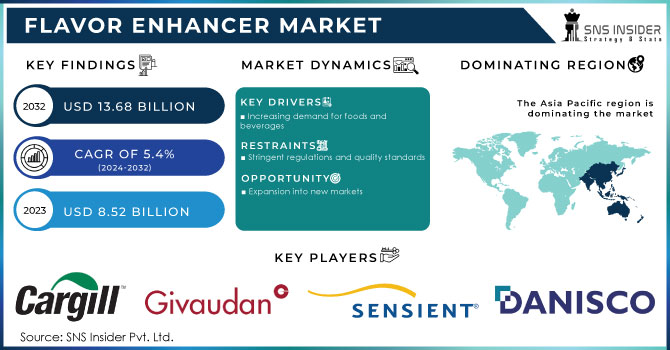
The Flavor Enhancer Market size was USD 8.52 billion in 2023, is expected to Reach USD 13.68 billion by 2032, and grow at a CAGR of 5.4% over the forecast period of 2024-2032.
Flavor enhancers are substances that are added to food to enhance the taste of food. They do not have a taste of their own, but they are added by enhancing the existing flavors of food. Flavor enhancers are also used to make processed meats tastier and more appealing.
Based on Type, the Flavor enhancers are categorized into Acidulants, Glutamates, Yeast Extracts, Hydrolyzed Vegetable Proteins, and Others. The glutamates segment has a major share of 40% in 2022. Glutamates are amino acids found in a variety of meals, including meat, seafood, vegetables, and dairy products. They have a savory taste known as umami. Acidulants are the second most segment accounting for a share of 25%. Acidulants are food additives that are used to give food a sour or acidic flavor. They are also used to preserve food and to improve its flavor.
MARKET DYNAMICS
KEY DRIVERS
-
Increasing demand for foods and beverages
Flavor enhancers can be natural or synthetic additive materials. Some common natural flavor enhancers include salt, MSG, yeast extract, and hydrolyzed vegetable protein. Flavor enhancers are used to improve the taste and palatability of foods and beverages that have been processed and packaged. In processed meats such as hot dogs and sausages, yeast extract and hydrolyzed vegetable protein are widely employed. This is fueling demand for taste enhancers, which make these products more enticing to customers.
RESTRAIN
-
Stringent regulations and quality standards
The Codex Alimentarius Commission General Standard Food Additives establishes international guidelines for food additives. These criteria are used by regulatory agencies all across the world. specified criteria must be completed by manufacturers for their flavor enhancers to be of a specified standard. Stability, potency, and purity requirements may be added. Furthermore, producers must accurately and completely label their flavor enhancers.
OPPORTUNITY
-
Expansion into new markets
The need for flavor enhancers is rising in emerging nations since processed foods and beverages frequently contain a lot of flavor enhancers. Applications for flavor enhancers include processed convenience meals, meat and fish products, beverages, and many more. The demand for processed foods and beverages is rising in China, where the food industry is expanding quickly. The market for flavor enhancers is expanding into emerging markets, which is fueling this expansion. This expansion is brought by increased urbanization, rising disposable incomes, and shifting consumer preferences, as well as rising demand for processed foods and beverages.
CHALLENGES
-
Negative consumer perception
consumers who have a negative perception of flavor enhancers are less likely to purchase foods and beverages that contain flavor enhancers. Flavor enhancers can be complex chemicals, and some consumers may be concerned about the potential health risks associated with these chemicals. flavor enhancers have been linked to allergic reactions in some people.
IMPACT OF RUSSIA-UKRAINE WAR
Russia and Ukraine are major exporters of raw materials used in flavor enhancer manufacture, including cornstarch, yeast extract, and hydrolyzed vegetable proteins. The war has interrupted the availability of these raw materials, which is expected to result in higher pricing and flavor enhancer shortages. Flavor enhancer prices are predicted to rise by 5% in 2023. Flavor enhancer shortages are projected in various markets, including Europe and North America. The war's impact on the Asia Pacific flavor enhancers market is likely to be minimal. In Asia Pacific, flavor enhancer prices are predicted to rise by 6% in 2023.
IMPACT OF ONGOING RECESSION
The recession has impacted the flavor enhancer market. The global flavor enhancers market is predicted to grow at a slower rate in 2023 than it would have without the war. Food inflation is increase by 9% in 2022. Furthermore, the recession has reduced the supply and manufacture of enhancers. During a recession, food manufacturers may employ more flavor enhancers in their products to cut costs. In Europe, flavor enhancer prices are predicted to rise by 15% in 2023, with shortages conceivable.
MARKET SEGMENTATION
by Type
-
Acidulants
-
Glutamates
-
Yeast Extracts
-
Hydrolyzed Vegetable Proteins
-
Others
by Application
-
Processed Convenience Foods
-
Meat and Fish Products
-
Beverages
-
Others
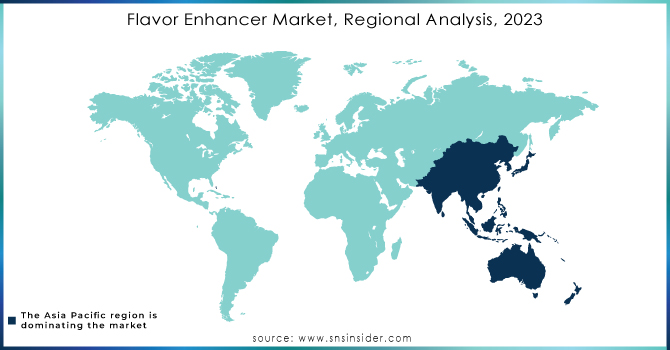
REGIONAL ANALYSIS
Asia Pacific is the fastest-growing market with a CAGR of 5.3% in 2022. The regional market is majorly driven by increasing demand for flavored milk and yogurt, which has been witnessing an increase in consumption across countries like Japan, China, Singapore, Thailand, and others that frequently use flavor enhancers in a variety of food preparations since they are low in salt and have other health advantages that are well-liked by the region's customers. China is the country with the highest MSG usage in noodles.
North America is the largest market for flavor enhancers market in 2022. The demand in the United States for flavor enhancers is estimated to grow at a CAGR of 4.8%. The increasing demand for processed foods and beverages, such as instant noodles, soups, sauces, and snacks, is driving the expansion of the flavor enhancers market. Flavor enhancers offer food manufacturers a convenient way to adjust shifting tastes and adapt to a wide range of taste preferences.
Europe has a significant market for flavor enhancers market in 2022. The increased demand for convenience foods and beverages, such as ready meals, soups, and sauces, is driving the expansion of the European flavor enhancers market. Ajinomoto Group, DuPont, Frutarom, and Symrise are among the major key players in the European flavor enhancers market.
Need any customization research on Flavor Enhancer Market- Enquiry Now
REGIONAL COVERAGE
North America
-
US
-
Canada
-
Mexico
Europe
-
Eastern Europe
-
Poland
-
Romania
-
Hungary
-
Turkey
-
Rest of Eastern Europe
-
-
Western Europe
-
Germany
-
France
-
UK
-
Italy
-
Spain
-
Netherlands
-
Switzerland
-
Austria
-
Rest of Western Europe
-
Asia Pacific
-
China
-
India
-
Japan
-
South Korea
-
Vietnam
-
Singapore
-
Australia
-
Rest of Asia Pacific
Middle East & Africa
-
Middle East
-
UAE
-
Egypt
-
Saudi Arabia
-
Qatar
-
Rest of Middle East
-
-
Africa
-
Nigeria
-
South Africa
-
Rest of Africa
-
Latin America
-
Brazil
-
Argentina
-
Colombia
-
Rest of Latin America
KEY PLAYERS
Some major key players in the Torpedo Market are Cargill Inc., Givaudan, Tate & Lyle PLC, Sensient Technologies, Mane SA, Associated British Foods Plc., Danisco A/S, Corbion N.V., International Flavors & Fragrances Inc. (IFF), Takasago International Corporation, Firmenich SA, Quest Nutrition LLC, and other key players.
RECENT DEVELOPMENTS
In 2023, International Flavors & Fragrances Inc. introduced ChoozIt Vintage to the American and Canadian markets. ChoozIt Vintage may be able to assist cheddar cheese producers in overcoming undesired flavor development during aging by giving highly consistent pH along with texture results through the ripening process.
In 2022, Givaudan launched NaNino+, a natural flavoring component that can be used to replace nitrites in processed meat. The product was initially introduced in Europe for emulsified cooked sausages, but its capabilities were later expanded to include cooked ham and bacon.
In 2022, International Trade Solutions introduced Vegan Boosts, a brand of natural flavor enhancers in powdered form. Additionally, businesses use flavor enhancers to boost the sensory appeal of bakery goods.
| Report Attributes | Details |
| Market Size in 2023 | USD 8.52 Billion |
| Market Size by 2032 | USD 13.68 Billion |
| CAGR | CAGR of 5.4 % From 2024 to 2032 |
| Base Year | 2023 |
| Forecast Period | 2024-2032 |
| Historical Data | 2020-2022 |
| Report Scope & Coverage | Market Size, Segments Analysis, Competitive Landscape, Regional Analysis, DROC & SWOT Analysis, Forecast Outlook |
| Key Segments | • By Type (Acidulants, Glutamates, Yeast Extracts, Hydrolyzed Vegetable Proteins, Others) • By Application (Processed Convenience Foods, Meat and Fish Products, Beverages, Others) |
| Regional Analysis/Coverage | North America (US, Canada, Mexico), Europe (Eastern Europe [Poland, Romania, Hungary, Turkey, Rest of Eastern Europe] Western Europe] Germany, France, UK, Italy, Spain, Netherlands, Switzerland, Austria, Rest of Western Europe]), Asia Pacific (China, India, Japan, South Korea, Vietnam, Singapore, Australia, Rest of Asia Pacific), Middle East & Africa (Middle East [UAE, Egypt, Saudi Arabia, Qatar, Rest of Middle East], Africa [Nigeria, South Africa, Rest of Africa], Latin America (Brazil, Argentina, Colombia Rest of Latin America) |
| Company Profiles | Cargill Inc., Givaudan, Tate & Lyle PLC, Sensient Technologies, Mane SA, Associated British Foods Plc., Danisco A/S, Corbion N.V., International Flavors & Fragrances Inc. (IFF), Takasago International Corporation, Firmenich SA, Quest Nutrition LLC |
| Key Drivers | • Increasing demand for foods and beverages |
| Market Restrain | • Stringent regulations and quality standards |
Frequently Asked Questions
Ans: Asia Pacific is the fastest-growing Flavor Enhancer Market.
Ans: USD 13.68 billion is expected to grow by 2032.
Ans: Increased demand for food and beverage are the drivers of the Flavor Enhancer Market.
Ans: Flavor Enhancer Market is anticipated to expand by 5.4% from 2024 to 2032.
Ans: Stringent regulations and quality standards are the restraints of the Flavor Enhancer Market.
Get in Touch
