Gene Therapy Starting Materials Market Report Scope & Overview:

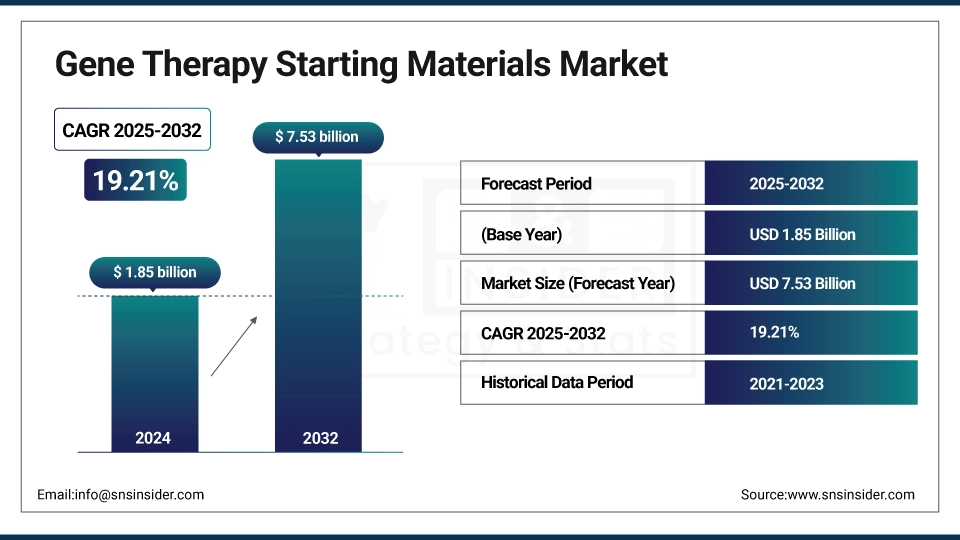
The gene therapy starting materials market was valued at USD 1.85 billion in 2024 and is expected to reach USD 7.53 billion by 2032, growing at a CAGR of 19.21% over the forecast period of 2025-2032. 

An increase in demand for high-quality and uniform raw materials, including plasmids and viral vectors, is one of the major factors contributing to the global market for gene therapy starting materials market growth. These materials are essential to product quality, scale, and regulatory alignment. One of the major gene therapies starting materials market trends includes the transition to clinically viable GMP-grade, scalable, and affordable supply chains that help clinical dependability and mitigate manufacturing implementation risks, which fuel growth and innovation in the sector for the long term globally.

For instance, in February 2025, Aldevron reported a 28% year-over-year growth in plasmid DNA services, driven by rising global demand for high-quality gene therapy starting materials.

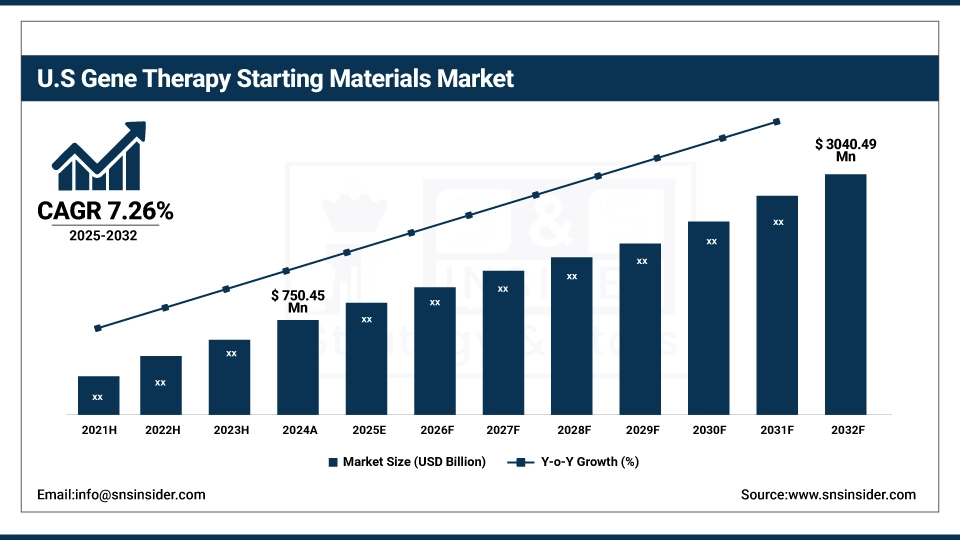
The U.S. gene therapy starting materials market was valued at USD 750.45 million in 2024 and is expected to reach USD 3040.49 million by 2032, growing at a CAGR of 19.13% over 2025-2032.  

The U.S. is a leader in the gene therapy starting materials market due to its leadership in innovation, robust biotech industry, high R&D spending, and government support initiatives. Favorable investment trends, sophisticated GMP manufacturing, and academic-industry partnerships underpin scale and quality. This extensive value chain is the foundation for the U.S. leadership, as evidenced in recent gene therapy starting material market analysis reports.

For instance, in May 2025, the U.S. government allocated USD 3.5 billion under the National Biotechnology Initiative to boost domestic manufacturing of gene therapy starting materials and reduce foreign dependency.

Market Dynamics:

Drivers:

  • COVID-19 Pandemic is Driving the Gene Therapy Starting Materials Market Growth

The COVID-19 pandemic derailed supply, and then it actually enhanced the gene therapy starting materials market by increasing innovation, automation, and regulatory permissions. Businesses emphasized the need to secure supplies of raw materials and diversify their sources. The result was improved efficiency of production and investment that fueled only long-term growth. These changes had a big impact on the gene therapy starting materials market share, increasing its global reach and strategic relevance.

For instance, in February 2025, ARM reported a 40% increase in global CGT manufacturing capacity since 2020, driven by pandemic-era demand for plasmids and viral vectors in gene therapy.

Restraints:

  • Workforce Shortages and Complex Regulatory Standards are a Significant Restraint on the Gene Therapy Starting Materials Market Growth

Occupational shortages and convoluted regulations stifle the advancement of the gene therapy starting materials market growth as they lead to delays in production, under-utilized capacity, and compliance obstacles. Manufacturing and quality control skill gaps hinder scalability, and diverse global regulations drive up cost and complexity. Together, these factors act as barriers to efficient supply chains, postponing patient access and restricting global adoption of gene therapy breakthroughs.

For instance, in January 2025, 58% of CGT companies reported skilled workforce shortages in GMP manufacturing and QC, leading to production delays and impacting the gene therapy starting materials market growth.

Segmentation Analysis:

By Product 

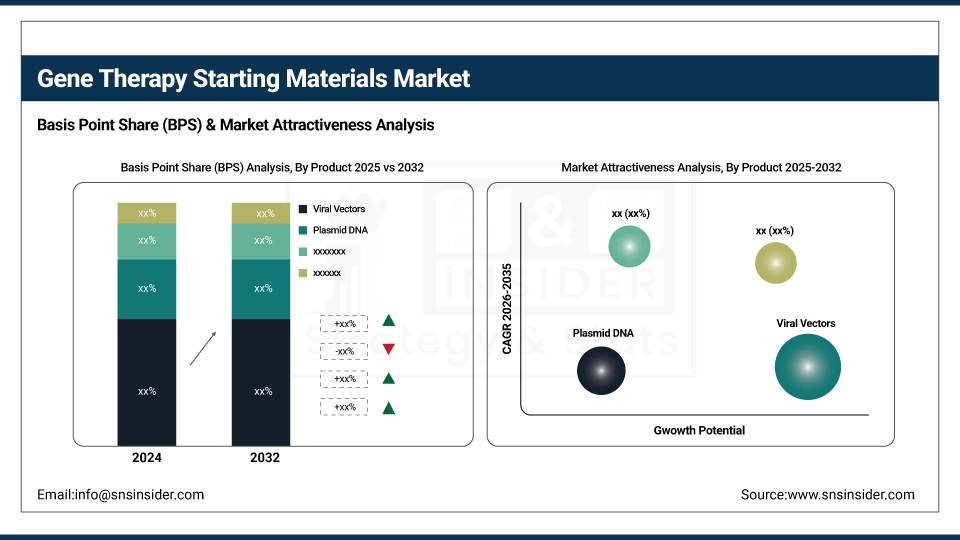
The viral vectors are the dominant segment in the gene therapy starting materials market, with a 43.94% share in 2024 as they are highly efficient gene transfer ability into the target cells. They provide predictable gene expression and are already being used in approved therapies, including Luxturna and Zolgensma. Robust clinical success, progression in vector engineering technology, and heightened need for AAV and lentiviral vectors are pivotal determinants of this expansion.

The plasmid DNA segment is emerging as the fastest growing with a CAGR of 19.82% in the gene therapy starting materials market, owing to its importance as a viral vector precursor. Demand is further bolstered by non-viral gene therapies and mRNA platforms. Rising number of approvals of advanced therapies, rising demand for GMP-grade plasmids, and growing investments in high-purity, scalable production technologies are some of the factors driving growth.

By Stage 

In 2024, clinical therapeutics dominated the gene therapy starting materials industry with a 46.76% market share, fueled by growing approvals of gene therapies for rare and genetic diseases. Clinical trial growth, heavy biopharma investment, and regulatory assignments foster demand. The requirement for GMP-compatible starting materials guarantees the availability of a high-quality supply for late-phase trials and commercial therapeutic purposes.

The pre-clinical therapeutics segment is the fastest growing segment of the gene therapy starting materials analysis, owing to the high R&D spending and expansion of the early-stage pipeline. Pre-clinical studies by biopharma and academia to investigate new gene targets are moving forward at an accelerated pace. There is a growing requirement for high-purity and scalable starting materials, including plasmid DNA and viral vectors, which is being driven by innovation grants, venture capital, and joint research programs.

By Application

Oncology held a dominant gene therapy starting materials market share of 38.40% in the gene therapy starting materials industry in 2024, as a result of the high global cancer burden and need for tailored and personalized therapies. Gene therapies, including CAR-T and oncolytic viruses also need specialized starting materials, including viral vectors and plasmid DNA. Growth in the FDA approvals and robust clinical trial pipelines, and investment into cancer gene therapies are some of the key factors driving the market leadership of this segment.

Genetic disease is emerging as the fastest growing segment in the gene therapy starting materials industry with the highest CAGR of 20.21%, owing to an increase in diagnoses, progress in genomics, and more approvals of gene-based treatments for rare inherited diseases. Increasing investment in R&D, patient advocacy, and regulatory incentives, including orphan drug designations, is speeding the development of personalized therapies and, in turn, raising the requirement for high-quality starting materials, including plasmid DNA and viral vectors.

By End-User

Biopharmaceutical & Pharmaceutical Companies are the largest segment of end users for the gene therapy starting materials industry, supported by strong internal manufacturing, solid financial support, and regulatory know-how. Their ability to buy up biotech firms, optimize supply chains, and ramp up production globally is one of their competitive advantages. These companies are also spending significant amounts on GMP-capable facilities to maintain quality, consistency, and supply security across clinical and commercial operations.

The CROs & CMOs segment is witnessing the highest growth in the gene therapy starting materials market, as biopharma companies outsource more of their work seeking cost savings, scale, and regulatory backing. These companies provide expertise in production and viral vector and plasmid technology, allowing for accelerated time-to-market. Workforce shortages are also fueling their rapid growth within clinical and commercial pipelines.

Regional Analysis:

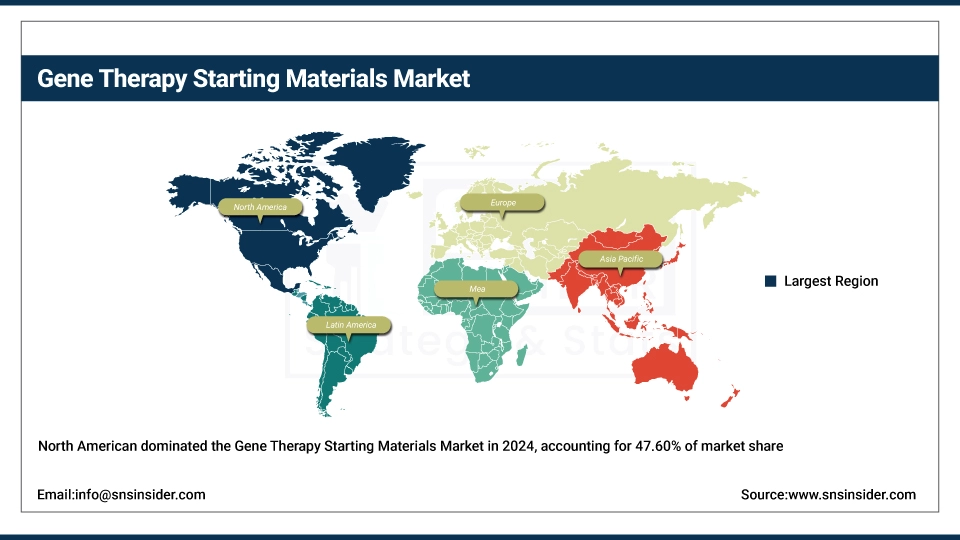
In 2024, the North American region holds the largest market share of the gene therapy starting materials market and dominates the market with a 47.60% market share, owing to its strong biotechnology environment, highly developed healthcare system, and investment in R&D. The existence of large biopharma players, leading research institutions and friendly regulation, including the FDA’s accelerated pathways, also exist in favor of gene therapy. Moreover, a surge in the demand for viral vectors, plasmid DNA, & other raw materials, and strategic partnerships and new clinical trials supplement the market growth. The U.S. is a leader with many hoods and FDA-approved therapies and CGTs manufacturing capacities.

Europe is becoming a significant market player for gene therapy starting materials due to favorable regulatory environments, including the EMA’s PRIME initiative and increasing investments in novel therapies. Led by countries including Germany, the U.K., and France, the Western Europe region is one of the key markets for melanoma drugs. The area is supported by public-private partnerships and the expansion of local CROs/CMOs focused on gene therapy materials and technologies, along with an increase in rare disease research funding.

Asia Pacific emerges as the fastest-growing region with the highest CAGR of 20.15%, driven by a surge in biotech investments, government support, and increasing prevalence of genetic disorders. Countries including China, Japan, South Korea, and India are expanding gene therapy research and manufacturing infrastructure. China, for instance, has accelerated clinical trial approvals and invested heavily in viral vector and plasmid DNA production. Japan’s regulatory reforms and regenerative medicine laws have encouraged fast-track development. Additionally, a large patient pool, rising awareness, and increasing partnerships between global biopharma companies and regional CROs/CMOs are fueling growth. Competitive manufacturing costs and the rise of local biotech startups are further accelerating demand for high-quality starting materials, making Asia Pacific a pivotal region for market expansion.

The Middle East & Africa is the least growing region in the gene therapy starting materials market due to weak R&D infrastructure, low healthcare expenditure, and lack of access to treatments. Moreover, regulatory challenges, shortage of trained professionals, and a smaller number of trials in the area make it difficult to adapt quickly, leading market penetration and investment lagging far behind those in other global regions.

The Latin American gene therapy starting materials industry is witnessing a steady rise in growth, as the healthcare infrastructure is developing, local manufacturing is restricted, and a smaller number of clinical trials. Nevertheless, the biotech sector in countries including Brazil and Mexico is on the rise, and regulations are getting better. Increased awareness, government efforts, and collaborations with international biopharma firms are likely to fuel future market growth. However, obstacles including expense and lack of skills, remain.

Key Players:

Gene therapy starting materials Companies, including Thermo Fisher Scientific, Sartorius AG, Merck KGaA, Catalent Inc., WuXi Advanced Therapies, Aldevron, Charles River Laboratories, Lonza Group AG, AGC Biologics, Oxford Biomedica, Vigene Biosciences, Brammer Bio, GenScript Biotech, Takara Bio Inc., VGXI, Inc., CBM, Andelyn Biosciences, VIVEbiotech, Touchlight Genetics, MilliporeSigma, and other players.

Recent Developments:

  • In May 2024, Aldevron introduced an ultra-pure research-grade plasmid DNA platform in May 2024, streamlining early-stage gene therapy workflows and accelerating transitions over preclinical discovery to clinical-grade manufacturing.

  • In April 2024, Touchlight Genetics partnered with OXGENE to develop scalable, antibiotic-free AAV gene therapy platforms using doggybone DNA (dbDNA) technology, boosting manufacturing efficiency and regulatory compliance.

Gene Therapy Starting Materials Market Report Scope

Report Attributes Details
Market Size in 2024 USD 1.85 billion     
Market Size by 2032 USD 7.53 billion      
CAGR CAGR of 19.21% From 2025 to 2032
Base Year 2024
Forecast Period 2025-2032
Historical Data 2021-2023
Report Scope & Coverage Market Size, Segments Analysis, Competitive Landscape, Regional Analysis, DROC & SWOT Analysis, Forecast Outlook
Key Segments • By Product (Viral Vectors, Plasmid DNA, Cell Lines, Others)
• By Stage (Pre-clinical Therapeutics, Clinical Therapeutics, Marketed Therapeutics)
• By Application (Oncology, Infectious Disease, Genetic Disease, Others)
•By End User(Biopharmaceutical & Pharmaceutical Companies, CROs & CMOs, Others)
Regional Analysis/Coverage North America (US, Canada, Mexico), Europe (Germany, France, UK, Italy, Spain, Poland, Turkey, Rest of Europe), Asia Pacific (China, India, Japan, South Korea, Singapore, Australia, Rest of Asia Pacific), Middle East & Africa (UAE, Saudi Arabia, Qatar, South Africa, Rest of Middle East & Africa), Latin America (Brazil, Argentina, Rest of Latin America)
Company Profiles Thermo Fisher Scientific, Sartorius AG, Merck KGaA, Catalent Inc., WuXi Advanced Therapies, Aldevron, Charles River Laboratories, Lonza Group AG, AGC Biologics, Oxford Biomedica, Vigene Biosciences, Brammer Bio, GenScript Biotech, Takara Bio Inc., VGXI, Inc., CBM, Andelyn Biosciences, VIVEbiotech, Touchlight Genetics, MilliporeSigma, and other players.

Table of Contents

1. Introduction

1.1 Market Definition & Scope

 1.2 Research Assumptions & Abbreviations

 1.3 Research Methodology

2. Executive Summary

2.1 Market Snapshot

 2.2 Market Absolute $ Opportunity Assessment & Y-o-Y Analysis, 2021–2032

 2.3 Market Size & Forecast, By Segmentation, 2021–2032

  2.3.1 Market Size By Product 

  2.3.2 Market Size By Stage 

         2.3.2 Market Size By Application 

         2.3.2 Market Size By End-User

 2.4 Market Share & Bps Analysis By Region, 2024

 2.5 Industry Growth Scenarios – Conservative, Likely & Optimistic

 2.6 Industry CxO’s Perspective

3. Market Overview

3.1 Market Dynamics

  3.1.1 Drivers

  3.1.2 Restraints

  3.1.3 Opportunities

  3.1.4 Key Market Trends

 3.2 Industry PESTLE Analysis

 3.3 Key Industry Forces (Porter’s) Impacting Market Growth

 3.4 Industry Supply Chain Analysis

  3.4.1 Raw Material Suppliers

  3.4.2 Manufacturers

  3.4.3 Distributors/Suppliers

  3.4.4 Customers/End-Users

 3.5 Industry Life Cycle Assessment

 3.6 Parent Market Overview

 3.7 Market Risk Assessment

4. Statistical Insights & Trends Reporting

4.1 Raw Material Volume Trends (2020–2032)
 4.1.1 Global and regional demand volumes for plasmids, viral vectors, and oligonucleotides
 4.1.2 CAGR comparison: viral vectors vs non-viral delivery systems
 4.1.3 Clinical vs commercial scale material demand trends

4.2 Customer Segmentation and End-User Utilization (2024)
 4.2.1 Utilization share by biopharma, CROs, and academic institutions
 4.2.2 Therapeutic area-wise consumption: oncology, rare diseases, ophthalmology
 4.2.3 Small vs large biotech enterprise adoption rates

4.3 Manufacturing Capacity and Infrastructure Trends (2020–2024)
 4.3.1 Number and regional distribution of GMP manufacturing facilities
 4.3.2 Trends in CDMO partnerships for raw material production
 4.3.3 Expansion of automated and closed-system production lines

4.4 Regulatory and Quality Compliance Trends (2024)
 4.4.1 Regional variation in GMP requirements for raw materials
 4.4.2 FDA/EMA inspection frequency and non-compliance trends
 4.4.3 Adoption of quality-by-design (QbD) in raw material processes

4.5 Pricing Dynamics and Cost Optimization (2024)
 4.5.1 Average cost trends by material type (e.g., plasmid vs AAV vectors)
 4.5.2 Impact of scale and outsourcing on unit pricing
 4.5.3 Movement toward standardized pricing and long-term supply agreements

 5. Gene Therapy Starting Materials Market Segmental Analysis & Forecast, By Product, 2021 – 2032, Value (USD Billion)

5.1 Introduction

 5.2 Viral Vectors

  5.2.1 Key Trends

  5.2.2 Market Size & Forecast, 2021 – 2032

 5.3 Plasmid DNA

  5.3.1 Key Trends

  5.3.2 Market Size & Forecast, 2021 – 2032

 5.4 Cell Lines

  5.4.1 Key Trends

  5.4.2 Market Size & Forecast, 2021 – 2032

 5.5 Others

  5.5.1 Key Trends

  5.5.2 Market Size & Forecast, 2021 – 2032

6. Gene Therapy Starting Materials Market Segmental Analysis & Forecast, By Stage, 2021 – 2032, Value (USD Billion)

    6.1 Introduction

 6.2 Pre-clinical Therapeutics

  6.2.1 Key Trends

  6.2.2 Market Size & Forecast, 2021 – 2032

 6.3 Clinical Therapeutics

  6.3.1 Key Trends

  6.3.2 Market Size & Forecast, 2021 – 2032

 6.4 Marketed Therapeutics

  6.4.1 Key Trends

  6.4.2 Market Size & Forecast, 2021 – 2032

7. Gene Therapy Starting Materials Market Segmental Analysis & Forecast, By Application, 2021 – 2032, Value (USD Billion)

    7.1 Introduction

 7.2 Oncology

  7.2.1 Key Trends

  7.2.2 Market Size & Forecast, 2021 – 2032

 7.3 Infectious Disease

  7.3.1 Key Trends

  7.3.2 Market Size & Forecast, 2021 – 2032

 7.4 Genetic Disease

  7.4.1 Key Trends

  7.4.2 Market Size & Forecast, 2021 – 2032

 7.5 Others

  7.5.1 Key Trends

  7.5.2 Market Size & Forecast, 2021 – 2032

8. Gene Therapy Starting Materials Market Segmental Analysis & Forecast, By End-User, 2021 – 2032, Value (USD Billion)

    8.1 Introduction

 8.2 Biopharmaceutical & Pharmaceutical Companies

  8.2.1 Key Trends

  8.2.2 Market Size & Forecast, 2021 – 2032

 8.3 CROs & CMOs

  8.3.1 Key Trends

  8.3.2 Market Size & Forecast, 2021 – 2032

 8.4 Others

  8.4.1 Key Trends

  8.4.2 Market Size & Forecast, 2021 – 2032

9. Gene Therapy Starting Materials Market Segmental Analysis & Forecast By Region, 2021 – 2025, Value (USD Billion)

9.1 Introduction

9.2 North America

 9.2.1 Key Trends

 9.2.2 Gene Therapy Starting Materials Market Size & Forecast, By Product, 2021 – 2032

 9.2.3 Gene Therapy Starting Materials Market Size & Forecast, By Stage, 2021 – 2032

 9.2.4 Gene Therapy Starting Materials Market Size & Forecast, By Application, 2021 – 2032

 9.2.5 Gene Therapy Starting Materials Market Size & Forecast, By End-User, 2021 – 2032

 9.2.6 Gene Therapy Starting Materials Market Size & Forecast, By Country, 2021 – 2032

  9.2.6.1 USA

   9.2.6.1.1 Gene Therapy Starting Materials Market Size & Forecast, By Product, 2021 – 2032

   9.2.6.1.2 Gene Therapy Starting Materials Market Size & Forecast, By Stage, 2021 – 2032

   9.2.6.1.3 Gene Therapy Starting Materials Market Size & Forecast, By Application, 2021 – 2032

   9.2.6.1.4 Gene Therapy Starting Materials Market Size & Forecast, By End-User, 2021 – 2032

  9.2.6.2 Canada

   9.2.6.2.1 Gene Therapy Starting Materials Market Size & Forecast, By Product, 2021 – 2032

   9.2.6.2.2 Gene Therapy Starting Materials Market Size & Forecast, By Stage, 2021 – 2032

   9.2.6.2.3 Gene Therapy Starting Materials Market Size & Forecast, By Application, 2021 – 2032

   9.2.6.2.4 Gene Therapy Starting Materials Market Size & Forecast, By End-User, 2021 – 2032

9.3 Europe

 9.3.1 Key Trends

 9.3.2 Gene Therapy Starting Materials Market Size & Forecast, By Product, 2021 – 2032

 9.3.3 Gene Therapy Starting Materials Market Size & Forecast, By Stage, 2021 – 2032

 9.3.4 Gene Therapy Starting Materials Market Size & Forecast, By Application, 2021 – 2032

 9.3.5 Gene Therapy Starting Materials Market Size & Forecast, By End-User, 2021 – 2032

 9.3.6 Gene Therapy Starting Materials Market Size & Forecast, By Country, 2021 – 2032

  9.3.6.1 Germany

   9.3.6.1.1 Gene Therapy Starting Materials Market Size & Forecast, By Product, 2021 – 2032

   9.3.6.1.2 Gene Therapy Starting Materials Market Size & Forecast, By Stage, 2021 – 2032

   9.3.6.1.3 Gene Therapy Starting Materials Market Size & Forecast, By Application, 2021 – 2032

   9.3.6.1.4 Gene Therapy Starting Materials Market Size & Forecast, By End-User, 2021 – 2032

  9.3.6.2 UK

   9.3.6.2.1 Gene Therapy Starting Materials Market Size & Forecast, By Product, 2021 – 2032

   9.3.6.2.2 Gene Therapy Starting Materials Market Size & Forecast, By Stage, 2021 – 2032

   9.3.6.2.3 Gene Therapy Starting Materials Market Size & Forecast, By Application, 2021 – 2032

   9.3.6.2.4 Gene Therapy Starting Materials Market Size & Forecast, By End-User, 2021 – 2032

  9.3.6.3 France

   9.3.6.3.1 Gene Therapy Starting Materials Market Size & Forecast, By Product, 2021 – 2032

   9.3.6.3.2 Gene Therapy Starting Materials Market Size & Forecast, By Stage, 2021 – 2032

   9.3.6.3.3 Gene Therapy Starting Materials Market Size & Forecast, By Application, 2021 – 2032

   9.3.6.3.4 Gene Therapy Starting Materials Market Size & Forecast, By End-User, 2021 – 2032

  9.3.6.4 Italy

   9.3.6.4.1 Gene Therapy Starting Materials Market Size & Forecast, By Product, 2021 – 2032

   9.3.6.4.2 Gene Therapy Starting Materials Market Size & Forecast, By Stage, 2021 – 2032

   9.3.6.4.3 Gene Therapy Starting Materials Market Size & Forecast, By Application, 2021 – 2032

   9.3.6.4.4 Gene Therapy Starting Materials Market Size & Forecast, By End-User, 2021 – 2032

  9.3.6.5 Spain

   9.3.6.5.1 Gene Therapy Starting Materials Market Size & Forecast, By Product, 2021 – 2032

   9.3.6.5.2 Gene Therapy Starting Materials Market Size & Forecast, By Stage, 2021 – 2032

   9.3.6.5.3 Gene Therapy Starting Materials Market Size & Forecast, By Application, 2021 – 2032

   9.3.6.5.4 Gene Therapy Starting Materials Market Size & Forecast, By End-User, 2021 – 2032

  9.3.6.6 Russia

   9.3.6.6.1 Gene Therapy Starting Materials Market Size & Forecast, By Product, 2021 – 2032

   9.3.6.6.2 Gene Therapy Starting Materials Market Size & Forecast, By Stage, 2021 – 2032

   9.3.6.6.3 Gene Therapy Starting Materials Market Size & Forecast, By Application, 2021 – 2032

   9.3.6.6.4 Gene Therapy Starting Materials Market Size & Forecast, By End-User, 2021 – 2032

  9.3.6.7 Poland

   9.3.6.7.1 Gene Therapy Starting Materials Market Size & Forecast, By Product, 2021 – 2032

   9.3.6.7.2 Gene Therapy Starting Materials Market Size & Forecast, By Stage, 2021 – 2032

   9.3.6.7.3 Gene Therapy Starting Materials Market Size & Forecast, By Application, 2021 – 2032

   9.3.6.7.4 Gene Therapy Starting Materials Market Size & Forecast, By End-User, 2021 – 2032

  9.3.6.8 Rest of Europe

   9.3.6.8.1 Gene Therapy Starting Materials Market Size & Forecast, By Product, 2021 – 2032

   9.3.6.8.2 Gene Therapy Starting Materials Market Size & Forecast, By Stage, 2021 – 2032

   9.3.6.8.3 Gene Therapy Starting Materials Market Size & Forecast, By Application, 2021 – 2032

   9.3.6.8.4 Gene Therapy Starting Materials Market Size & Forecast, By End-User, 2021 – 2032   

9.4 Asia-Pacific

 9.4.1 Key Trends

 9.4.2 Gene Therapy Starting Materials Market Size & Forecast, By Product, 2021 – 2032

 9.4.3 Gene Therapy Starting Materials Market Size & Forecast, By Stage, 2021 – 2032

 9.4.4 Gene Therapy Starting Materials Market Size & Forecast, By Application, 2021 – 2032

 9.4.5 Gene Therapy Starting Materials Market Size & Forecast, By End-User, 2021 – 2032

 9.4.6 Gene Therapy Starting Materials Market Size & Forecast, By Country, 2021 – 2032

  9.4.6.1 China

   9.4.6.1.1 Gene Therapy Starting Materials Market Size & Forecast, By Product, 2021 – 2032

   9.4.6.1.2 Gene Therapy Starting Materials Market Size & Forecast, By Stage, 2021 – 2032

   9.4.6.1.3 Gene Therapy Starting Materials Market Size & Forecast, By Application, 2021 – 2032

   9.4.6.1.4 Gene Therapy Starting Materials Market Size & Forecast, By End-User, 2021 – 2032

  9.4.6.2 India

   9.4.6.2.1 Gene Therapy Starting Materials Market Size & Forecast, By Product, 2021 – 2032

   9.4.6.2.2 Gene Therapy Starting Materials Market Size & Forecast, By Stage, 2021 – 2032

   9.4.6.2.3 Gene Therapy Starting Materials Market Size & Forecast, By Application, 2021 – 2032

   9.4.6.2.4 Gene Therapy Starting Materials Market Size & Forecast, By End-User, 2021 – 2032

  9.4.6.3 Japan

   9.4.6.3.1 Gene Therapy Starting Materials Market Size & Forecast, By Product, 2021 – 2032

   9.4.6.3.2 Gene Therapy Starting Materials Market Size & Forecast, By Stage, 2021 – 2032

   9.4.6.3.3 Gene Therapy Starting Materials Market Size & Forecast, By Application, 2021 – 2032

   9.4.6.3.4 Gene Therapy Starting Materials Market Size & Forecast, By End-User, 2021 – 2032

  9.4.6.4 South Korea

   9.4.6.4.1 Gene Therapy Starting Materials Market Size & Forecast, By Product, 2021 – 2032

   9.4.6.4.2 Gene Therapy Starting Materials Market Size & Forecast, By Stage, 2021 – 2032

   9.4.6.4.3 Gene Therapy Starting Materials Market Size & Forecast, By Application, 2021 – 2032

   9.4.6.4.4 Gene Therapy Starting Materials Market Size & Forecast, By End-User, 2021 – 2032

  9.4.6.5 Australia

   9.4.6.5.1 Gene Therapy Starting Materials Market Size & Forecast, By Product, 2021 – 2032

   9.4.6.5.2 Gene Therapy Starting Materials Market Size & Forecast, By Stage, 2021 – 2032

   9.4.6.5.3 Gene Therapy Starting Materials Market Size & Forecast, By Application, 2021 – 2032

   9.4.6.5.4 Gene Therapy Starting Materials Market Size & Forecast, By End-User, 2021 – 2032

  9.4.6.6 ASEAN Countries

   9.4.6.6.1 Gene Therapy Starting Materials Market Size & Forecast, By Product, 2021 – 2032

   9.4.6.6.2 Gene Therapy Starting Materials Market Size & Forecast, By Stage, 2021 – 2032

   9.4.6.6.3 Gene Therapy Starting Materials Market Size & Forecast, By Application, 2021 – 2032

   9.4.6.6.4 Gene Therapy Starting Materials Market Size & Forecast, By End-User, 2021 – 2032

  9.4.6.7 Rest of Asia-Pacific

   9.4.6.7.1 Gene Therapy Starting Materials Market Size & Forecast, By Product, 2021 – 2032

   9.4.6.7.2 Gene Therapy Starting Materials Market Size & Forecast, By Stage, 2021 – 2032

   9.4.6.7.3 Gene Therapy Starting Materials Market Size & Forecast, By Application, 2021 – 2032

   9.4.6.7.4 Gene Therapy Starting Materials Market Size & Forecast, By End-User, 2021 – 2032

9.5 Latin America

 9.5.1 Key Trends

 9.5.2 Gene Therapy Starting Materials Market Size & Forecast, By Product, 2021 – 2032

 9.5.3 Gene Therapy Starting Materials Market Size & Forecast, By Stage, 2021 – 2032

 9.5.4 Gene Therapy Starting Materials Market Size & Forecast, By Application, 2021 – 2032

 9.5.5 Gene Therapy Starting Materials Market Size & Forecast, By End-User, 2021 – 2032

 9.5.6 Gene Therapy Starting Materials Market Size & Forecast, By Country, 2021 – 2032

  9.5.6.1 Brazil

   9.5.6.1.1 Gene Therapy Starting Materials Market Size & Forecast, By Product, 2021 – 2032

   9.5.6.1.2 Gene Therapy Starting Materials Market Size & Forecast, By Stage, 2021 – 2032

   9.5.6.1.3 Gene Therapy Starting Materials Market Size & Forecast, By Application, 2021 – 2032

   9.5.6.1.4 Gene Therapy Starting Materials Market Size & Forecast, By End-User, 2021 – 2032

  9.5.6.2 Argentina

   9.5.6.2.1 Gene Therapy Starting Materials Market Size & Forecast, By Product, 2021 – 2032

   9.5.6.2.2 Gene Therapy Starting Materials Market Size & Forecast, By Stage, 2021 – 2032

   9.5.6.2.3 Gene Therapy Starting Materials Market Size & Forecast, By Application, 2021 – 2032

   9.5.6.2.4 Gene Therapy Starting Materials Market Size & Forecast, By End-User, 2021 – 2032

  9.5.6.3 Mexico

   9.5.6.3.1 Gene Therapy Starting Materials Market Size & Forecast, By Product, 2021 – 2032

   9.5.6.3.2 Gene Therapy Starting Materials Market Size & Forecast, By Stage, 2021 – 2032

   9.5.6.3.3 Gene Therapy Starting Materials Market Size & Forecast, By Application, 2021 – 2032

   9.5.6.3.4 Gene Therapy Starting Materials Market Size & Forecast, By End-User, 2021 – 2032

  9.5.6.4 Colombia

   9.5.6.4.1 Gene Therapy Starting Materials Market Size & Forecast, By Product, 2021 – 2032

   9.5.6.4.2 Gene Therapy Starting Materials Market Size & Forecast, By Stage, 2021 – 2032

   9.5.6.4.3 Gene Therapy Starting Materials Market Size & Forecast, By Application, 2021 – 2032

   9.5.6.4.4 Gene Therapy Starting Materials Market Size & Forecast, By End-User, 2021 – 2032

  9.5.6.5 Rest of Latin America

   9.5.6.5.1 Gene Therapy Starting Materials Market Size & Forecast, By Product, 2021 – 2032

   9.5.6.5.2 Gene Therapy Starting Materials Market Size & Forecast, By Stage, 2021 – 2032

   9.5.6.5.3 Gene Therapy Starting Materials Market Size & Forecast, By Application, 2021 – 2032

   9.5.6.5.4 Gene Therapy Starting Materials Market Size & Forecast, By End-User, 2021 – 2032

9.6 Middle East & Africa

 9.6.1 Key Trends

 9.6.2 Gene Therapy Starting Materials Market Size & Forecast, By Product, 2021 – 2032

 9.6.3 Gene Therapy Starting Materials Market Size & Forecast, By Stage, 2021 – 2032

 9.6.4 Gene Therapy Starting Materials Market Size & Forecast, By Application, 2021 – 2032

 9.6.5 Gene Therapy Starting Materials Market Size & Forecast, By End-User, 2021 – 2032

 9.6.6 Gene Therapy Starting Materials Market Size & Forecast, By Country, 2021 – 2032

  9.6.6.1 UAE

   9.6.6.1.1 Gene Therapy Starting Materials Market Size & Forecast, By Product, 2021 – 2032

   9.6.6.1.2 Gene Therapy Starting Materials Market Size & Forecast, By Stage, 2021 – 2032

   9.6.6.1.3 Gene Therapy Starting Materials Market Size & Forecast, By Application, 2021 – 2032

   9.6.6.1.4 Gene Therapy Starting Materials Market Size & Forecast, By End-User, 2021 – 2032

  9.6.6.2 Saudi Arabia

   9.6.6.2.1 Gene Therapy Starting Materials Market Size & Forecast, By Product, 2021 – 2032

   9.6.6.2.2 Gene Therapy Starting Materials Market Size & Forecast, By Stage, 2021 – 2032

   9.6.6.2.3 Gene Therapy Starting Materials Market Size & Forecast, By Application, 2021 – 2032

   9.6.6.2.4 Gene Therapy Starting Materials Market Size & Forecast, By End-User, 2021 – 2032

  9.6.6.3 Qatar

   9.6.6.3.1 Gene Therapy Starting Materials Market Size & Forecast, By Product, 2021 – 2032

   9.6.6.3.2 Gene Therapy Starting Materials Market Size & Forecast, By Stage, 2021 – 2032

   9.6.6.3.3 Gene Therapy Starting Materials Market Size & Forecast, By Application, 2021 – 2032

   9.6.6.3.4 Gene Therapy Starting Materials Market Size & Forecast, By End-User, 2021 – 2032

  9.6.6.4 Egypt

   9.6.6.4.1 Gene Therapy Starting Materials Market Size & Forecast, By Product, 2021 – 2032

   9.6.6.4.2 Gene Therapy Starting Materials Market Size & Forecast, By Stage, 2021 – 2032

   9.6.6.4.3 Gene Therapy Starting Materials Market Size & Forecast, By Application, 2021 – 2032

   9.6.6.4.4 Gene Therapy Starting Materials Market Size & Forecast, By End-User, 2021 – 2032

  9.6.6.5 South Africa

   9.6.6.5.1 Gene Therapy Starting Materials Market Size & Forecast, By Product, 2021 – 2032

   9.6.6.5.2 Gene Therapy Starting Materials Market Size & Forecast, By Stage, 2021 – 2032

   9.6.6.5.3 Gene Therapy Starting Materials Market Size & Forecast, By Application, 2021 – 2032

   9.6.6.5.4 Gene Therapy Starting Materials Market Size & Forecast, By End-User, 2021 – 2032

  9.6.6.6 Rest of Middle East & Africa

   9.6.6.6.1 Gene Therapy Starting Materials Market Size & Forecast, By Product, 2021 – 2032

   9.6.6.6.2 Gene Therapy Starting Materials Market Size & Forecast, By Stage, 2021 – 2032

   9.6.6.6.3 Gene Therapy Starting Materials Market Size & Forecast, By Application, 2021 – 2032

   9.6.6.6.4 Gene Therapy Starting Materials Market Size & Forecast, By End-User, 2021 – 2032

10. Competitive Landscape

 10.1 Key Players' Positioning

 10.2 Competitive Developments

  10.2.1 Key Strategies Adopted (%), By Key Players, 2024

  10.2.2 Year-Wise Strategies & Development, 2021 – 2025

  10.2.3 Number Of Strategies Adopted By Key Players, 2024

 10.3 Market Share Analysis, 2024

 10.4 Product/Service & Application Benchmarking

  10.4.1 Product/Service Specifications & Features By Key Players

  10.4.2 Product/Service Heatmap By Key Players

  10.4.3 Application Heatmap By Key Players

 10.5 Industry Start-Up & Innovation Landscape

 10.6 Key Company Profiles

10.6 Key Company Profiles

 10.6.1 Thermo Fisher Scientific

  10.6.1.1 Company Overview & Snapshot

  10.6.1.2 Product/Service Portfolio

  10.6.1.3 Key Company Financials

  10.6.1.4 SWOT Analysis

 10.6.2 Sartorius AG

  10.6.2.1 Company Overview & Snapshot

  10.6.2.2 Product/Service Portfolio

  10.6.2.3 Key Company Financials

  10.6.2.4 SWOT Analysis

 10.6.3 Merck KGaA

  10.6.3.1 Company Overview & Snapshot

  10.6.3.2 Product/Service Portfolio

  10.6.3.3 Key Company Financials

  10.6.3.4 SWOT Analysis

 10.6.4 Catalent Inc.

  10.6.4.1 Company Overview & Snapshot

  10.6.4.2 Product/Service Portfolio

  10.6.4.3 Key Company Financials

  10.6.4.4 SWOT Analysis

 10.6.5 WuXi Advanced Therapies

  10.6.5.1 Company Overview & Snapshot

  10.6.5.2 Product/Service Portfolio

  10.6.5.3 Key Company Financials

  10.6.5.4 SWOT Analysis

 10.6.6 Aldevron

  10.6.6.1 Company Overview & Snapshot

  10.6.6.2 Product/Service Portfolio

  10.6.6.3 Key Company Financials

  10.6.6.4 SWOT Analysis

 10.6.7 Charles River Laboratories

  10.6.7.1 Company Overview & Snapshot

  10.6.7.2 Product/Service Portfolio

  10.6.7.3 Key Company Financials

  10.6.7.4 SWOT Analysis

 10.6.8 Lonza Group AG

  10.6.8.1 Company Overview & Snapshot

  10.6.8.2 Product/Service Portfolio

  10.6.8.3 Key Company Financials

  10.6.8.4 SWOT Analysis

 10.6.9 AGC Biologics

  10.6.9.1 Company Overview & Snapshot

  10.6.9.2 Product/Service Portfolio

  10.6.9.3 Key Company Financials

  10.6.9.4 SWOT Analysis

 10.6.10 Oxford Biomedica

  10.6.10.1 Company Overview & Snapshot

  10.6.10.2 Product/Service Portfolio

  10.6.10.3 Key Company Financials

  10.6.10.4 SWOT Analysis

 10.6.11 Vigene Biosciences

  10.6.11.1 Company Overview & Snapshot

  10.6.11.2 Product/Service Portfolio

  10.6.11.3 Key Company Financials

  10.6.11.4 SWOT Analysis

 10.6.12 Brammer Bio

  10.6.12.1 Company Overview & Snapshot

  10.6.12.2 Product/Service Portfolio

  10.6.12.3 Key Company Financials

  10.6.12.4 SWOT Analysis

 10.6.13 GenScript Biotech

  10.6.13.1 Company Overview & Snapshot

  10.6.13.2 Product/Service Portfolio

  10.6.13.3 Key Company Financials

  10.6.13.4 SWOT Analysis

 10.6.14 Takara Bio Inc.

  10.6.14.1 Company Overview & Snapshot

  10.6.14.2 Product/Service Portfolio

  10.6.14.3 Key Company Financials

  10.6.14.4 SWOT Analysis

 10.6.15 VGXI, Inc.

  10.6.15.1 Company Overview & Snapshot

  10.6.15.2 Product/Service Portfolio

  10.6.15.3 Key Company Financials

  10.6.15.4 SWOT Analysis

 10.6.16 CBM 

  10.6.16.1 Company Overview & Snapshot

  10.6.16.2 Product/Service Portfolio

  10.6.16.3 Key Company Financials

  10.6.16.4 SWOT Analysis

 10.6.17 Andelyn Biosciences

  10.6.17.1 Company Overview & Snapshot

  10.6.17.2 Product/Service Portfolio

  10.6.17.3 Key Company Financials

  10.6.17.4 SWOT Analysis

 10.6.18 VIVEbiotech

  10.6.18.1 Company Overview & Snapshot

  10.6.18.2 Product/Service Portfolio

  10.6.18.3 Key Company Financials

  10.6.18.4 SWOT Analysis

 10.6.19 Touchlight Genetics

  10.6.19.1 Company Overview & Snapshot

  10.6.19.2 Product/Service Portfolio

  10.6.19.3 Key Company Financials

  10.6.19.4 SWOT Analysis

 10.6.20 MilliporeSigma

  10.6.20.1 Company Overview & Snapshot

  10.6.20.2 Product/Service Portfolio

  10.6.20.3 Key Company Financials

  10.6.20.4 SWOT Analysis

11. Analyst Recommendations

 11.1 SNS Insider Opportunity Map

 11.2 Industry Low-Hanging Fruit Assessment

 11.3 Market Entry & Growth Strategy

 11.4 Analyst Viewpoint & Suggestions On Market Growth

12. Assumptions

13. Disclaimer

14. Appendix

 14.1 List Of Tables

 14.2 List Of Figures

Key Segments: 

By Product 

    • Viral Vectors

    • Plasmid DNA

    • Cell Lines

    • Others

By Stage 

  • Pre-clinical Therapeutics

  • Clinical Therapeutics

  • Marketed Therapeutics

By Application 

  • Oncology

  • Infectious Disease

  • Genetic Disease

  • Others

By End-User

  • Biopharmaceutical & Pharmaceutical Companies

  • CROs & CMOs

  • Others

Request for Segment Customization as per your Business Requirement: https://www.snsinsider.com/sample-request/7513

Regional Coverage: 

North America

  • US

  • Canada

  • Mexico

Europe

  • Germany

  • France

  • UK

  • Italy

  • Spain

  • Poland

  • Turkey

  • Rest of Europe

Asia Pacific

  • China

  • India

  • Japan

  • South Korea

  • Singapore

  • Australia

  • Rest of Asia Pacific

Middle East & Africa

  • UAE

  • Saudi Arabia

  • Qatar

  • South Africa

  • Rest of Middle East & Africa

Latin America

  • Brazil

  • Argentina

  • Rest of Latin America

Request for Country Level Research Report: Country Level Customization Request

Available Customization 

With the given market data, SNS Insider offers customization as per the company’s specific needs. The following customization options are available for the report: 

  • Detailed Volume Analysis 

  • Criss-Cross segment analysis (e.g. Product X Application) 

  • Competitive Product Benchmarking 

  • Geographic Analysis 

  • Additional countries in any of the regions 

  • Customized Data Representation 

  • Detailed analysis and profiling of additional market players

An accurate research report requires proper strategizing as well as implementation. There are multiple factors involved in the completion of good and accurate research report and selecting the best methodology to compete the research is the toughest part. Since the research reports we provide play a crucial role in any company’s decision-making process, therefore we at SNS Insider always believe that we should choose the best method which gives us results closer to reality. This allows us to reach at a stage wherein we can provide our clients best and accurate investment to output ratio.

Each report that we prepare takes a timeframe of 350-400 business hours for production. Starting from the selection of titles through a couple of in-depth brain storming session to the final QC process before uploading our titles on our website we dedicate around 350 working hours. The titles are selected based on their current market cap and the foreseen CAGR and growth.


The 5 steps process:

Step 1: Secondary Research:

Secondary Research or Desk Research is as the name suggests is a research process wherein, we collect data through the readily available information. In this process we use various paid and unpaid databases which our team has access to and gather data through the same. This includes examining of listed companies’ annual reports, Journals, SEC filling etc. Apart from this our team has access to various associations across the globe across different industries. Lastly, we have exchange relationships with various university as well as individual libraries.

Secondary Research

Step 2: Primary Research

When we talk about primary research, it is a type of study in which the researchers collect relevant data samples directly, rather than relying on previously collected data.  This type of research is focused on gaining content specific facts that can be sued to solve specific problems. Since the collected data is fresh and first hand therefore it makes the study more accurate and genuine.

We at SNS Insider have divided Primary Research into 2 parts.

Part 1 wherein we interview the KOLs of major players as well as the upcoming ones across various geographic regions. This allows us to have their view over the market scenario and acts as an important tool to come closer to the accurate market numbers. As many as 45 paid and unpaid primary interviews are taken from both the demand and supply side of the industry to make sure we land at an accurate judgement and analysis of the market.

This step involves the triangulation of data wherein our team analyses the interview transcripts, online survey responses and observation of on filed participants. The below mentioned chart should give a better understanding of the part 1 of the primary interview.

Primary Research

Part 2: In this part of primary research the data collected via secondary research and the part 1 of the primary research is validated with the interviews from individual consultants and subject matter experts.

Consultants are those set of people who have at least 12 years of experience and expertise within the industry whereas Subject Matter Experts are those with at least 15 years of experience behind their back within the same space. The data with the help of two main processes i.e., FGDs (Focused Group Discussions) and IDs (Individual Discussions). This gives us a 3rd party nonbiased primary view of the market scenario making it a more dependable one while collation of the data pointers.

Step 3: Data Bank Validation

Once all the information is collected via primary and secondary sources, we run that information for data validation. At our intelligence centre our research heads track a lot of information related to the market which includes the quarterly reports, the daily stock prices, and other relevant information. Our data bank server gets updated every fortnight and that is how the information which we collected using our primary and secondary information is revalidated in real time.

Data Bank Validation

Step 4: QA/QC Process

After all the data collection and validation our team does a final level of quality check and quality assurance to get rid of any unwanted or undesired mistakes. This might include but not limited to getting rid of the any typos, duplication of numbers or missing of any important information. The people involved in this process include technical content writers, research heads and graphics people. Once this process is completed the title gets uploader on our platform for our clients to read it.

Step 5: Final QC/QA Process:

This is the last process and comes when the client has ordered the study. In this process a final QA/QC is done before the study is emailed to the client. Since we believe in giving our clients a good experience of our research studies, therefore, to make sure that we do not lack at our end in any way humanly possible we do a final round of quality check and then dispatch the study to the client.