Glass Manufacturing Market Report Scope & Overview:
Get E-PDF Sample Report on Glass Manufacturing Market - Request Sample Report
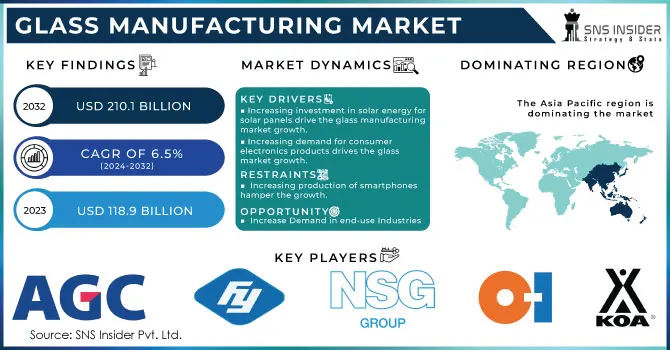
The Glass Manufacturing Market Size was valued at USD 118.9 billion in 2023 and is expected to reach USD 210.1 billion by 2032 and grow at a CAGR of 6.5% over the forecast period 2024-2032.
The rise of the glass manufacturing market increased due to the general rising demand from various industries, for example, construction, automobile, and consumer goods. Many factors spur this growth. Rapid development in construction activities around the world and especially in the emerging economies has increased demand for glass in building facades, windows, and decorative items. Furthermore, the increasing interest in vehicles to be lighter and fuel-efficient units is increasing the demand for laminated and tempered glasses. The volatile environmental conditions and altered environmental laws also influence market dynamics, compelling manufacturers to be innovative and to find green-friendly manufacturing processes. For instance, in February 2023 Arglass won an important investment in the sum of $230 million in a glass furnace project. The said investment was aimed at demonstrating the company's will to expand production capacities within the industry. It represents the trend of modernization with enlarged capacity to face the increasing demand. It also part of a more comprehensive strategy that producers of glass are implementing to raise efficiency in operations and introduce greater technologies to face competitive position in a changing market. Such progress has underpinned the industry's commitment to innovation and change, thereby ensuring the ability of the manufacturers to satisfy the needs of their diverse customer base with effective resource utilization.
Sustainability focus is further amplified by a significant agreement signed last May between the unidentified Indian glass manufacturer and a supplier of green hydrogen. It focuses on the introduction of green hydrogen to the glass production lines and this can help reduce carbon emissions further by enhancing environmentally friendly and responsible practices. That is not only fitting with the sustainability goals, but also with ever-growing awareness of being green at the level of consumers in various regions, pushing producers to develop eco-friendly products.
In the Tamil Nadu market, it has been announced that a major player will set up a facility for covering glass manufacturing in SIPCOT Pillaipakkam, in January 2024. This new investment is with covering glass manufacturing based on growing demand from domestic as well as international markets for such specialized products of glass. Facilities developed in such situations do reflect the efforts of the manufacturing companies to exploit regional advantages and local demand where they can immediately respond to emerging trends in the market. The thrust toward regional development and specialization is yet another indication of dynamic changes in the glass manufacturing market as companies try to improve their product diversification as well as enforce their market presence. All of these trends indicate that the glass manufacturing sector is not lagging behind in terms of observing market dynamics, embracing innovation, and discussing issues of sustainability.
Glass Manufacturing Market Dynamics:
Drivers:
-
Increasing Demand for Glass in Construction and Infrastructure Development Drives Market Growth
The global construction industry is undergoing a significant transformation, with an increasing demand for glass products due to their aesthetic appeal, energy efficiency, and sustainability features. Modern architectural trends prioritize large glass facades, which enhance natural lighting and contribute to energy savings by minimizing reliance on artificial lighting. Additionally, regulatory frameworks in many regions mandate the use of energy-efficient materials, further propelling the adoption of glass in building projects. As urbanization continues to rise, particularly in emerging markets, the need for residential and commercial structures is escalating, thus boosting the demand for glass in construction. Furthermore, glass is not only used for windows but also plays a vital role in interior design elements, such as partitions and decorative surfaces, making it a versatile choice for architects and builders alike. This growing trend is reflected in numerous construction projects worldwide, with glass manufacturers investing in advanced technologies to meet the specific requirements of modern constructions. Consequently, the surge in construction activities directly correlates with the growth of the glass manufacturing market, making it a critical driver of industry expansion.
-
Technological Advancements in Glass Manufacturing Enhance Product Performance and Market Competitiveness
Technological innovation is a vital driver of the glass manufacturing market, as advancements in production processes lead to improved product performance and a broader range of applications. Manufacturers are increasingly adopting cutting-edge technologies, such as automated production lines, advanced glass tempering techniques, and energy-efficient manufacturing processes, to enhance the quality and durability of glass products. Innovations like smart glass, which can change transparency based on environmental conditions, are gaining traction in various sectors, including automotive and construction, further expanding market opportunities. Additionally, the development of lightweight and impact-resistant glass products is addressing the needs of industries such as aerospace and automotive, where reducing weight is crucial for improving fuel efficiency and safety. These technological advancements not only enable manufacturers to meet diverse customer demands but also improve production efficiency and reduce costs. As companies invest in research and development to innovate new glass solutions, they enhance their competitiveness in the market, positioning themselves favorably against traditional materials like plastic and metal. This continuous evolution driven by technology significantly contributes to the growth of the glass manufacturing market.
Restraint:
-
Fluctuating Raw Material Prices Challenge Glass Manufacturers' Profitability and Sustainability
One of the significant restraints affecting the glass manufacturing market is the volatility in the prices of raw materials, such as silica sand, soda ash, and limestone. These materials are essential for glass production, and any fluctuations in their prices can significantly impact the overall production costs for manufacturers. Such volatility often arises from geopolitical tensions, changes in supply chain dynamics, and environmental regulations that may limit the availability of certain raw materials. Consequently, manufacturers may face challenges in maintaining their profit margins, as they must balance the costs of production with competitive pricing in the market. Moreover, the increasing emphasis on sustainability is pushing manufacturers to source raw materials responsibly, which can further complicate procurement strategies and add to production costs. The dependency on these raw materials also poses risks related to environmental impacts and regulatory compliance, which may result in additional expenses for manufacturers. Therefore, managing raw material costs effectively while ensuring sustainable practices is a critical challenge that glass manufacturers must navigate to maintain profitability in a competitive market landscape.
Opportunity:
-
Growing Adoption of Sustainable Glass Products Presents New Market Prospects
The increasing global emphasis on sustainability and eco-friendly practices presents a significant opportunity for the glass manufacturing market. As consumers and industries alike become more environmentally conscious, the demand for sustainable glass products is surging. This trend includes recycled glass, which not only reduces waste but also lowers energy consumption during production, making it an attractive alternative to traditional glass. Moreover, manufacturers are exploring innovative ways to integrate eco-friendly materials and production techniques into their processes, aligning with global sustainability goals. The rise of green building certifications and regulations is further fueling the demand for sustainable glass solutions, as architects and builders seek materials that contribute to energy efficiency and lower carbon footprints. In addition, the development of advanced coatings and treatments for glass that enhance energy efficiency and insulation properties is creating new opportunities for market players to differentiate their offerings. By focusing on sustainability and innovation, glass manufacturers can position themselves as leaders in the market while addressing the evolving preferences of environmentally conscious consumers and businesses.
Challenge:
-
Intense Competition and Market Saturation Pressure Profit Margins in Glass Manufacturing
Intense competition within the glass manufacturing market poses a significant challenge for manufacturers striving to maintain profitability and market share. As numerous players operate in this space, the market has become increasingly saturated, leading to price wars and compressed profit margins. Established companies are continuously innovating and enhancing their product offerings, which raises the bar for newer entrants and smaller manufacturers. This competitive landscape necessitates substantial investments in research and development to stay relevant and meet the evolving demands of customers. Additionally, the pressure to reduce costs while maintaining high quality creates a challenging balancing act for manufacturers. Companies must also navigate changing consumer preferences and emerging technologies that could disrupt traditional glass products. To succeed in such a competitive environment, manufacturers need to develop unique selling propositions, invest in marketing strategies, and enhance operational efficiencies. Failure to adapt to these challenges may result in diminished market presence and reduced profitability, making it crucial for companies to remain agile and proactive in their approach to competition within the glass manufacturing industry.
Glass Manufacturing Market Segmentation Overview
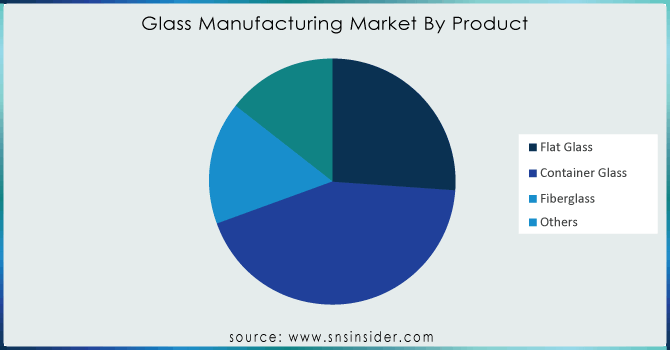
By Product
In 2023, flat glass dominated the glass manufacturing market, and accounted for a revenue share of approximately 45%. This dominance can be attributed to the increasing demand for architectural and automotive applications. Flat glass is widely used in building facades, windows, and interior partitions, making it a crucial component in the booming construction industry. Additionally, the automotive sector's shift towards larger windows and sunroofs in vehicles has further fueled the demand for flat glass products. For example, major automotive manufacturers are increasingly incorporating advanced flat glass solutions for safety and aesthetic purposes. Moreover, energy-efficient flat glass options, such as low-emissivity (low-E) glass, are gaining traction due to rising energy conservation efforts, solidifying flat glass's leading position in the market.
Get Customized Report as per your Business Requirement - Request For Customized Report
By End-use Application
In 2023, the building and construction segment dominated the glass manufacturing market, accounting for a market share of around 40%. This segment's prominence is largely driven by the surge in construction activities worldwide, particularly in residential and commercial projects. The increasing trend of modern architecture that emphasizes natural light and energy efficiency has led to a higher demand for glass products, such as windows, doors, and curtain walls. For instance, many urban development’s feature large glass facades that not only enhance aesthetic appeal but also provide energy savings by reducing the need for artificial lighting. Additionally, the push for sustainable building practices has encouraged the use of energy-efficient glass, such as triple-glazed or low-E glass, further boosting the building and construction segment's growth. This trend highlights the integral role of glass in modern architecture and urban planning, solidifying its position as the leading end-use application in the market.
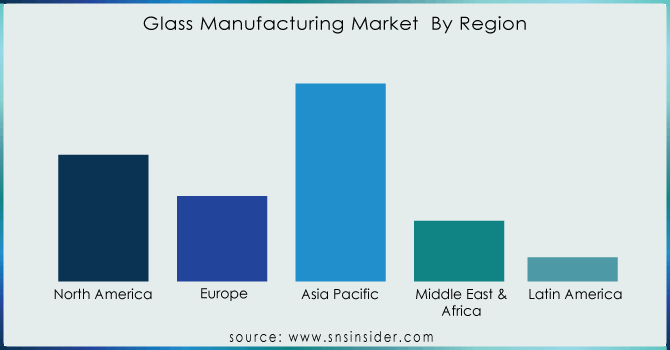
Glass Manufacturing Market Regional Analysis
In 2023, North America dominated the glass manufacturing market, with a market share of approximately 35%. This dominance can be attributed to the region's robust construction sector, which is experiencing significant growth fueled by urbanization and infrastructure development. The United States, in particular, has seen an increase in residential and commercial building projects, resulting in a higher demand for flat glass and specialty glass products. For instance, major cities like New York and Los Angeles are witnessing a surge in high-rise constructions that heavily utilize glass for aesthetic and functional purposes. Additionally, advancements in energy-efficient glass technologies, driven by stringent building codes and regulations focused on sustainability, have further solidified North America's leading position in the market. The region's commitment to innovation and quality in glass manufacturing also plays a crucial role in maintaining its dominance.
Moreover, in 2023, Asia-Pacific emerged as the fastest-growing region in the glass manufacturing market, with a CAGR of around 6.5%. This growth is primarily driven by rapid urbanization, industrialization, and increasing infrastructure investments in countries like China and India. The construction boom in urban centers has led to a heightened demand for glass products, especially in residential and commercial buildings. For example, China's Belt and Road Initiative has spurred extensive construction projects across the region, significantly increasing the demand for flat glass and container glass. Additionally, the automotive sector in Asia-Pacific is expanding, further driving the demand for specialized glass products. As consumer preferences shift towards energy-efficient and aesthetically appealing glass solutions, manufacturers are investing in advanced technologies to meet this growing demand. Consequently, the Asia-Pacific region is poised for significant growth in the glass manufacturing market in the coming years.
Recent Developments in Glass Manufacturing Market
October 2024: Guardian Glass expanded its production capacity to meet rising demand, investing in efficiency and sustainability to strengthen its market position.
July 2024: Qatar Glass Manufacturing Company produced its first glass at a new facility, enhancing local manufacturing capabilities and reducing reliance on imports.
January 2024: Optiemus Infracom and Corning announced a ₹1,000 crore joint venture to establish a glass manufacturing unit in Tamil Nadu, boosting local production to meet growing demand for specialty glass in India.
Key Players in Glass Manufacturing Market
-
AGC Inc (flat glass, automotive glass, specialty glass)
-
Amcor (glass bottles, jars, glass containers)
-
Central Glass Co. Ltd. (automotive glass, architectural glass, container glass)
-
Fuyao Glass Industry Group Co., Ltd. (automotive glass, flat glass, energy-saving glass)
-
Guardian Industries (float glass, mirror glass, coated glass)
-
Heinz Glass (glass containers, custom glass packaging, food and beverage jars)
-
Koa Glass (automotive glass, architectural glass, tempered glass)
-
Nihon Yamamura (glass containers, tableware, laboratory glass)
-
Nippon Sheet Glass Co., Ltd (float glass, automotive glass, architectural glass)
-
Owens Illinois Inc (glass containers, bottles, jars)
-
Saint Gobain (flat glass, insulating glass, laminated glass)
-
Sisecam Group (container glass, flat glass, glassware)
-
Trivium Packaging (glass containers, bottles, food packaging)
-
Verallia (glass containers, bottles, jars)
-
Vitro (automotive glass, flat glass, container glass)
-
O-I Glass, Inc. (glass bottles, jars, food containers)
-
PPG Industries, Inc. (coated glass, specialty glass, automotive glass)
-
Corning Incorporated (specialty glass, optical fiber, consumer glassware)
-
Mitsubishi Chemical Holdings Corporation (glass fiber, specialty glass, engineering plastics)
-
Schott AG (specialty glass, pharmaceutical glass, display glass)
Key Raw Material Suppliers in the Glass Manufacturing Market:
-
Soda Ash Suppliers
-
Tronox Limited
-
Solvay S.A.
-
FMC Corporation
-
-
Silica Sand Suppliers
-
U.S. Silica Holdings, Inc.
-
Fairmount Santrol (now part of Unimin)
-
Hi-Crush Inc.
-
-
Limestone Suppliers
-
Carmeuse Lime & Stone
-
Mississippi Lime Company
-
Lhoist Group
-
-
Alumina Suppliers
-
Alcoa Corporation
-
Rio Tinto Group
-
Norsk Hydro ASA
-
-
Feldspar Suppliers
-
The Feldspar Corporation
-
Imerys S.A.
-
Sibelco Group
-
-
Boric Acid Suppliers
-
Borax (a subsidiary of Rio Tinto)
-
Eti Maden
-
American Borate Company
-
-
Cullet Suppliers (recycled glass)
-
Strategic Materials, Inc.
-
Glass Mountain Capital, LLC
-
Sustainable Glass Solutions
-
-
Iron Oxide Suppliers
-
Lanxess AG
-
Huntsman Corporation
-
Tosoh Corporation
-
-
Magnesia Suppliers
-
Martin Marietta Materials, Inc.
-
Magnesita Refratários S.A.
-
Garrison Minerals, Inc.
-
-
Zinc Oxide Suppliers
-
Zochem, Inc.
-
American Zinc Recycling Corp.
-
Sumitomo Chemical Co., Ltd.
-
| Report Attributes | Details |
| Market Size in 2023 | US$ 118.91 billion |
| Market Size by 2032 | US$ 210.1 Billion |
| CAGR | CAGR of 6.5% From 2024 to 2032 |
| Base Year | 2023 |
| Forecast Period | 2024-2032 |
| Historical Data | 2020-2022 |
| Report Scope & Coverage | Market Size, Segments Analysis, Competitive Landscape, Regional Analysis, DROC & SWOT Analysis, Forecast Outlook |
| Key Segments | • By Product (Flat Glass, Container Glass, Fiberglass, Others) • By Application (Construction, Packaging, Transportation, Telecommunication, Electronics, Others), |
| Regional Analysis/Coverage | North America (US, Canada, Mexico), Europe (Eastern Europe [Poland, Romania, Hungary, Turkey, Rest of Eastern Europe] Western Europe [Germany, France, UK, Italy, Spain, Netherlands, Switzerland, Austria, Rest of Western Europe]), Asia Pacific (China, India, Japan, South Korea, Vietnam, Singapore, Australia, Rest of Asia Pacific), Middle East & Africa (Middle East [UAE, Egypt, Saudi Arabia, Qatar, Rest of Middle East], Africa [Nigeria, South Africa, Rest of Africa], Latin America (Brazil, Argentina, Colombia, Rest of Latin America) |
| Company Profiles | AGC Inc., Fuyao Glass Industry Group Co., Ltd., Nippon Sheet Glass Co., Ltd, Owens Illinois Inc, Koa Glass, Saint Gobain, Amcor, Vitro, S.A.B. DE C.V., Ltd., Sisecam Group, Guardian Industries, Heinz Glass, 3B - the fiberglass company, Nihon Yamamura., Xinyi Glass Holdings Co., Central Glass Co. Ltd., and other players |
| Key Drivers |
• Increasing investment in solar energy for solar panels drive the glass manufacturing market growth. • Increasing demand for consumer electronics products drives the glass market growth. |
| RESTRAINTS | • Increasing production of smartphones hamper the growth |
Frequently Asked Questions
Ans: USD 210.1 Billion is the projected Glass Manufacturing Market size of the market by 2032.
Ans: The expected CAGR of the global Glass Manufacturing Market during the forecast period is 6.53%.
Ans: The container glass will grow rapidly in the Glass Manufacturing Market from 2024-2032.
Ans: Factors such as increasing investment in solar energy for solar panels drive the glass manufacturing market growth.
Ans: The U.S. led the Glass Manufacturing Market in Asia Pacific region with highest revenue share in 2023.
Get in Touch
