Carbon Footprint Management Market Report Scope & Overview:
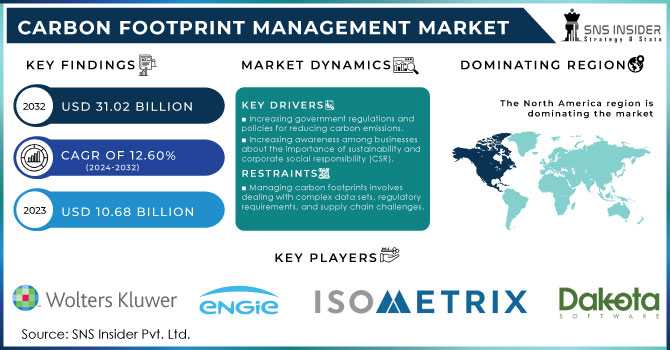
Carbon Footprint Management Market Size was valued at USD 10.68 Billion in 2023 and is expected to reach USD 31.02 Billion by 2032 and grow at a CAGR of 12.60 % over the forecast period 2024-2032.
The global Carbon Footprint Management Market is driven by Increasing energy demand in industries, the implementation of COP27 (United Nations Climate Change Conference or Conference of the Parties of the UNFCCC) targets for reducing global warming, and increased government initiatives to reduce carbon emissions. Growing concerns about climate change, weather anomalies, and global warming, along with technological advancements and R&D activities, helps to market growth. Industry adoption of sustainable energy solutions and government policies for low-carbon initiatives helps to drive the market. high installation and maintenance costs may be challenges. Major companies are adopting carbon footprint management technology, is drive demand for carbon footprint management.
Get More Information on Carbon Footprint Management Market - Request Sample Report
Increasing carbon emissions have been observed in the last few decades, which is raising the need for technologies for managing carbon footprints are significant drives fueling carbon footprint management solutions adoption. Dozens of leading brands are already conducting pilot programs across multiple sectors using carbon accounting and management tech. The technology is widely recognized as an economically powerful tool for tracking and assisting CO2 emission reduction target and climate goals. As of 2022, the U.S. has led in carbon capture and storage (CCS) initiatives with 34 projects in total. The U.S. Department of Energy has also entered the fray, providing loans that cover up to 80% costs for early-stage CCS projects helping in driving demand for carbon footprint management solutions. China plays host to the world's largest carbon trading market incorporating at least 40% of CO2 emissions by 2023 and more than 2000 power companies, with a national launch in July (Carbon Pulse). Worldwide, the total amount of CO2 emissions reached 36.8 billion metric tons in 2023, a 1% rise from 2022, mainly due to energy use in developing economies, a 80% of the Fortune 500 companies have set carbon reduction targets; 40% with net-zero emissions target by or before 2050. America is seeing a rise in the number of energy-intensive industries, many are large CO 2 emitters such as iron and steel makers; oil & gas production businesses and cement firms) taking up CCS.
Market Dynamics
Drivers:
-
Increasing government regulations and policies for reducing carbon emissions.
-
Increasing awareness among businesses about the importance of sustainability and corporate social responsibility (CSR).
-
The technological Advancements, such as IoT, big data analytics, and AI (artificial intelligence), are providing innovative solutions for monitoring and managing carbon emissions.
-
Companies who effectively manage their carbon footprints gain a competitive edge by attracting environmentally conscious investors, partners, and customers.
The Government regulations and policies focused on reducing carbon emissions are drivers for the Carbon Footprint Management market. These regulations help businesses to adopt strategies for managing their carbon footprints more effectively. Governments worldwide implement stricter measures to combat climate change, organizations are compelled to invest in carbon footprint management solutions to ensure compliance and reduce environmental impact. This trend is driving the growth of the market as businesses are looking for ways to align with regulatory requirements and demonstrate their commitment to sustainability. The growing R&D and the need to test pilot projects are expected to lower overall CCS technology costs and increase its commercialization. These commercial-grade programs for large scale NER300/NER400-supported projects have driven market growth. Moreover, the inception of EU Emissions Performance Standard (EPS) has fueled a rapid uptake in carbon footprint management technologies. On the other hand, significant costs but also new plant set-up integration hurdles regarding carbon footprint management are evident. International electricity from batteries is cost-competitive with existing gas power and much cheaper than new nuclear, but other costs depend on the specific context deployment method, plant type, and fuel source in particular contribute to higher or lower figures for different technology's viability for many industries and countries.
Restraints:
-
Implementing carbon footprint management solutions often requires significant initial investments in technology, infrastructure, and training.
-
Managing carbon footprints involves dealing with complex data sets, regulatory requirements, and supply chain challenges.
-
Companies with global supply chains may face difficulties in accurately measuring and managing their carbon footprints across diverse geographic locations and regulatory environments.
Implementing carbon footprint management solutions requires high investments in technology, infrastructure, and training. Companies need to acquire and deploy sophisticated tools for data collection, analysis, and reporting, which can be costly. infrastructure upgrades may be necessary to support these solutions effectively. Training programs are essential to ensure employees understand how to use the new technology and comply with carbon footprint management practices. The initial financial commitment, these investments are crucial for businesses aiming to reduce their environmental impact and meet regulatory requirements effectively.
Opportunities:
-
The Consistently Increasing demand for green technologies Creates opportunities for companies offering carbon footprint management solutions.
-
Collaborating with industry partners, technology providers, and sustainability experts can create opportunities for developing comprehensive carbon management strategies and innovative solutions.
-
The Growing of green financing and investments in sustainable projects creates opportunities for organizations to secure funding for carbon reduction initiatives.
Market segmentation
By deployment mode
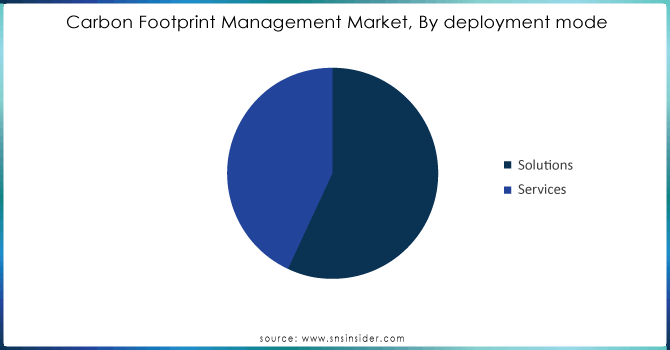
On the basis of Deployment Mode, the cloud segment held revenue share of more than 53.60% of the global carbon footprint market, driven by its benefits such as accessibility, scalability, and cost-effectiveness. Cloud solutions offer remote access to real-time environmental data, leading to widespread adoption across industries. On-premises segment expected to grow with the fastest CAGR during Forecast periods.
Need any customization research on Carbon Footprint Management Market - Enquiry Now
By Type
During 2023, the largest share held by the enterprise-tier set with a percentage of more than 38.5%. An enterprise-tier carbon management system is a very sophisticated piece of software that can be extremely complex and comprehensive, as this type of solution aims at the enterprise-tier large organizations with high in complexity operations larger emissions profiles robust reporting requirements. The systems provide sophisticated tracking, measurement and reporting functionalities for carbon emissions & sustainability data; hence crucial for industries willing to reduce large scale CO2 molecule. This increased demand for enterprise-grade carbon footprint management solutions is driving a growing awareness. The mid-tier segment accounted for a notable share of the market being valued at 31% during in 2023 Mid-tier systems offer broader functionality and are suitable for mid-sized organizations than basic-level tools. These solutions are the best-fitted for small to medium territorial coverage, low emission-level companies typically not multinational corporates. They do this by allowing these organizations to easily track and control their carbon emissions as well as some of the activities touching in other sustainability areas, such capabilities useful for reaching environmental goals. The mid-tier segment held a substantial portion of the market, mirroring wider acknowledgement within medium-sized businesses that carbon footprint monitoring is crucial as they implement these solutions to stay in line with global sustainability norms and regulations.
By vertical
On the basis of verticals, the manufacturing sector is dominated the carbon footprint management market withheld revenue share of more than 38%. because of the manufacturing is a major source of carbon emissions globally. While some companies acknowledge and address these emissions, many are still seeking ways to reduce them. The adoption of low-carbon practices in manufacturing is not just about environmental benefits but also about mitigating risks like regulatory, competitive, litigation, reputation, and brand value risks. The iron and steel industry contributed 7% of industrial CO2 emissions, as reported by the IEA and UNIDO.
Regional Analysis
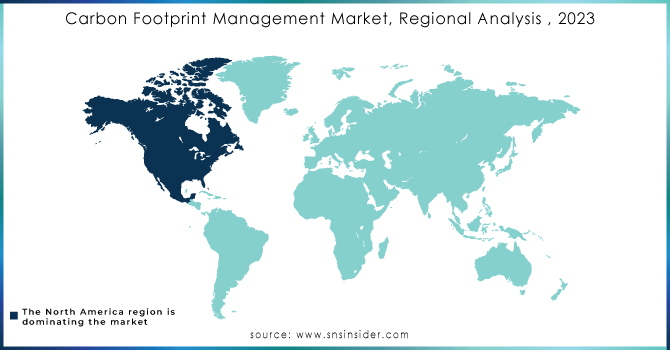
North America Region dominated the global Carbon Footprint Management Market and held Revenue share of More than 35%, due to its significant greenhouse gas emissions, driven by increasing climate change concerns and regulatory efforts in the U.S. and Canada. Initiatives such as the EPA's ACE Rule contribute to the region's growing carbon footprint management market. The United States is the leading state within the region by contributing significant share of North America. The United States was the first to develop the CCS technology following the start in 1978. The United States achieved a significant breakthrough in August 2023 where the US department of energy announced an additional USD 1.2 billion investment to launch two new CCS facilities in the U.S. in Texas and Louisiana. The CCS is targeting to mitigate carbon emissions, and the measures will concentrate on direct air capture. The U.S. Department of Energy will also establish 4 DAC hubs to remove about 1 million tons of CO2 from the atmosphere. Additionally, from 2019, Canada’s carbon pricing system has set the minimum carbon price of approximately CAD 65 per a ton of CO2, which was expected to increase to CAD 170 per a ton by 2030. The system affects territories and provinces that have not established a carbon price.
In Asia-Pacific, rapid industrialization and urbanization create opportunities, especially with emerging economies contributing to air quality regulations. China's emissions trading program and India's carbon reduction goals under the Paris Agreement drive market expansion. Europe benefits from stringent environmental regulations, while Latin America and the Middle East & Africa show steady growth due to climate change challenges. with the National University of Japan and ExxonMobil conducting feasibility tests in the region following which the region was confirmed as the best suitable for carbon sequestration. In light of these events, ExxonMobil had established a low-carbon solutions department in Asia, targeting to launch a carbon capture and storage business where a storage capacity of about 300 billion tons was expected in Southeast Asia. Japan Energy Center also reports that the Southeast Asia has a reservoir of 300 billion tons of CO2. China, as the largest emitter of carbon dioxide, is working to increase its carbon capture and storage capacity by a multiplier of 2 times. China already operates about 14 carbon capture and utilization and storage facilities with an annual capacity of about 2.1 million tons and targeting an additional 8 CCS projects by 2025. Therefore, due to the increased use of CCS, many markets are expected to grow.
Key Players
The major key players are Carbon Footprint Ltd, Dakota Software Corporation, ENGIE, IsoMetrix, IBM corporation, Process MAP, Schneider Electric, SAP, Wolters Kluwer N.V. , Carbon Trust and other players mentioned in the final report.
|
Report Attributes |
Details |
|---|---|
|
Market Size in 2023 |
USD 10.68 Billion |
|
Market Size by 2032 |
USD 31.02 Billion |
|
CAGR |
CAGR 12.60 % From 2024 to 2032 |
|
Base Year |
2023 |
|
Forecast Period |
2024-2032 |
|
Historical Data |
2020-2022 |
|
Report Scope & Coverage |
Market Size, Segments Analysis, Competitive Landscape, Regional Analysis, DROC & SWOT Analysis, Forecast Outlook |
|
Key Segments |
• By Component (Solution and Services) |
|
Regional Analysis/Coverage |
North America (US, Canada, Mexico), Europe (Eastern Europe [Poland, Romania, Hungary, Turkey, Rest of Eastern Europe] Western Europe] Germany, France, UK, Italy, Spain, Netherlands, Switzerland, Austria, Rest of Western Europe]), Asia Pacific (China, India, Japan, South Korea, Vietnam, Singapore, Australia, Rest of Asia Pacific), Middle East & Africa (Middle East [UAE, Egypt, Saudi Arabia, Qatar, Rest of Middle East], Africa [Nigeria, South Africa, Rest of Africa], Latin America (Brazil, Argentina, Colombia, Rest of Latin America) |
|
Company Profiles |
Carbon Footprint Ltd, Dakota Software Corporation, ENGIE, IsoMetrix, IBM corporation, Process MAP, Schneider Electric, SAP, and Wolters Kluwer N.V. |
|
Key Drivers |
• Increasing government regulations and policies for reducing carbon emissions. |
|
Market Restraints |
• Implementing carbon footprint management solutions often requires significant initial investments in technology, infrastructure, and training. |
Frequently Asked Questions
Ans:
- The Increasing government regulations and policies aimed at reducing carbon emissions are driving the market.
- Increasing awareness among businesses about the importance of sustainability and corporate social responsibility (CSR) is encouraging them to adopt carbon footprint management practices.
- Consumers are increasingly choosing products and services from environmentally responsible companies, pushing organizations to focus on reducing their carbon footprints.
Ans: North America region is dominant in Carbon Footprint Management Market.
Ans: The Manufacturing Vertical segment dominated the Carbon Footprint Management Market.
Ans. The projected market size for the Carbon Footprint Management Market is USD 31.02 billion by 2032.
Ans. The Compound Annual Growth rate for the Carbon Footprint Management Market over the forecast period is 12.60%.
Get in Touch
