Smart Glass Market Size & Overview:
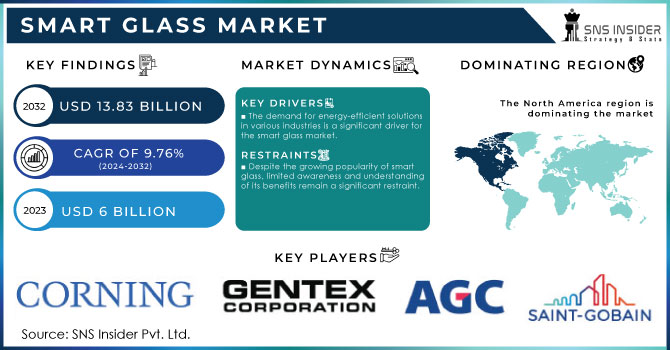
The Smart Glass Market Size was valued at USD 6.59 Billion in 2024 and is expected to reach USD 13.87 Billion by 2032, growing at a CAGR of 9.76% over the forecast period 2025-2032.
The smart glass market has gained significant traction in recent years, driven by advancements in smart glass technology and increasing demand for energy-efficient solutions in various sectors. This market has witnessed remarkable growth, with an impressive 32.7 million units by 2022. The augmented reality (AR) glasses segment is poised for continued expansion, with projected unit sales of 2.11 million in 2023 and an anticipated increase to 3.9 million units in 2024. This surge in adoption is underscored by the belief of 49% of surgeons who assert that smart glasses could significantly reduce complications and fatalities in operating rooms, primarily by mitigating human error. Smart glass can regulate indoor temperatures, thereby reducing reliance on heating and cooling systems. by automatically adjusting to sunlight and other environmental conditions, smart glass solutions help, maintain comfortable living and working environments, contributing to significant energy savings. This characteristic is particularly beneficial in commercial buildings, where energy consumption accounts for a large portion of operational costs. As a result, many architects and builders are incorporating smart glass technology into their designs to meet stringent energy efficiency standards and green building certifications.
To get more information on Smart Glass Market - Request Sample Report
Smart Glass Market Highlights:
-
Wide Applications: Smart glass is used in commercial buildings, residential properties, and public spaces to provide privacy, control glare, and enhance aesthetics.
-
Energy Efficiency Driver: Technologies like electrochromic, photochromic, and thermochromic glass reduce energy consumption by automatically adjusting tint, potentially lowering energy use by up to 30%.
-
Sustainability Support: Growing energy costs, green building regulations, and incentives drive adoption in eco-friendly construction projects.
-
Health & Comfort Benefits: Smart glass maximizes natural light, reduces glare and heat, controls indoor temperature, and improves acoustic comfort, supporting well-being and productivity.
-
Market Awareness Challenges: Limited understanding among consumers and businesses slows adoption; education, marketing, and case studies are needed to build trust.
-
Standardization Needs: Lack of clear regulations and guidelines for smart glass products can create market confusion; establishing standards will enhance confidence and adoption.
Smart glasses are increasingly used in commercial buildings, residential properties, and public spaces, serving various functions, including providing privacy, controlling glare, and enhancing overall aesthetic appeal. For instance, large glass facades in office buildings can incorporate smart glass technologies that automatically tint in response to sunlight, thereby reducing glare and enhancing occupant comfort without sacrificing natural light. Furthermore, in high-end residential projects, smart glass can be employed in windows and skylights to create seamless transitions between indoor and outdoor spaces while maintaining privacy when needed.
Smart Glass Market Drivers:
-
The demand for energy-efficient solutions in various industries is a significant driver for the smart glass market.
Smart glass technologies, such as electrochromic, photochromic, and thermochromics glasses, have been created to regulate solar heat absorption and enhance thermal efficiency in buildings. The increase in energy prices, support from regulations for sustainability, and the requirement for green building certifications are major factors fueling this demand. Smart glass technologies allow buildings to change their tint automatically according to the amount of natural light present outside. This feature improves indoor comfort and decreases dependence on artificial lighting and climate control, resulting in reduced energy usage and expenses. Architects and builders are incorporating smart glass into their designs more frequently due to growing concerns about climate change and sustainability, to align with regulations and consumer demands for eco-friendly living. For example, smart glass has the potential to lower energy usage by as much as 30% in commercial structures. Additionally, smart glass in energy-efficient buildings can also make them eligible for financial incentives and grants from government agencies, which helps boost the market even more.
-
The rising awareness of health and comfort in indoor environments is driving the demand for smart glass.
Research has indicated that natural sunlight has positive effects on mental health, productivity, and general wellness. Smart glass technologies improve how much natural light can enter a space and reduce the effects of glare and heat, resulting in healthier indoor environments. Additionally, smart glass can assist in controlling indoor temperatures, leading to enhanced comfort for inhabitants. Smart glass can improve the quality of life in homes and businesses by maximizing natural light and decreasing the need for artificial lighting. This emphasis on health and comfort is in line with the growing movement towards creating environments that focus on promoting the well-being of those who inhabit them. Moreover, smart glass can enhance acoustic comfort through the reduction of external noise. This is especially advantageous in urban areas where the issue of noise pollution is a problem. The increasing desire for well-being and comfort among consumers and businesses is driving up the demand for smart glass solutions.
Smart Glass Market Restraints:
-
Despite the growing popularity of smart glass, limited awareness and understanding of its benefits remain a significant restraint.
Many consumers and businesses are still unfamiliar with smart glass technologies and their potential applications. This lack of awareness can lead to hesitance in adopting smart glass solutions, particularly in industries that have traditionally relied on conventional glazing options. Education and outreach efforts are crucial for overcoming this barrier. Manufacturers and industry stakeholders must invest in marketing and awareness campaigns to highlight the advantages of smart glass, such as energy savings, improved comfort, and aesthetic appeal. by displaying successful case studies and real-world applications, the industry can build trust and credibility among potential customers. Furthermore, the absence of standardized regulations and guidelines for smart glass products can create confusion in the market. As the industry matures, the establishment of clear standards and certifications will help enhance consumer confidence and facilitate wider adoption.
Smart Glass Market Segment Analysis:
By Technology
The electrochromic segment led the market with a 63.12% market share in 2024, because of its varied applications and effectiveness in energy control. Electrochromic glass alters its shade when exposed to an electric current, allowing for adjustable management of light and warmth transfer. This feature is in high demand in both commercial and residential structures for saving energy and increasing comfort. For example, View, Inc. is one of the companies that produce smart windows using electrochromic technology to change tint levels automatically during the day, enhancing energy efficiency by decreasing the reliance on artificial lighting and heating.
Suspended Particle Devices (SPD) are anticipated to experience the most rapid growth rate during 2025-2032 in the smart glass market because of their quick adjustability and exceptional performance. SPD glass has particles that can align or disperse when an electric field is applied, allowing for quick changes in transparency. This technology enables efficient management of glare and privacy in commercial and residential environments. Businesses like Gauzy have been at the forefront of advancing SPD technology, incorporating it into items like smart windows and sunroofs that can instantly change from see-through to non-transparent.
To Get Customized Report as per your Business Requirement - Request For Customized Report
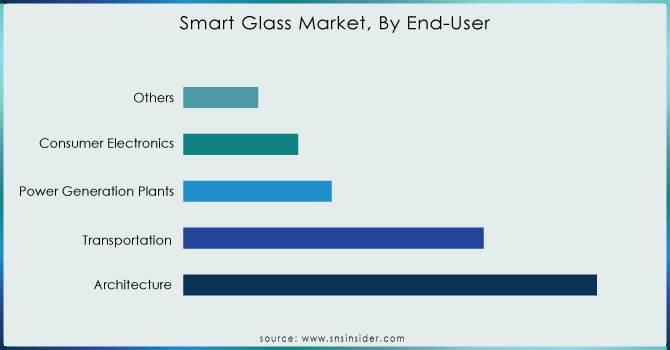
By Application
The transportation segment held a market share of over 45% in 2024 and dominated the market, because of its wide range of applications in different forms of transportation like cars, trains, and planes. Smart glass technology improves passenger comfort and safety by controlling light and heat, resulting in increased energy efficiency. For instance, Vision Systems and other companies offer innovative windows for airplanes that can change from clear to non-transparent, which decreases glare and improves passenger confidentiality. For instance, Mercedes-Benz utilizes smart glass in its high-end vehicles within the automotive industry, which enables customizable visibility and enhances the driving experience with cutting-edge technology.
The architectural segment is projected to show a rapid CAGR during 2025-2032, due to increasing consumer interest in energy-efficient buildings and smart home technologies. Smart glass in architecture helps with temperature control, decreases dependence on artificial lighting, and improves visual attractiveness. One company leading the way is Saint-Gobain, providing innovative glass solutions that change tint according to sunlight, enhancing energy efficiency in both commercial and residential structures.
Smart Glass Market Regional Analysis:
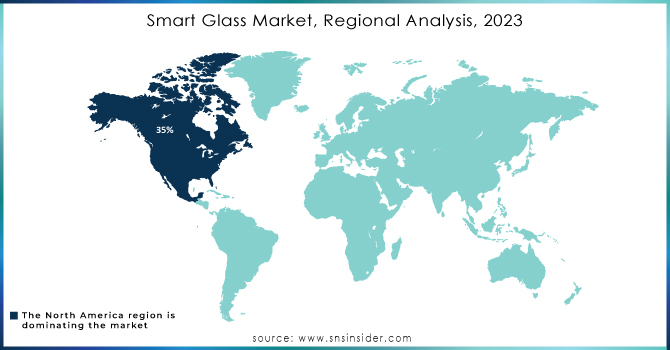
North America Smart Glass Market Trends:
North America dominated the smart glass market with a 35% market share in 2024. The market growth is further supported by the region's robust infrastructure and regulations that promote energy-efficient solutions. Companies like Glaston Corporation and SAGE Electrochromics are leading the way in developing electrochromic and photovoltaic glass technologies, respectively. The rising need for smart buildings, automotive uses, and consumer electronics has resulted in a greater emphasis on sustainability and energy efficiency, making smart glass a top choice.
Asia-Pacific Smart Glass Market Trends:
The Asia-Pacific region is anticipated to become the fastest-growing during the forecast period 2025-2032, due to fast urbanization, increasing disposable incomes, and growing emphasis on energy efficiency. Nations such as China and India are experiencing a rise in infrastructure growth, leading to an increase in the need for advanced construction materials like smart glass. Saint-Gobain and AGC Inc. are increasing their presence in APAC with a focus on architectural glass applications that improve energy efficiency and aesthetics. Moreover, the automotive industry in APAC is quickly embracing smart glass technologies for sunroofs and windows, offering customers increased comfort and energy efficiency.
Europe Smart Glass Market Trends:
Europe held a significant share of the smart glass market in 2024, driven by strict building regulations, energy-efficiency standards, and sustainability initiatives. Countries like Germany, France, and the UK are investing heavily in green buildings and smart infrastructure. Companies such as Saint-Gobain and AGC Inc. are actively supplying architectural and automotive smart glass solutions. The growing demand for energy-efficient office spaces, advanced automotive applications, and innovative consumer electronics continues to fuel the adoption of smart glass technologies.
Latin America Smart Glass Market Trends:
Latin America is experiencing moderate growth in the smart glass market, supported by increasing construction activities and the adoption of energy-efficient solutions. Countries such as Brazil and Mexico are focusing on modernizing commercial and residential buildings with sustainable glass technologies. Companies including AGC Inc., Saint-Gobain, and Corning are strengthening their regional footprint to offer electrochromic, photovoltaic, and privacy glass solutions. Rising awareness of energy efficiency and aesthetic architectural designs is expected to drive the adoption of smart glass across the region.
Middle East & Africa (MEA) Smart Glass Market Trends:
The MEA smart glass market is witnessing steady growth due to rapid urbanization, large-scale infrastructure projects, and rising adoption of energy-efficient building materials. The region’s hot climate drives demand for solar-control and thermochromic smart glass solutions in commercial and residential buildings. Key players like Guardian Industries and Saint-Gobain are expanding their presence to meet the demand for advanced architectural glass solutions. Additionally, the luxury automotive sector is increasingly incorporating smart glass for enhanced passenger comfort and energy savings.
Smart Glass Market Key Players:
-
Saint-Gobain (SageGlass, Priva-lite)
-
View Inc. (View Smart Glass, Dynamic Glass)
-
Gentex Corporation (Automotive Electrochromic Mirrors, Home/Office Smart Glass)
-
AGC Inc. (WONDERLITE, Halio)
-
Research Frontiers Inc. (SPD-SmartGlass, SPD-Smart Windows)
-
Asahi Glass Co. Ltd. (LUMIFLON, SunGuard)
-
Corning Inc. (Gorilla Glass, Electrochromic Glass)
-
Schott AG (Smart Touch Display, Conturan Glass)
-
Polytronix, Inc. (Polyvision Privacy Glass, Switchable Glass)
-
PPG Industries, Inc. (Sungate Glass, Solarban Glass)
-
Kinestral Technologies, Inc. (Halio, Dynamic Glass Systems)
-
Guardian Industries (InGlass, SunGuard Smart Glass)
-
Smartglass International Ltd. (Smartglass Privacy Glass, Smartglass Projection Glass)
-
Gauzy Ltd. (Laminated PDLC Glass, SPD Smart Glass)
-
RavenWindow (RavenWindow Smart Glass, Thermochromic Glass)
-
Innovative Glass Corp. (EGlass, LC Privacy Glass)
-
LTI Smart Glass Inc. (LC Privacy Glass, Smart Film)
-
Fuyao Glass Industry Group Co., Ltd. (Automotive Smart Glass, Electrochromic Windows)
-
Hitachi Chemical Co., Ltd. (PDLC Smart Glass, Privacy Glass Solutions)
-
Nippon Sheet Glass Co. Ltd. (NSG) (Pilkington MirroView, Pilkington OptiView)
Suppliers of Smart Glass components:
-
Eastman Chemical Company
-
Solutia Inc.
-
DOW Chemicals
-
3M Company
-
Merck KGaA
-
Nitto Denko Corporation
-
Saint-Gobain Sekurit
-
Heraeus Holding GmbH
-
PPG Industries (Coatings and chemicals)
-
Solvay S.A.
Smart Glass Market Competitive Landscape:
Meta Platforms Inc. (Established 2004, rebranded 2021) is a Menlo Park, USA-based technology company developing smart glasses in partnership with EssilorLuxottica. Its Ray-Ban Meta smart glasses combine AI, AR, and audio features for hands-free calls, social sharing, and real-time assistance, positioning Meta as a leading innovator in wearable technology.
-
July 2024, Meta Platforms is considering buying a minority stake in Essilor Luxottica, the parent co of its partner in developing Ray-Ban Meta glasses, as it is rapidly advancing the development of smart glasses.
Apple Inc. (Established 1976) is a Cupertino, California-based technology company renowned for its innovation in consumer electronics. Apple is developing smart glasses, expected to launch by late 2026. These glasses aim to integrate AI capabilities, including photo and video capture, translation, and navigation,
-
February 2024, Apple is constantly experimenting with new products and concepts behind closed doors and occasionally, we catch wind of a couple of these ideas.
| Report Attributes | Details |
|---|---|
| Market Size in 2024 | USD 6.59 Billion |
| Market Size by 2032 | USD 2121.98 Million |
| CAGR | CAGR of 9.76% From 2024 to 2032 |
| Base Year | 2024 |
| Forecast Period | 2025-2032 |
| Historical Data | 2021-2023 |
| Report Scope & Coverage | Market Size, Segments Analysis, Competitive Landscape, Regional Analysis, DROC & SWOT Analysis, Forecast Outlook |
| Key Segments | • By Technology (Electrochromic, Polymer Dispersed Liquid Crystal (PDLC), Suspended Particle Devices (SPD), Thermochromic, Photochromic) • By Application (Architectural, Transportation, Consumer Electronics, Power Generation) • By Control Mode (Rheostats, Switches, Remote, Others) |
| Regional Analysis/Coverage | North America (US, Canada), Europe (Germany, UK, France, Italy, Spain, Russia, Poland, Rest of Europe), Asia Pacific (China, India, Japan, South Korea, Australia, ASEAN Countries, Rest of Asia Pacific), Middle East & Africa (UAE, Saudi Arabia, Qatar, South Africa, Rest of Middle East & Africa), Latin America (Brazil, Argentina, Mexico, Colombia, Rest of Latin America). |
| Company Profiles | Saint-Gobain, View Inc., Gentex Corporation, AGC Inc., Research Frontiers Inc., Asahi Glass Co. Ltd., Corning Inc., Schott AG, Polytronix, Inc., PPG Industries, Inc., Kinestral Technologies, Inc., Guardian Industries, Smartglass International Ltd., Gauzy Ltd., RavenWindow, Innovative Glass Corp., LTI Smart Glass Inc., Fuyao Glass Industry Group Co., Ltd., Hitachi Chemical Co., Ltd., Nippon Sheet Glass Co. Ltd. |
Frequently Asked Questions
Technological advances in the smart glasses market include, among other things, the development of more sensitive electrochromic materials that allow for faster tint adjustments. Innovations in Suspended Particle Display (SPD) technology improve dynamic control of light transmission. Integration with the Internet of Things (IoT) enables better connectivity and remote-control functionality.
The North American region dominates the Smart Glass Market.
The major key players in Smart Glass Market are Saint-Gobain (France), AGC Inc. (Japan), GENTEX CORPORATION (US), Corning Incorporated (US), Nippon Sheet Glass Co., Ltd (Japan), Taiwan Glass, Fuyao Glass, Central Glass, Innovative Glass Corp, Halio, Chromogenics Ab, Miru Smart Technologies, and Other
The Smart Glass Market was USD 6.59 Billion in 2024 and is expected to Reach USD 13.87 Billion by 2032.
The Smart Glass Market is expected to grow at a CAGR of 9.76% during 2025-2032.
Get in Touch
