Grid-Scale Battery Market Report Scope and Overview:
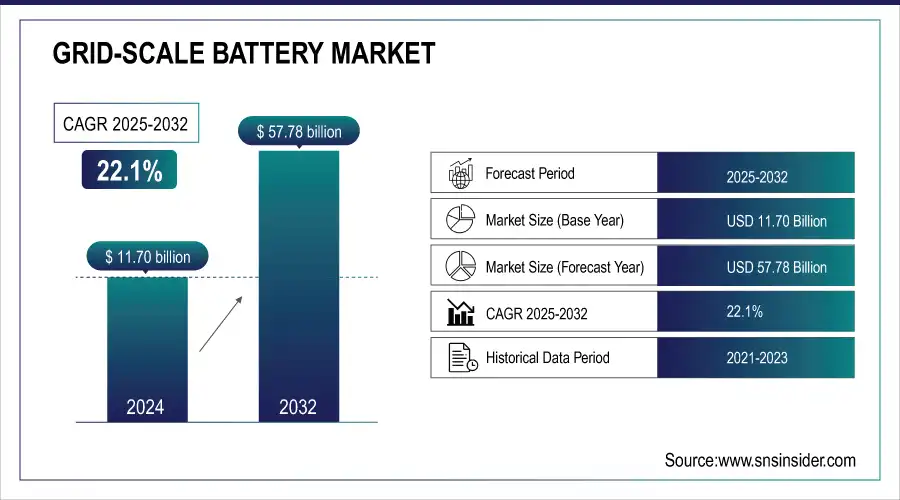
The Grid-Scale Battery Market size was valued at USD 14.29 billion in 2025 and is projected to reach USD 105.21 billion by 2035 With a Growing CAGR of 22.1% over the forecast period of 2026-2035.
The grid-scale battery Market analysis report provides an overview of large-scale energy storage systems designed to support and stabilize electrical grids. Applications A grid battery (a large-scale battery, utility-grade battery or giga-battery) is an energy storage system used to provide valuable services to the power grid. The grid-scale battery's main role is to hold onto excess electricity produced during off-peak hours and then unleash that power when it's needed the most. This helps maintain the balance between supply and demand of electricity to guarantee a secure and stable power system for consumers.
Grid-Scale Battery Market Size and Forecast:
-
Market Size in 2025: USD 14.29 Billion
-
Market Size by 2035: USD 105.21 Billion
-
CAGR: 22.1% from 2026 to 2035
-
Base Year: 2025
-
Forecast Period: 2026–2035
-
Historical Data: 2022–2024
Get more information on Grid-Scale Battery Market - Request Sample Report
Grid-Scale Battery Market Highlights:
-
Market growth drivers include increasing adoption of renewable energy sources and the transition toward sustainable power solutions supported by declining battery costs and improved energy storage performance
-
Renewable energy integration is driven by heavy investments in solar, wind, and hydropower projects supported by policies, tax incentives, and falling technology costs to reduce reliance on fossil fuels and lower emissions
-
Cost decline of battery technologies due to advancements in battery chemistry and manufacturing processes has led to lower costs, improved efficiency, and longer lifespans making grid-scale batteries more viable
-
High initial investment remains a major barrier as significant upfront costs for battery systems, energy management, and grid integration infrastructure often limit adoption to large utilities or government-supported projects
-
Integration of grid-scale batteries with smart grid infrastructure enhances energy management, frequency regulation, and peak load balancing while supporting demand response and improving grid resilience
-
Future outlook indicates that combining intelligent grid systems with large-scale storage will accelerate the transition to sustainable energy ensuring reliable power supply and better utilization of renewable sources
The grid-scale battery market has made huge strides over recent years on the back of wider adoption of renewable energy resources and demand for sustainable power solutions. With the world moving towards a sustainable and green future, there is an increasing demand for energy storage. Low costs of battery technology is one of the crucial factors driving this market. The cost of lithium-ion batteries used in grid-scale applications has been gradually at least partially dropping, putting them more in the running. Further, development in battery chemistry and manufacturing techniques has resulted in better efficiency and higher lifespan, which is also contributing to the growth of the market.
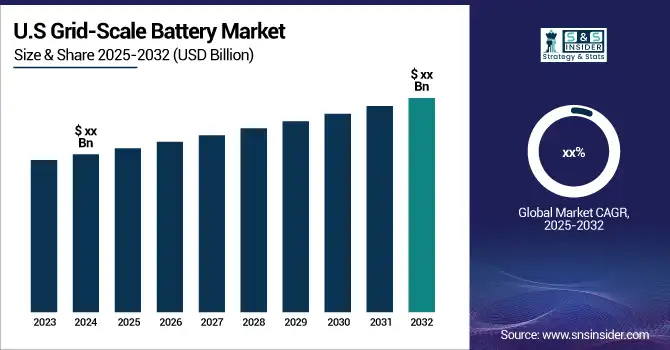
The U.S. grid-scale battery market size was estimated at USD 4.85 billion in 2025 and is projected to reach USD 35.90 billion by 2035, growing at a CAGR of 22.4% during the forecast period 2026-2035.
Market growth is attributed to the growing deployment of renewable energy sources, rising grid reliability and peak load management demand, and increasing investment in energy storage infrastructure. Increasing usage of lithium-ion batteries, favorable government regulations along with technological enhancements in long-duration energy storage are promoting market growth thereby enabling better grid stability, energy flexibility and effective integration of variable sources of power.
Grid-Scale Battery Market Drivers:
-
Growing demand for renewable energy sources
There is an increasing need for renewable energy resources due to the worldwide trend toward developing sustainable power in efforts to decrease reliance on fossil fuels and mitigate greenhouse gas emissions. Countries and companies around the world are stepping up their investment in solar, wind and hydropower projects as they work to reduce carbon emissions and keep pace with growing demand for electricity. Increases in energy storage, the grid and battery technologies also help facilitate integration of variable renewables in power systems.
Further, policies and tax incentives and the decrease in costs of renewable technologies are driving a greater adoption on an industrial scale, which is helping to expand country economies while contributing to sustainable energy practices across regions and markets at different levels.
Grid-Scale Battery Market Restraints:
- High initial investment required for grid-scale battery installations
One of the key challenges to the widespread adoption is a high capital cost for grid-scale battery installations. Such systems are associated to significant investments in advanced battery technologies, energy control systems and grid integration facilities. It costs to buy and install those high-capacity batteries, the land where they’re set up, the safety equipment needed and ancillary parts such as inverters, plus coolers.
Furthermore, it requires a lot of manpower and engineering knowledge increasing the cost of projects. While on-going operating and maintenance costs are moderate over the project life, the initial capital cost can prove to be too high for widespread market penetration unless they are artificially constrained either by large utilities or government-subsidized projects or through partnerships which require buy-down financing.
Grid-Scale Battery Market Opportunities:
- Integration of grid-scale batteries with smart grid infrastructure
The combination of grid-scale batteries and smart grid infrastructure can improve the security, flexibility, and efficiency of power systems. Those batteries store and release energy in real time, which can smooth out supply and demand but also keep up with intermittent sources like solar or wind power. Smart grids employ high-tech communication, automation, and analytics to maximize battery life, and control peak loads and so transmission losses.
It also allows for demand response programs, frequency regulation, and standby power during blackouts. Utilities, by intelligently managing the grid and integrating large-scale storage, can make the grid better while increasing resilience and making the transition to a more sustainable energy system more seamless.
Grid-Scale Battery Market Segmentation Analysis:
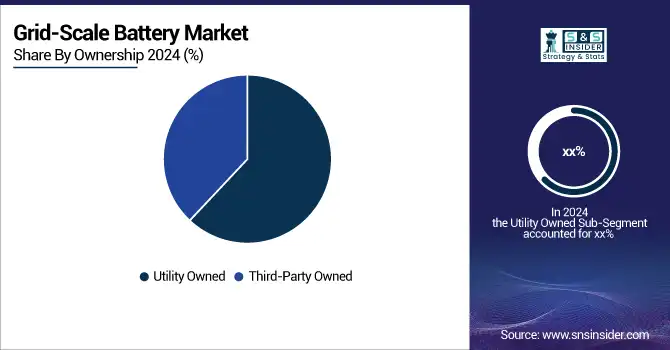
By Ownership
In 2025, grid-scale battery systems Owned by the utility have established a dominant position in the market, at utility scale utilities increasingly invest on storage of energy to increase grid stability and support integration with renewable resources (utilities), and satisfying regulatory requirements. These initiatives can leverage strong capital support and infrastructure which is already built. And third-party ownership continues to increase, propelled by independent power producers and energy-as-a-service provider models that provide easy financing, accelerated deployment, and lower upfront costs for end customers.
By Type
In 2025, lithium-ion batteries lead the grid-scale storage market, with significant share of deployment in front-of-meter applications due to high energy density and reliability and existing supply chain, this is particularly true for utility projects in North America. On the other hand, lithium-ion (Li-ion) technology develops toward higher energy and lower cost at an accelerating speed Sodium-based batteries like Na-ion battery (NIB) and sodium-sulfur (Na-S) become competitive in regions with abundant sodium resources. Furthermore, flow batteries in general, and vanadium redox flow battery in particular, are becoming attractive for their long cycle life, robustness and ability to handle long duration energy storage.
By Application
In 2025, Renewable energy integration is the largest contributor to grid-scale battery market, it is mainly due to immense expansion of solar and wind farm projects that demand cost-effective storage solutions for stabilizing power supply in grids. The expansion of ancillary services, such as frequency regulation and grid balancing, is an emerging trend as utilities work to increase reliability. Back-up power and peak shaving are also emerging in prominence, facilitating demand response and continuous available energy for various industries.
Grid-Scale Battery Market Regional Analysis:
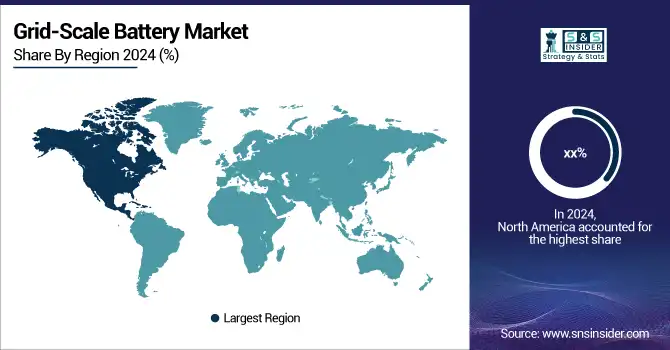
North America Grid-Scale Battery Market Trends:
In 2025, North America grid-scale battery market will cover majority of the demand and continue to be a key regional contender through 2026. The area has an established grid, high penetration of renewables and policy environment that are conducive for large-scale storage deployment. The U.S. leads deployments, with a mix of high-capacity lithium-ion and burgeoning sodium systems, while Canada scales up for more renewables integration duty. Technological progress, cost reduction and grid modernization efforts all further contribute to energy security, peak demand management and the overall stability of the system in the region.
Get Customized Report as per your Business Requirement - Request For Customized Report
Europe Grid-Scale Battery Market Trends:
Europe is emerging as a frontrunner in the grid-scale battery business thanks to aggressive targets for renewable energy and favorable regulation from the European Union. The region has made deep investments in wind and solar power, leading to significant demand for utility-scale energy storage technologies. These have prompted accelerated deployments, thanks to supportive policies, carbon reduction efforts and financing and the development of lithium-ion/sodium-ion/flow battery technologies that will help reinforce and augment grid reliability. Germany, the UK, France and others lead in the region when it comes to integrating batteries to manage intermittent renewable generation and achieve their climate neutrality objectives.
Asia-Pacific Grid-Scale Battery Market Trends:
Asia-Pacific is witnessing rapid growth in the grid-scale battery market in the forecasted period 2026-2035, fueled by rising electricity demand, large-scale renewable energy projects, and supportive government policies. China is leading the region in large commitments to lithium and nascent sodium-based battery technologies, while Japan and South Korea look towards advanced storage options that complement their smart grid pursuits. India also appears on the map, increasing adoption due to renewables integration and national energy storage policies. With a high concentration of manufacturing and innovation, the region is emerging as an epicenter for both producing and installing grid-scale storage units.
Latin America Grid-Scale Battery Market Trends:
Latin America sees a growth surge in grid-level battery installations with the help of growing use of renewable power, particularly in solar and wind-rich nations like Brazil, Chile, and Mexico. Governments are now rolling out incentive packages to entice foreign investment in clean energy infrastructure. The market is still in its infancy compared to mature markets, but it will be developed rapidly to help with utility-scale grid stability, peak load management and reduce dependence on fossil-fuel backup system.
Middle East & Africa Grid-Scale Battery Market Trends:
The Middle East & Africa (MEA) region making tentative forays into grid-scale battery systems as part of its transition to diversify the energy mix and incorporate renewables, particularly solar. Nations such as Saudi Arabia and the United Arab Emirates are purchasing big time energy storage as part of their clean energy transition plans. Grid-connected battery storage is also becoming more popular in Africa to firm up unstable power supply in areas of low grid penetration or quality. Adoption may be low but favourable government policies and falling storage costs are expected to deliver strong growth in the coming years.
Grid-Scale Battery Market Highlights:
-
Tesla, Inc.
-
Contemporary Amperex Technology Co., Ltd. (CATL)
-
BYD Company Limited
-
LG Energy Solution
-
Samsung SDI Co., Ltd.
-
Panasonic Corporation
-
Fluence Energy, Inc.
-
NGK Insulators, Ltd.
-
General Electric (GE)
-
ABB Ltd.
-
Saft Groupe S.A.
-
GS Yuasa Corporation
-
Exide Technologies
-
S&C Electric Company
-
Toshiba Corporation
-
VRB Energy
-
Ambri Incorporated
-
Redflow Limited
-
24M Technologies, Inc.
-
KORE Power, Inc.
Grid-Scale Battery Market Competitive Landscape:
24M Technologies, Inc., Founded in 2010 and based in Cambridge, Massachusetts, 24M is the global leader in the development of semi solid-state lithium-ion technology. Its patented SemiSolid process allows production to be scaled and lowers costs, increases energy density, and improves safety. The company operates with an emphasis on grid-scale energy storage, electric mobility, via its global licensing and partnership arrangements.
-
On April 14, 2023, 24M announced that they have received a contract of USD 3.8 million from the United States Advanced Battery Consortium LLC (USABC). This exciting two-year project, with a 50 percent cost share, will be dedicated to the development of an innovative and affordable EV battery technology that enables fast-charging capabilities.
| Report Attributes | Details |
| Market Size in 2025 | USD 14.29 Billion |
| Market Size by 2035 | USD 105.21 Billion |
| CAGR | CAGR of 22.1% From 2026 to 2035 |
| Base Year | 2025 |
| Forecast Period | 2026-2035 |
| Historical Data | 2022-2024 |
| Report Scope & Coverage | Market Size, Segments Analysis, Competitive Landscape, Regional Analysis, DROC & SWOT Analysis, Forecast Outlook |
| Key Segments | • By Type (Lead-acid, Sodium-based, Lithium-ion, Redox Flow, and Others) • By Ownership (Third-Party Owned and Utility Owned) • By Application (Renewables Integration, Ancillary Services, Backup Power, Peak Shifting, and Others) |
| Regional Analysis/Coverage | North America (US, Canada), Europe (Germany, UK, France, Italy, Spain, Russia, Poland, Rest of Europe), Asia Pacific (China, India, Japan, South Korea, Australia, ASEAN Countries, Rest of Asia Pacific), Middle East & Africa (UAE, Saudi Arabia, Qatar, South Africa, Rest of Middle East & Africa), Latin America (Brazil, Argentina, Mexico, Colombia, Rest of Latin America). |
| Company Profiles | Tesla, Inc., Contemporary Amperex Technology Co., Ltd. (CATL), BYD Company Limited, LG Energy Solution, Samsung SDI Co., Ltd., Panasonic Corporation, Fluence Energy, Inc., NGK Insulators, Ltd., General Electric (GE), ABB Ltd., Saft Groupe S.A., GS Yuasa Corporation, Exide Technologies, S&C Electric Company, Toshiba Corporation, VRB Energy, Ambri Incorporated, Redflow Limited, 24M Technologies, Inc., KORE Power, Inc. |
Frequently Asked Questions
The driving factors for the grid-Scale Battery Market are growing demand for renewable energy sources and increasing adoption of electrical vehicles
North America region dominated the Grid-Scale Battery Market.
The major key players in the Grid-Scale Battery Market are NGK Insulators, LTD., Samsung SDI CO., LTD., General Electric, BYD Company Ltd, Ambri Incorporated, VRB Energy, 24M Technologies, Inc., Redflow Limited, KORE Power, Inc., and Lockheed Martin Corporation.
The expected CAGR of the Grid-Scale Battery Market during the forecast period is 22.1%.
The market size of the Grid-Scale Battery Market is valued at USD 14.29 billion in 2025.
Get in Touch
