Renewable Energy Market Report Scope & Overview:
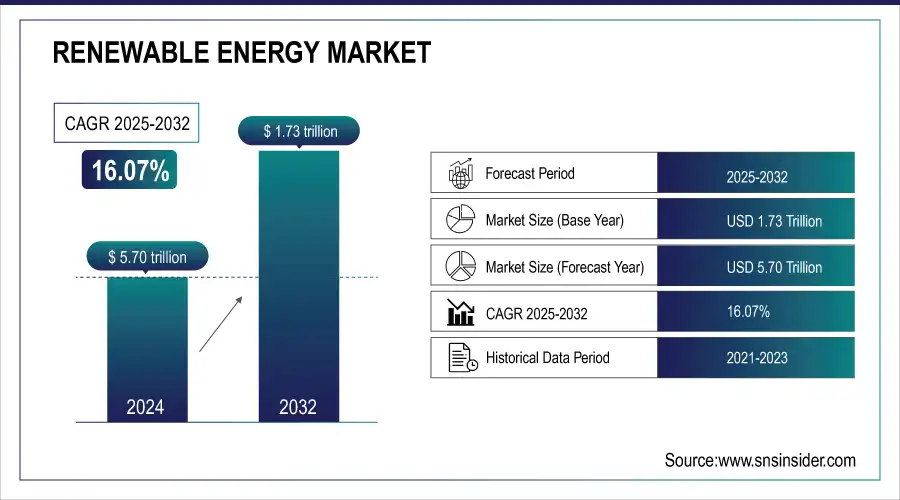
The Renewable Energy Market Size was valued at USD 1.73 Trillion in 2024 and is projected to reach USD 5.70 Trillion by 2032, growing at a compound annual growth rate (CAGR) of 16.07% from 2025 to 2032.
Renewable energy is derived from renewable resources such as wind, water, geothermal heat, and sunlight. Generally, renewable energy is used for heating, cooling, and electricity generation. Renewable energy emits lower emissions than using fossil fuels to generate energy. Renewable energy is also called clean energy as it comes from natural resources or from a process that is continuously replenished from time to time.
To Get More Information on Renewable Energy Market - Request Sample Report
Renewable Energy Market Size and Forecast:
-
Market Size in 2024: USD 1.73 Trillion
-
Market Size by 2032: USD 5.70 Trillion
-
CAGR: 16.07% from 2024 to 2032
-
Base Year: 2024
-
Forecast Period: 2025–2032
-
Historical Data: 2021–2023
Renewable energy is mostly part of new inventions or technology which harness nature’s power for various purposes like heating, lighting, transportation, and many more. As the market grows significantly there is an increase in job opportunities to develop and install renewable energy sources.
Renewable Energy Market Highlights:
-
Rising environmental concerns due to urbanization, economic growth, and reliance on fossil fuels are driving adoption of renewable energy solutions
-
High initial investments for building renewable energy projects create financial challenges and long payback periods
-
Growing investments from governments, private companies, and financial institutions in solar, wind, hydro, and other renewables are accelerating market growth
-
Technological advancements and declining costs are enhancing efficiency and adoption of renewable energy systems
-
Supportive policies, subsidies, tax incentives, and renewable energy targets are fostering global market expansion
-
Sustainability and ESG-focused initiatives, including green bonds and public-private partnerships, are supporting a low-carbon and resilient energy future
Renewable Energy Market Drivers:
-
Increasing environmental concern regarding urbanization, economic growth, and fossil fuels.
Increasing environmental concern is becoming a major driver in shaping urban development and energy policies worldwide. Rapid urbanization and economic growth have led to higher energy consumption, greater industrial activity, and escalating greenhouse gas emissions, which put significant pressure on natural resources and the environment. The continued reliance on fossil fuels contributes to air pollution, climate change, and ecological degradation, prompting governments, industries, and consumers to seek sustainable alternatives. As a result, there is a growing focus on renewable energy adoption, energy-efficient technologies, and sustainable urban planning. This trend is influencing investments in clean energy infrastructure, policy reforms, and public awareness initiatives, aiming to balance economic growth with environmental sustainability while reducing carbon footprints and promoting greener, more resilient cities.
Renewable Energy Market Restraints:
-
Large initial investment to build infrastructure
One of the major challenges in developing large-scale infrastructure projects is the requirement for substantial initial investments. Building infrastructure, whether for energy, transportation, or urban development, demands significant capital outlay for land acquisition, equipment, construction, and technology deployment. High upfront costs can strain budgets, limit financial flexibility, and pose risks for investors, especially in emerging markets. Additionally, the long payback period associated with such projects can deter private funding and slow down implementation. Despite potential long-term economic and social benefits, the need for heavy initial investment remains a critical restraint, often requiring government support, public-private partnerships, or innovative financing solutions to ensure project viability and sustainability.
Renewable Energy Market Opportunities:
-
Increasing investment in renewable energy sources
The growing focus on sustainable development and climate change mitigation has led to a significant increase in investments in renewable energy sources. Governments, private companies, and financial institutions are allocating capital to solar, wind, hydro, and other clean energy projects to reduce greenhouse gas emissions and dependence on fossil fuels. Technological advancements, declining costs of renewable systems, and supportive policies such as subsidies, tax incentives, and renewable energy targets are driving this trend. Investment in utility-scale and distributed energy projects fosters innovation, creates jobs, and enhances energy security. Additionally, ESG-focused investors are increasingly funding renewable initiatives, while green bonds and public-private partnerships facilitate financial support, collectively accelerating the global transition toward a low-carbon, sustainable, and resilient energy future.
Renewable Energy Market Segment Analysis:
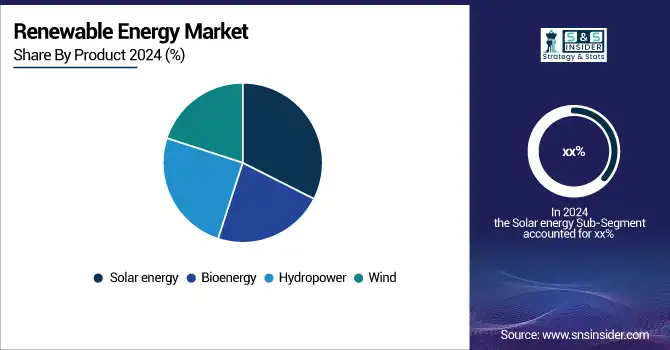
By Product
Solar energy is currently both the dominating and fastest-growing segment, driven by declining costs, technological advancements, and its ability to be deployed at residential, commercial, and utility scales. Solar installations are rapidly expanding in regions such as Asia-Pacific, North America, and Europe, contributing significantly to new renewable capacity additions. Wind energy is also a major contributor, particularly offshore wind in Europe and Asia, but its growth, while strong, is slightly slower than solar. Hydropower, although historically the largest in total installed capacity, is experiencing slower growth due to limited suitable sites, while bioenergy continues to grow steadily but at a more modest pace compared with solar and wind.
By Application
The industrial segment currently dominates due to high-energy demand from manufacturing, processing, and large-scale operations. However, the residential segment is the fastest-growing, driven by the adoption of rooftop solar systems, home energy storage solutions, and increasing awareness of sustainable energy practices among households. The commercial segment, which includes offices, retail spaces, and public buildings, is also expanding steadily as businesses implement renewable solutions to reduce operational costs and meet sustainability goals, but its growth is slower compared with residential applications. Overall, industrial usage leads in total consumption, while residential adoption is driving the fastest growth in the renewable energy sector.
Renewable Energy Market Regional Analysis:
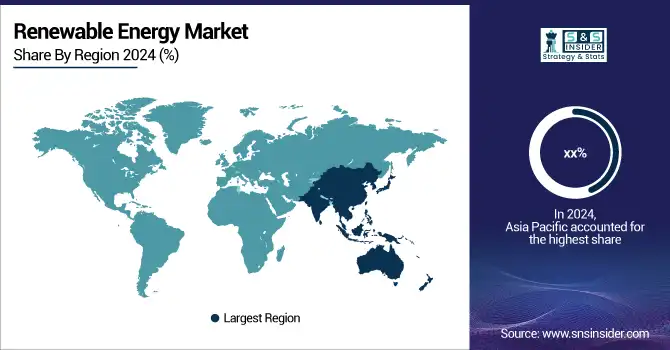
Asia-Pacific Renewable Energy Market Trends:
The Asia Pacific region dominated the market with the largest market share in 2024. The rising demand for renewable energy increases the utilization of solar power in countries like India and China. These countries are dominating the overall global market of solar panel projects. Increasing investment in solar power installation projects leads to propelling the market in countries like Australia and Japan.
Do You Need any Customization Research on Renewable Energy Market - Enquire Now
North America Renewable Energy Market Trends:
North America is expected to experience a substantial Compound Annual Growth Rate (CAGR) during the forecast period. This growth can be attributed to the growing concern over the deteriorating environmental conditions, which has led to a shift in people's focus towards renewable energy sources. The increasing investment in renewable energy and the government's initiatives to reduce carbon footprint are the primary drivers of the North American market. Renewable energy has a crucial role to play in ensuring energy security in the United States and reducing greenhouse gas emissions. By utilizing renewable energy sources, the country can reduce its dependence on energy imports and decrease the use of fossil fuels, which is currently the largest source of energy in the US.
Europe Renewable Energy Market Trends:
Europe is witnessing significant growth in the renewable energy market, driven by stringent environmental regulations and ambitious carbon neutrality goals set by the European Union. Countries such as Germany, the United Kingdom, and France are leading the deployment of wind and solar energy projects. Government incentives, subsidies, and policy frameworks promoting clean energy adoption are fueling investments in both utility-scale and distributed renewable projects. The increasing focus on energy efficiency, coupled with technological advancements in renewable energy systems, is accelerating market growth. Additionally, the region is witnessing rapid adoption of offshore wind and energy storage solutions, which are enhancing grid stability and supporting the transition toward a low-carbon economy.
Latin America Renewable Energy Market Trends:
Latin America is gradually expanding its renewable energy capacity, with Brazil, Mexico, and Chile emerging as key markets. The region benefits from abundant natural resources, including sunlight, wind, and hydropower potential, which are being leveraged to meet growing energy demand sustainably. Government support, international investments, and favorable regulatory policies are encouraging large-scale solar, wind, and hydropower projects. Additionally, the increasing industrial and commercial demand for clean energy solutions is propelling the market, while initiatives to reduce reliance on fossil fuels are further driving the adoption of renewable technologies.
Middle East & Africa Renewable Energy Market Trends:
The Middle East & Africa region is witnessing rising interest in renewable energy, primarily driven by the need to diversify energy sources and reduce dependence on fossil fuels. Countries such as the United Arab Emirates, Saudi Arabia, and South Africa are investing heavily in solar and wind energy projects. Large-scale solar parks, concentrated solar power (CSP) projects, and government-led initiatives to promote sustainable energy are boosting market growth. Furthermore, international partnerships and funding for renewable energy infrastructure are accelerating the deployment of clean energy solutions, while the increasing energy demand from residential, industrial, and commercial sectors is supporting long-term market expansion.
Renewable Energy Market Key Players:
-
ABB
-
Acciona Energía
-
Enel Spa
-
General Electric (GE Renewable Energy)
-
Innergex
-
Invenergy
-
Schneider Electric
-
Siemens Gamesa Renewable Energy S.A.
-
Suzlon Energy Ltd.
-
Tata Power Renewable Energy
-
Xcel Energy, Inc.
-
Vestas Wind Systems A/S
-
Ørsted A/S
-
Brookfield Renewable Partners
-
NextEra Energy, Inc.
-
EDP Renováveis S.A.
-
RWE Renewables
-
Iberdrola S.A.
-
Canadian Solar Inc.
-
First Solar, Inc.
Renewable Energy Market Competitive Landscape:
Enel is a multinational energy company and a global leader in renewable energy generation and distribution. Operating across more than 30 countries, Enel focuses on sustainable energy solutions, including wind, solar, hydro, and geothermal power. The company is committed to decarbonization, digital innovation, and expanding clean energy infrastructure to meet growing global energy demand responsibly.
- In May 2035 Enel has signed a swap agreement with Gulf Pacific Power to increase its consolidated renewable capacity in the US by 285 MW through operational wind farm acquisitions. The transaction aligns with Enel’s strategy to expand renewable generation, enhancing its net installed capacity to 11,620 MW and supporting sustainable growth in the US market.
ABB is a global technology leader specializing in electrification, robotics, automation, and renewable energy solutions. The company provides innovative products and services that enhance energy efficiency, reliability, and sustainability for industrial, commercial, and utility clients worldwide. ABB is committed to driving the transition to a low-carbon future.
- In Sept 2025, ABB engineers swiftly restored 110 MW of renewable energy at the Nasulo geothermal plant in the Philippines within 48 hours after a severe tropical storm caused a complete shutdown, preventing daily losses exceeding PHP 15 million. The rapid response highlights ABB’s commitment to ensuring uninterrupted sustainable power during emergencies.
| Report Attributes | Details |
| Market Size in 2024 | USD 1.73 Trillion |
| Market Size by 2032 | USD 5.70 Trillion |
| CAGR | CAGR of 16.07% From 2024 to 2032 |
| Base Year | 2024 |
| Forecast Period | 2025-2032 |
| Historical Data | 2021-2023 |
| Report Scope & Coverage | Market Size, Segments Analysis, Competitive Landscape, Regional Analysis, DROC & SWOT Analysis, Forecast Outlook |
| Key Segments | • By Product (Hydropower, Wind, Solar, Bioenergy) • By Application (Industrial, Residential, Commercial) |
| Regional Analysis/Coverage | North America (US, Canada), Europe (Germany, UK, France, Italy, Spain, Russia, Poland, Rest of Europe), Asia Pacific (China, India, Japan, South Korea, Australia, ASEAN Countries, Rest of Asia Pacific), Middle East & Africa (UAE, Saudi Arabia, Qatar, South Africa, Rest of Middle East & Africa), Latin America (Brazil, Argentina, Mexico, Colombia, Rest of Latin America). |
| Company Profiles | ABB, Acciona Energía, Enel Spa, General Electric (GE Renewable Energy), Innergex, Invenergy, Schneider Electric, Siemens Gamesa Renewable Energy S.A., Suzlon Energy Ltd., Tata Power Renewable Energy, Xcel Energy, Inc., Vestas Wind Systems A/S, Ørsted A/S, Brookfield Renewable Partners, NextEra Energy, Inc., EDP Renováveis S.A., RWE Renewables, Iberdrola S.A., Canadian Solar Inc., First Solar, Inc. |
Frequently Asked Questions
Increasing environmental concern regarding urbanization, economic growth, and fossil fuels., Increasing R&D in technologies, Rising awareness regarding the harmful effects of fossil fuels on the environment, Rising adoption of green energy consumption, Stringent government regulations regarding emissions.
Asia Pacific region dominated the Renewable Energy Market.
The major key players are ABB, Acconia Energía, Enel Spa, General Electric, Innergex, Invenergy, Schneider Electric, Siemens Gamesa Renewable Energy, S.A., Suzlon Energy Ltd., Tata Power, Xcel Energy, Inc.
The market size of the Renewable Energy Market is USD 1.73 trillion in 2024.
The expected CAGR of the global Renewable Energy Market during the forecast period is 16.07%.
Get in Touch
