High Side Current Sense Amplifiers Market Size Analysis:
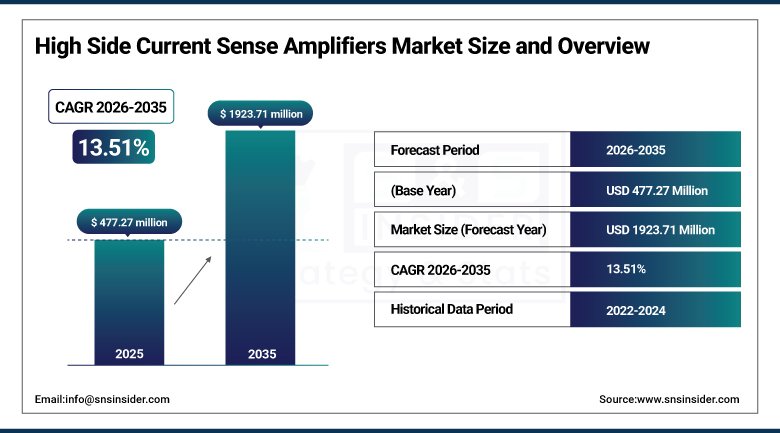
The High Side Current Sense Amplifiers Market size was valued at USD 477.27 million in 2025 and is expected to reach USD 1923.71 million by 2035, growing at a CAGR of 13.51% over the forecast period of 2026-2035.
High Side Current Sense Amplifiers Market trends are driven by rising demand for accurate current monitoring in EVs, industrial systems, and battery management. Integration of compact, high-voltage, low-power designs is accelerating.
The global High Side Current Sense Amplifiers market is expected to grow owing to the deployment of high side current sense amplifiers in renewable energy systems, telecom power supplies & smart home appliances in which efficient current monitoring is required. Demand for durable, high-side sensing is also driven by the trend toward electrification of railways and heavy machinery. Progress in high-speed amplifiers with ultra-high EMI immunity is also helping these technologies gain wider utilization in high-frequency switching power supply designs for industrial and defense applications.
Market Size and Forecast:
-
Market Size in 2025 USD 477.27 Million
-
Market Size by 2035 USD 1923.71 Million
-
CAGR of 13.51% From 2026 to 2035
-
Base Year 2025
-
Forecast Period 2026-2035
-
Historical Data 2022-2024
To Get More Information On High Side Current Sense Amplifiers Market - Request Free Sample Report
High Side Current Sense Amplifiers Market Trends:
• Rapid electrification of vehicles increases demand for accurate high side current monitoring in battery and powertrain systems
• Expansion of renewable energy installations drives adoption of current sense amplifiers in inverters converters and smart grids
• Industry 4.0 and factory automation boost use of EMI resistant precision current sensing in robotics and motor control
• Growth of edge computing deployments raises need for localized power monitoring and thermal management ICs
• Rising use of advanced battery management systems accelerates demand for high accuracy high voltage current sensing solutions.
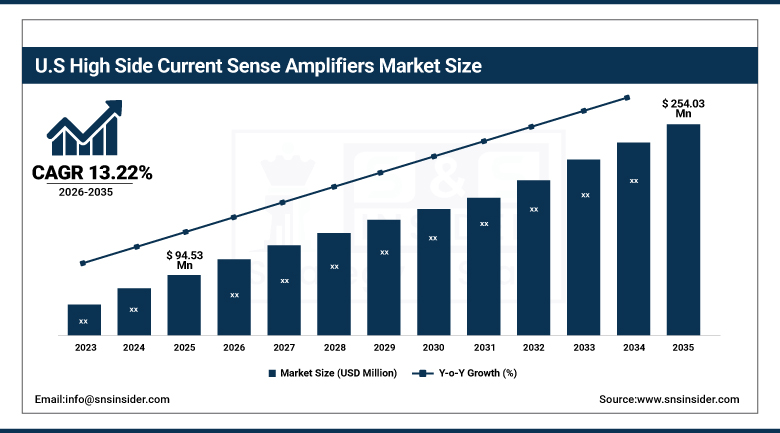
The U.S. High Side Current Sense Amplifiers Market size is estimated to be valued at USD 94.53 million in 2025 and is projected to grow at a CAGR of 13.22%, reaching USD 254.03 million by 2035. The U.S. High Side Current Sense Amplifiers Market growth is driven by demand in various EV applications, smart grid infrastructure modernization, various industrial automation, and defense systems applications that demand highly accurate and high-voltage current monitoring for precision current sensing solutions.
High Side Current Sense Amplifiers Market Growth Drivers:
-
Rising Demand for Precision Analog Chips Driven by Automotive Industrial and 5G Communication Advancements
Growing demand for precise current detection in high-voltage applications across automotive, industrial and energy verticals are the major factors driving the global High Side Current Sense Amplifiers market. That's driven demand for reliable, high-side sensing solutions, particularly as the world moves toward electric vehicles, smart grids and renewable energy systems such as wind and solar. Other long-term growth drivers include factory automation, robotics and power management applications where these EMI resistant amplifiers also provide high isolation and accuracy in the presence of a noisy environment.
-
Global installed capacity for wind and solar energy hit 3,500 GW in 2025, with high-side sensing used in inverters, charge controllers, and smart metering infrastructure.
High Side Current Sense Amplifiers Market Restraints:
-
Analog IC Design Complexity Limits Growth Due to High Reliability Demands and Lengthy Development Cycles
Complexity of Circuit Design and Integration High-side current sense amplifiers usually have a higher complexity of circuit design and integration especially in the case of high-voltage and high-speed applications. These amplifiers are difficult to implement as they require certain throwing techniques to keep consistent; this can be hard for an inexperienced design team to execute successfully with little design access. Moreover, industry shifts to mixed-signal platforms are hindered by the acute shortage of analog engineers, which prolongs development cycles.
High Side Current Sense Amplifiers Market Opportunities:
-
Emerging Applications and Technological Advancements Drive Growth in Signal Acquisition and Custom Analog IC Development
Opportunities are emerging due to the adoption of high-side amplifiers in decades most critical applications, which include next-generation battery management systems, energy storage units, and edge computing devices. Long-term growth drivers include greater adoption of Industry 4.0 technologies, increasing electrification of public transport, and defence-grade power systems.
-
More than 3.2 billion edge computing devices are in active use as of 2025, many deployed in smart factories and surveillance systems where current monitoring ICs help manage localized power usage and thermal load.
High Side Current Sense Amplifiers Market Segment Analysis:
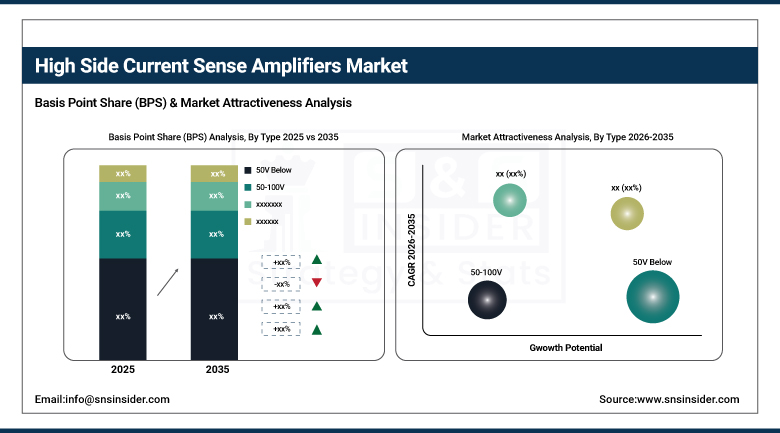
By Type
By 2025, the 50V Below segment is the largest contributor to the overall High Side Current Sense Amplifiers market at approximately 42.6% share of the global market. This dominance is due to its extensive utilization in low-voltage applications, including consumer electronics, portable devices, wearables, and low-power industrial systems. These amplifiers are in demand due to their small size, low power consumption and easy integration in battery based products and IoT based products. During the forecast period from 2026 to 2035, the 100V Above segment is expected to grow with the highest CAGR, due to the increasing utilization of high-voltage systems in applications such as electric vehicles, renewable energy inverters, and industrial power equipment. Such amplifiers help maintain safety, accuracy, and dependability in high-current, and high-voltage application environments.
By Application
The Industrial segment led the global High Side Current Sense Amplifiers market share with approximately 45.5% share in 2025. This reign is fueled by its extensive adoption in motor control, robotics, factory automation, PLCs, and power management systems, among other applications. The basic structure of these amplifiers allows real-time current data acquisition, fault detection and Classification, energy efficiency, and other unique and important features for HR industrial environments. This high EMI immunity and precision makes them the perfect choice for use in factory settings that are often noisy. The Automotive segment is projected to dominate the growth at fastest CAGR during 2026 to 2035 owing to the global shift from ICE to EVs, introduction of advanced driver-assistance systems (ADAS), on-board chargers. High-side current sense amplifiers are important components for battery management systems, powertrain monitoring, and safety-critical electronic systems.
High Side Current Sense Amplifiers Market Regional Analysis:
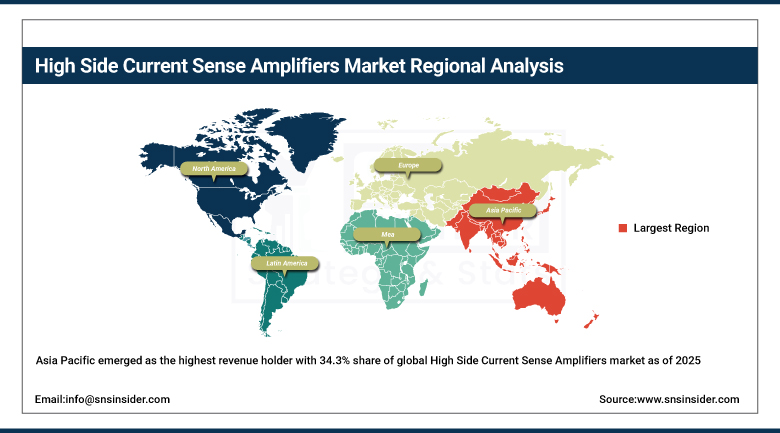
Asia Pacific High Side Current Sense Amplifiers Market Insights
The Asia Pacific emerged as the highest revenue holder with 34.3% share of global High Side Current Sense Amplifiers market as of 2025 and is projected to grow at the fastest CAGR of 14.30% over the forecast period of 2026-2035. The robust regional growth is attributed to industrialization, growing requirements for electric vehicles, and rising consumer electronics manufacturing in countries such as China, Japan, South Korea, and India. The area is a global heart for semiconductor manufacturing and electronics meeting, resulting in high-side current sense amplifiers gain widespread deployment in automotive, industrial, and renewable energy purposes. Some of the government policies aimed at clean energy, EV infrastructure, and smart manufacturing are increasing the demand for efficient current monitoring technologies. As these amplifiers find application across several high-end, high-reliability systems, local OEMs and EMS providers, too, are stepping up the deployment of these systems to gain performance safety across numerous end-use sectors. With a strong manufacturing and sales base for EVs, extensive industrial automation, and a significant foothold in consumer electronics production, China accounted for the largest share of the Asia Pacific High Side Current Sense Amplifiers market.
Get Customized Report as Per Your Business Requirement - Enquiry Now
North America High Side Current Sense Amplifiers Market Insights
The North America High Side Current Sense Amplifiers Market is growing steadily owing to the growing entry into electric vehicles, aerospace, and smart industrial systems. Robust R&D infrastructure, early adoption of technology, and dominance by leading semiconductor players in the region further contributes to the positive growth of this sector. Improved demand is also supported by growing funding for eco-friendly energy infrastructure and defense applications. Moreover, further market computations are undertaken by the integration of high-precision current sensing solution sets in a multitude of energy-efficient systems within industrial automation and grid modernization projects.
The U.S. led the North America market, accounting for more than 73% of total sales, owing to high demand for automotive and industrial high-reliability current sensing, alongside the presence of advanced automotive electronics technologies in the region.
Europe High Side Current Sense Amplifiers Market Insights
Continued progress in electric mobility, industrial automation, and renewable energy deployment are all factors supporting the Europe High Side Current Sense Amplifiers market. Applications such as EV powertrains, solar inverters, and robotics in these regions demonstrate a strong takeaway of precision analog components. Decrease emphasis on energy efficiency, carbon neutrality, and regulatory standard-stringency compliance is fueling high-side current sensing as a smart grid and power electronics driver. Moreover, established automotive and industrial OEMs ensure continuous demand for high-performance sensing solutions.
Latin America (LATAM) and Middle East & Africa (MEA) High Side Current Sense Amplifiers Market Insights
Gradual growth of high side current sense amplifiers in Latin America and Middle East & Africa is expected during the forecast period, particularly due to the emerging industrial automation segment, renewable energy projects, and telecom infrastructure expansion in these regions. The growing demand for Latin America is driven by the rapid adoption of smart energy systems and electric public transport. At the same time, modernization of power distribution networks and solar energy solution deployments across the Middle East & Africa region require the reliable high-side current sensing for monitoring, efficiency and protection for high-voltage systems.
High Side Current Sense Amplifiers Market Key Players:
The major players High Side Current Sense Amplifiers Market include Texas Instruments, Analog Devices, ROHM, STMicroelectronics, Infineon, Diodes Inc., Allegro MicroSystems, Maxim Integrated, Nisshinbo Micro Devices, and New Japan Radio.
Competitive Landscape for High Side Current Sense Amplifiers Market:
Texas Instruments is a leading supplier of high side current sense amplifiers, offering precision, low offset, and wide common-mode voltage solutions for automotive, industrial, and power management applications. Its devices support EV powertrains, battery management systems, motor drives, and renewable energy systems requiring accurate and reliable current monitoring.
-
In February 2025, Texas Instruments launched the INA790B, a bidirectional high-side amplifier with enhanced PWM-rejection, ideal for noisy power environments.
ROHM Semiconductor is a key provider of high side current sense amplifiers, delivering high-accuracy, low-noise, and wide-voltage solutions for automotive, industrial, and energy applications. Its portfolio supports EV battery management, power supplies, motor control, and renewable energy systems requiring stable and precise current monitoring.
-
In June 2025, ROHM Semiconductor unveiled automotive-qualified BD1423xFVJ‑C (up to 80 V) and BD1422xG‑C (up to 40 V) high‑accuracy current sense amplifiers.
| Report Attributes | Details |
|---|---|
| Market Size in 2025 | USD 477.27 Million |
| Market Size by 2035 | USD 1923.71 Million |
| CAGR | CAGR of 13.51% From 2026 to 2035 |
| Base Year | 2025 |
| Forecast Period | 2026-2035 |
| Historical Data | 2022-2024 |
| Report Scope & Coverage | Market Size, Segments Analysis, Competitive Landscape, Regional Analysis, DROC & SWOT Analysis, Forecast Outlook |
| Key Segments | • By Type (50V Below, 50-100V and 100V Above) • By Application (Industrial, Automotive and Others) |
| Regional Analysis/Coverage | North America (US, Canada), Europe (Germany, UK, France, Italy, Spain, Russia, Poland, Rest of Europe), Asia Pacific (China, India, Japan, South Korea, Australia, ASEAN Countries, Rest of Asia Pacific), Middle East & Africa (UAE, Saudi Arabia, Qatar, South Africa, Rest of Middle East & Africa), Latin America (Brazil, Argentina, Mexico, Colombia, Rest of Latin America). |
| Company Profiles | Texas Instruments, Analog Devices, ROHM, STMicroelectronics, Infineon, Diodes Inc., Allegro MicroSystems, Maxim Integrated, Nisshinbo Micro Devices, and New Japan Radio. |
Frequently Asked Questions
Ans: Asia Pacific dominated the High Side Current Sense Amplifiers Market in 2025.
Ans: The 50V Below segment dominated the High Side Current Sense Amplifiers Market in 2025.
Ans: The major growth factor of the High Side Current Sense Amplifiers Market is the rising demand for precise current monitoring in electric vehicles, industrial automation, and battery management systems.
Ans: The High Side Current Sense Amplifiers Market size was valued at USD 477.27 million in 2025 and is expected to reach USD 1923.71 million by 2035, growing at a CAGR of 13.51% over the forecast period of 2026-2035.
Ans: The High Side Current Sense Amplifiers Market is expected to grow at a CAGR of 13.51% from 2026-2035.
Get in Touch
