Get More Information on Human Machine Interface Market - Request Sample Report
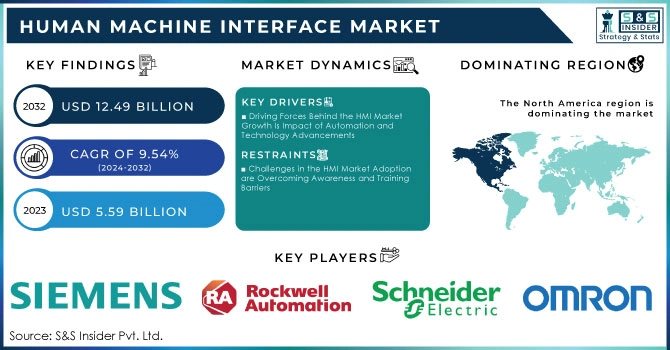
The Human Machine Interface Market Size was valued at USD 5.59 Billion in 2023 and is expected to reach USD 12.49 Billion by 2032 and grow at a CAGR of 9.54% over the forecast period 2024-2032.
The Human Machine interface market is growing due to automation in various industries. Needing to improve efficiency and reduce operational costs, businesses are embracing advanced HMI solutions that enable operators to communicate with machines seamlessly. This trend has become more and more pronounced in manufacturing, automotive, and healthcare sectors wherein HMI plays a critical role in monitoring and controlling quite complex processes. Technological advancements are also giving a much-needed boost to HMIs with the assistance of IoT and artificial intelligence. HMI devices today, for instance, come embedded with touchscreens, voice recognition, and gesture control and focus on being intuitive and user-friendly devices that can improve productivity and safety in organizations.
The industry has witnessed several technology upgrades, from the indication of Light Emitting Diode (LED) to fully functional touchscreen and graphics-oriented terminals. The products equipped with Bluetooth and Wi-Fi have improved device mobility. This trend is expected to drive demand in the forecast period as well. With huge growth prospects, rising demand for high-resolution screens to analyze processes properly sustains growth. Add to that is the continuous updating and up-gradation of computer processors, which would come to replace the traditional systems, thereby augmenting the demand for products. With advancements in broadband access technology, it is expected to open immense growth opportunities during the next seven years. Global smartphone shipments were 1.14 billion units, primarily touch-enabled. Compared with shipments in 2022, sales were 4% lower. The sales leader was Apple at 229.2 million units, followed by Samsung at 225.4 million units. These sales emphasize the adoption of human-machine interface technologies such as touch functionality in mobile handsets and highlight their use in everyday interactions
Key Drivers:
Driving Forces Behind the HMI Market Growth Is Impact of Automation and Technology Advancements
The need for automation in most industries is the primary driver of the HMI market. Most businesses seek how they can improve efficiency, reduce the costs of operations, and increase productivity. It is these primary factors that drive businesses toward automated solutions, in which HMIs are critical tools enabling operators to monitor and control complex machinery and processes with ease. Advanced HMI systems are more or less an integration necessity in sectors such as manufacturing, automotive, and healthcare, where precision and reliability are cardinal. Such a shift towards automation is not only streamlining operations but also helping companies respond rapidly to market demands and hold their own in the competition. Technological advancements are hugely influencing the functionality and user experience of HMI systems and are fast gaining ground.
Transforming HMIs Through Cutting-Edge Technologies and the Rise of Intuitive Interfaces and Data Analytic.
The innovations regarding the Internet of Things (IoT), artificial intelligence, and data visualization are allowing traditional HMIs to be transformed into sophisticated user-friendly interfaces. Modern HMI incorporates intuitive touch screens, voice recognition, and gesture control. Interactions are now seamless and efficient. Moreover, the growing emphasis on data analytics provides a clear view of real-time information and insight for decision-making purposes. As industries continue embracing these technological advancements, advanced HMI solutions that allow for high-level performance at reduced costs will be in demand and driving the market forward.
Restrain:
Challenges in the HMI Market Adoption are Overcoming Awareness and Training Barriers
The main restraint exerted on the market of Human Machine Interface is the lack of awareness among potential users about HMI technologies, and many organizations do not have proper knowledge regarding the implementation and usage of advanced HMI systems, resulting in reluctance towards adopting new technologies. Moreover, specific training for the operators may discourage companies from investing in HMI solutions as the process will be perceived to be costly. Awareness and training disparity is one of those gaps that slow the widespread adoption of HMI technologies leading to slowed market growth in most industries.
By Product
The interface software segment held the highest share of 39.87% in the market in 2023. Interface software is largely used to interchange information between different computer system components. Betterment in the application development process may lead to the diminishment of the size of applications and speeds of computing.
The display segment is expected to register the largest CAGR of 11.08% during the forecast period. Industrial automation systems make heavy use of display terminals and interface software. The technological progress changed from the traditional Cathode Ray Tube (CRT)-based video terminals to innovative TFT-based capacitive displays. Apart from the capacitive display, LED and LCD-based UHD displays are also likely to serve as avenues for industry growth.
By Application
The automotive segment remained the largest with 51.56% revenue market share in 2023. Of course, the car showroom has also remodeled the layout of the car dashboard as well into a more flexible, dynamic, and adaptive design due to advanced technology. Standalone systems might increase safety risks, but in an integrated form with HMIs, speech input/output may reduce driver distraction when commanding vehicles and speed up the growth of this industry.
The oil and gas segment industry is expected to expand at a healthy CAGR of 11.17% in the forecasting period. HMIs for this industry are developing quickly to provide more advanced data visualization and analytics capabilities. Advanced HMIs help operators view, understand, and interpret huge amounts of complex data while tracking critical key performance metrics. They also allow real-time identification of patterns or anomalies within data, thus supporting data-driven decision-making and optimizing operational performance.
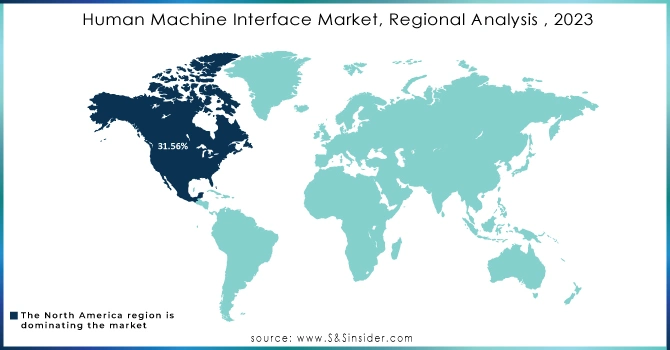
North America held the largest market share of 31.56% in the base year, primarily because technology had been adopted much earlier. The number of automation projects is also likely to rise and will have a great influence on regional demand in the forecast period. Industrial base diversified and strong manufacturing, auto, aerospace, energy, and health service sectors are present in the region. Such industries need highly sophisticated Human Machine Interfaces to rationalize their processes, increase productivity, and enhance the user experience. This reason therefore makes North America remain one of the primary markets for HMI solutions.
The Asia-Pacific region is expected to experience the highest CAGR of 10.50% during the forecast period. The rapid industrialization in this region works as a major growth driver for the HMI market. Besides, the raw materials are abundantly available and there exists a low-cost labor force in the region, which in turn fuels the demand for HMI solutions. This marks a harbinger for the Asia-Pacific region to become one of the main drivers in the expansion of the HMI market.
Need Any Customization Research On Human Machine Interface Market - Inquiry Now
Some of the major players in the Human Machine Interface Market are:
Siemens (SIMATIC HMI, WinCC),
Rockwell Automation (FactoryTalk View, Allen-Bradley),
Schneider Electric (Magelis HMI, EcoStruxure),
Mitsubishi Electric (GT Works3, GOT2000),
Honeywell (Experion HMI, Process Solutions),
Yokogawa Electric (ProSafe HMI, Stardom),
ABB (Ability HMI, Control System),
Omron (NS Series, FQ-M Series),
GE Digital (iFIX, Proficy HMI/SCADA),
Beckhoff Automation (TwinCAT HMI, CP Series),
Advantech (WebAccess HMI, ADAM Series),
B&R Industrial Automation (APROL HMI, Automation Studio),
Delta Electronics (DOP Series, WPLSoft),
KUKA (KUKA SmartPAD, KUKA.VisionTech),
Inductive Automation (Ignition, Vision Module),
Phoenix Contact (Visual Control, ILC Series),
CODESYS (CODESYS Visualization, CODESYS HMI),
Siemens AG (Siemens S7-1200 HMI, SIMATIC Comfort Panels),
Pro-face (GP Series, LT Series),
Weintek (MT8000 Series, cMT Series)
In July 2024, Mouser Electronics, Inc., a global leading authorized distributor of the newest semiconductors and electronic components as well as industrial automation products, announced the latest installment of its Empowering Innovation Together (EIT) technology series.
In Sep 2024, EAO stands out as a specialized supplier for railway applications –the company product portfolio encompasses complex HMI systems that support from project initiation to implementation with comprehensive advice and technical expertise.
In August 2024, A new brain-computer interface (BCI) developed at UC Davis Health translates brain signals into speech with up to 97% accuracy — the most accurate system of its kind.
Report Attributes | Details |
---|---|
Market Size in 2023 | USD 5.59 Billion |
Market Size by 2032 | USD 12.49 Billion |
CAGR | CAGR of 9.38% From 2024 to 2032 |
Base Year | 2023 |
Forecast Period | 2024-2032 |
Historical Data | 2020-2022 |
Report Scope & Coverage | Market Size, Segments Analysis, Competitive Landscape, Regional Analysis, DROC & SWOT Analysis, Forecast Outlook |
Key Segments | • By Product (Display Terminals, Interface Software, Industrial PCs, Others), • By Application (Automotive, Food and Beverages, Oil and Gas, Packaging, Others) |
Regional Analysis/Coverage | North America (US, Canada, Mexico), Europe (Eastern Europe [Poland, Romania, Hungary, Turkey, Rest of Eastern Europe] Western Europe] Germany, France, UK, Italy, Spain, Netherlands, Switzerland, Austria, Rest of Western Europe]), Asia Pacific (China, India, Japan, South Korea, Vietnam, Singapore, Australia, Rest of Asia Pacific), Middle East & Africa (Middle East [UAE, Egypt, Saudi Arabia, Qatar, Rest of Middle East], Africa [Nigeria, South Africa, Rest of Africa], Latin America (Brazil, Argentina, Colombia, Rest of Latin America) |
Company Profiles | Siemens, Rockwell Automation, Schneider Electric, Mitsubishi Electric, Honeywell, Yokogawa Electric, ABB, Omron, GE Digital, Beckhoff Automation, Advantech, B&R Industrial Automation, Delta Electronics, KUKA, Inductive Automation, Phoenix Contact, CODESYS, Pro-face, Weintek |
Key Drivers | • Driving Forces Behind the HMI Market Growth Is Impact of Automation and Technology Advancements • Transforming HMIs Through Cutting-Edge Technologies and the Rise of Intuitive Interfaces and Data Analytic. |
RESTRAINTS | • Challenges in the HMI Market Adoption are Overcoming Awareness and Training Barriers |
Ans: The Human Machine Interface Market is expected to grow at a CAGR of 9.38% during 2024-2032.
Ans: Human Machine Interface Market size was USD 5.59 billion in 2023 and is expected to Reach USD 12.49 billion by 2032.
Ans: The major growth factor of the Human Machine Interface (HMI) market is the increasing demand for automation and control in various industries, driven by advancements in technology and the need for improved operational efficiency.
Ans: The Interface Software segment dominated the Human Machine Interface Market in 2023.
Ans: NORTH AMERICA dominated the Human Machine Interface Market in 2023.
Table of Content
1. Introduction
1.1 Market Definition
1.2 Scope (Inclusion and Exclusions)
1.3 Research Assumptions
2. Executive Summary
2.1 Market Overview
2.2 Regional Synopsis
2.3 Competitive Summary
3. Research Methodology
3.1 Top-Down Approach
3.2 Bottom-up Approach
3.3. Data Validation
3.4 Primary Interviews
4. Market Dynamics Impact Analysis
4.1 Market Driving Factors Analysis
4.1.1 Drivers
4.1.2 Restraints
4.1.3 Opportunities
4.1.4 Challenges
4.2 PESTLE Analysis
4.3 Porter’s Five Forces Model
5. Statistical Insights and Trends Reporting
5.1 Human Machine Interface Competitive Landscape (2023)
5.2 Human Machine Interface End-User Analysis (2023)
5.3 Human Machine Interface Product Adoption Rates
5.4 Human Machine Interface Technological Trends
5.5 Supply Chain Dynamics
6. Competitive Landscape
6.1 List of Major Companies, By Region
6.2 Market Share Analysis, By Region
6.3 Product Benchmarking
6.3.1 Product specifications and features
6.3.2 Pricing
6.4 Strategic Initiatives
6.4.1 Marketing and promotional activities
6.4.2 Distribution and Supply Chain Strategies
6.4.3 Expansion plans and new product launches
6.4.4 Strategic partnerships and collaborations
6.5 Technological Advancements
6.6 Market Positioning and Branding
7. Human Machine Interface Market Segmentation, by Product
7.1 Chapter Overview
7.2 Display Terminals
7.2.1 Display Terminals Market Trends Analysis (2020-2032)
7.2.2 Display Terminals Size Estimates and Forecasts to 2032 (USD Million)
7.3 Interface Software
7.3.1 Interface Software Market Trends Analysis (2020-2032)
7.3.2 Interface Software Market Size Estimates and Forecasts to 2032 (USD Million)
7.4 Industrial PCs
7.4.1 Industrial PCs Market Trends Analysis (2020-2032)
7.4.2 Industrial PCs Market Size Estimates and Forecasts to 2032 (USD Million)
7.5 Other
7.5.1 Other Market Trends Analysis (2020-2032)
7.5.2 Other Market Size Estimates and Forecasts to 2032 (USD Million)
8. Human Machine Interface Market Segmentation, by Application
8.1 Chapter Overview
8.2 Automotive
8.2.1 Automotive Market Trends Analysis (2020-2032)
8.2.2 Automotive Market Size Estimates and Forecasts to 2032 (USD Billion)
8.3 Food and Beverages
8.3.1 Food and Beverages Market Trends Analysis (2020-2032)
8.3.2 Food and Beverages Market Size Estimates and Forecasts to 2032 (USD Billion)
8.4 Oil and Gas
8.4.1 Oil and Gas Market Trends Analysis (2020-2032)
8.4.2 Oil and Gas Market Size Estimates and Forecasts to 2032 (USD Billion)
8.5 Packaging
8.5.1 Packaging Market Trends Analysis (2020-2032)
8.5.2 Packaging Market Size Estimates and Forecasts to 2032 (USD Billion)
8.6 Other
8.6.1 Other Market Trends Analysis (2020-2032)
8.6.2 Other Market Size Estimates and Forecasts to 2032 (USD Billion)
9. Regional Analysis
9.1 Chapter Overview
9.2 North America
9.2.1 Trends Analysis
9.2.2 North America Human Machine Interface Market Estimates and Forecasts, by Country (2020-2032) (USD Billion)
9.2.3 North America Human Machine Interface Market Estimates and Forecasts, by Application (2020-2032) (USD Billion)
9.2.4 North America Human Machine Interface Market Estimates and Forecasts, by End User (2020-2032) (USD Billion)
9.2.5 USA
9.2.5.1 USA Human Machine Interface Market Estimates and Forecasts, by Application (2020-2032) (USD Billion)
9.2.5.2 USA Human Machine Interface Market Estimates and Forecasts, by End User (2020-2032) (USD Billion)
9.2.6 Canada
9.2.6.1 Canada Human Machine Interface Market Estimates and Forecasts, by Application (2020-2032) (USD Billion)
9.2.6.2 Canada Human Machine Interface Market Estimates and Forecasts, by End User (2020-2032) (USD Billion)
9.2.7 Mexico
9.2.7.1 Mexico Human Machine Interface Market Estimates and Forecasts, by Application (2020-2032) (USD Billion)
9.2.7.2 Mexico Human Machine Interface Market Estimates and Forecasts, by End User (2020-2032) (USD Billion)
9.3 Europe
9.3.1 Eastern Europe
9.3.1.1 Trends Analysis
9.3.1.2 Eastern Europe Human Machine Interface Market Estimates and Forecasts, by Country (2020-2032) (USD Billion)
9.3.1.3 Eastern Europe Human Machine Interface Market Estimates and Forecasts, by Application (2020-2032) (USD Billion)
9.3.1.4 Eastern Europe Human Machine Interface Market Estimates and Forecasts, by End User (2020-2032) (USD Billion)
9.3.1.5 Poland
9.3.1.5.1 Poland Human Machine Interface Market Estimates and Forecasts, by Application (2020-2032) (USD Billion)
9.3.1.5.2 Poland Human Machine Interface Market Estimates and Forecasts, by End User (2020-2032) (USD Billion)
9.3.1.6 Romania
9.3.1.6.1 Romania Human Machine Interface Market Estimates and Forecasts, by Application (2020-2032) (USD Billion)
9.3.1.6.2 Romania Human Machine Interface Market Estimates and Forecasts, by End User (2020-2032) (USD Billion)
9.3.1.7 Hungary
9.3.1.7.1 Hungary Human Machine Interface Market Estimates and Forecasts, by Application (2020-2032) (USD Billion)
9.3.1.7.2 Hungary Human Machine Interface Market Estimates and Forecasts, by End User (2020-2032) (USD Billion)
9.3.1.8 Turkey
9.3.1.8.1 Turkey Human Machine Interface Market Estimates and Forecasts, by Application (2020-2032) (USD Billion)
9.3.1.8.2 Turkey Human Machine Interface Market Estimates and Forecasts, by End User (2020-2032) (USD Billion)
9.3.1.9 Rest of Eastern Europe
9.3.1.9.1 Rest of Eastern Europe Human Machine Interface Market Estimates and Forecasts, by Application (2020-2032) (USD Billion)
9.3.1.9.2 Rest of Eastern Europe Human Machine Interface Market Estimates and Forecasts, by End User (2020-2032) (USD Billion)
9.3.2 Western Europe
9.3.2.1 Trends Analysis
9.3.2.2 Western Europe Human Machine Interface Market Estimates and Forecasts, by Country (2020-2032) (USD Billion)
9.3.2.3 Western Europe Human Machine Interface Market Estimates and Forecasts, by Application (2020-2032) (USD Billion)
9.3.2.4 Western Europe Human Machine Interface Market Estimates and Forecasts, by End User (2020-2032) (USD Billion)
9.3.2.5 Germany
9.3.2.5.1 Germany Human Machine Interface Market Estimates and Forecasts, by Application (2020-2032) (USD Billion)
9.3.2.5.2 Germany Human Machine Interface Market Estimates and Forecasts, by End User (2020-2032) (USD Billion)
9.3.2.6 France
9.3.2.6.1 France Human Machine Interface Market Estimates and Forecasts, by Application (2020-2032) (USD Billion)
9.3.2.6.2 France Human Machine Interface Market Estimates and Forecasts, by End User (2020-2032) (USD Billion)
9.3.2.7 UK
9.3.2.7.1 UK Human Machine Interface Market Estimates and Forecasts, by Application (2020-2032) (USD Billion)
9.3.2.7.2 UK Human Machine Interface Market Estimates and Forecasts, by End User (2020-2032) (USD Billion)
9.3.2.8 Italy
9.3.2.8.1 Italy Human Machine Interface Market Estimates and Forecasts, by Application (2020-2032) (USD Billion)
9.3.2.8.2 Italy Human Machine Interface Market Estimates and Forecasts, by End User (2020-2032) (USD Billion)
9.3.2.9 Spain
9.3.2.9.1 Spain Human Machine Interface Market Estimates and Forecasts, by Application (2020-2032) (USD Billion)
9.3.2.9.2 Spain Human Machine Interface Market Estimates and Forecasts, by End User (2020-2032) (USD Billion)
9.3.2.10 Netherlands
9.3.2.10.1 Netherlands Human Machine Interface Market Estimates and Forecasts, by Application (2020-2032) (USD Billion)
9.3.2.10.2 Netherlands Human Machine Interface Market Estimates and Forecasts, by End User (2020-2032) (USD Billion)
9.3.2.11 Switzerland
9.3.2.11.1 Switzerland Human Machine Interface Market Estimates and Forecasts, by Application (2020-2032) (USD Billion)
9.3.2.11.2 Switzerland Human Machine Interface Market Estimates and Forecasts, by End User (2020-2032) (USD Billion)
9.3.2.12 Austria
9.3.2.12.1 Austria Human Machine Interface Market Estimates and Forecasts, by Application (2020-2032) (USD Billion)
9.3.2.12.2 Austria Human Machine Interface Market Estimates and Forecasts, by End User (2020-2032) (USD Billion)
9.3.2.13 Rest of Western Europe
9.3.2.13.1 Rest of Western Europe Human Machine Interface Market Estimates and Forecasts, by Application (2020-2032) (USD Billion)
9.3.2.13.2 Rest of Western Europe Human Machine Interface Market Estimates and Forecasts, by End User (2020-2032) (USD Billion)
9.4 Asia Pacific
9.4.1 Trends Analysis
9.4.2 Asia Pacific Human Machine Interface Market Estimates and Forecasts, by Country (2020-2032) (USD Billion)
9.4.3 Asia Pacific Human Machine Interface Market Estimates and Forecasts, by Application (2020-2032) (USD Billion)
9.4.4 Asia Pacific Human Machine Interface Market Estimates and Forecasts, by End User (2020-2032) (USD Billion)
9.4.5 China
9.4.5.1 China Human Machine Interface Market Estimates and Forecasts, by Application (2020-2032) (USD Billion)
9.4.5.2 China Human Machine Interface Market Estimates and Forecasts, by End User (2020-2032) (USD Billion)
9.4.6 India
9.4.5.1 India Human Machine Interface Market Estimates and Forecasts, by Application (2020-2032) (USD Billion)
9.4.5.2 India Human Machine Interface Market Estimates and Forecasts, by End User (2020-2032) (USD Billion)
9.4.5 Japan
9.4.5.1 Japan Human Machine Interface Market Estimates and Forecasts, by Application (2020-2032) (USD Billion)
9.4.5.2 Japan Human Machine Interface Market Estimates and Forecasts, by End User (2020-2032) (USD Billion)
9.4.6 South Korea
9.4.6.1 South Korea Human Machine Interface Market Estimates and Forecasts, by Application (2020-2032) (USD Billion)
9.4.6.2 South Korea Human Machine Interface Market Estimates and Forecasts, by End User (2020-2032) (USD Billion)
9.4.7 Vietnam
9.4.7.1 Vietnam Human Machine Interface Market Estimates and Forecasts, by Application (2020-2032) (USD Billion)
9.2.7.2 Vietnam Human Machine Interface Market Estimates and Forecasts, by End User (2020-2032) (USD Billion)
9.4.8 Singapore
9.4.8.1 Singapore Human Machine Interface Market Estimates and Forecasts, by Application (2020-2032) (USD Billion)
9.4.8.2 Singapore Human Machine Interface Market Estimates and Forecasts, by End User (2020-2032) (USD Billion)
9.4.9 Australia
9.4.9.1 Australia Human Machine Interface Market Estimates and Forecasts, by Application (2020-2032) (USD Billion)
9.4.9.2 Australia Human Machine Interface Market Estimates and Forecasts, by End User (2020-2032) (USD Billion)
9.4.10 Rest of Asia Pacific
9.4.10.1 Rest of Asia Pacific Human Machine Interface Market Estimates and Forecasts, by Application (2020-2032) (USD Billion)
9.4.10.2 Rest of Asia Pacific Human Machine Interface Market Estimates and Forecasts, by End User (2020-2032) (USD Billion)
9.5 Middle East and Africa
9.5.1 Middle East
9.5.1.1 Trends Analysis
9.5.1.2 Middle East Human Machine Interface Market Estimates and Forecasts, by Country (2020-2032) (USD Billion)
9.5.1.3 Middle East Human Machine Interface Market Estimates and Forecasts, by Application (2020-2032) (USD Billion)
9.5.1.4 Middle East Human Machine Interface Market Estimates and Forecasts, by End User (2020-2032) (USD Billion)
9.5.1.5 UAE
9.5.1.5.1 UAE Human Machine Interface Market Estimates and Forecasts, by Application (2020-2032) (USD Billion)
9.5.1.5.2 UAE Human Machine Interface Market Estimates and Forecasts, by End User (2020-2032) (USD Billion)
9.5.1.6 Egypt
9.5.1.6.1 Egypt Human Machine Interface Market Estimates and Forecasts, by Application (2020-2032) (USD Billion)
9.5.1.6.2 Egypt Human Machine Interface Market Estimates and Forecasts, by End User (2020-2032) (USD Billion)
9.5.1.7 Saudi Arabia
9.5.1.7.1 Saudi Arabia Human Machine Interface Market Estimates and Forecasts, by Application (2020-2032) (USD Billion)
9.5.1.7.2 Saudi Arabia Human Machine Interface Market Estimates and Forecasts, by End User (2020-2032) (USD Billion)
9.5.1.8 Qatar
9.5.1.8.1 Qatar Human Machine Interface Market Estimates and Forecasts, by Application (2020-2032) (USD Billion)
9.5.1.8.2 Qatar Human Machine Interface Market Estimates and Forecasts, by End User (2020-2032) (USD Billion)
9.5.1.9 Rest of Middle East
9.5.1.9.1 Rest of Middle East Human Machine Interface Market Estimates and Forecasts, by Application (2020-2032) (USD Billion)
9.5.1.9.2 Rest of Middle East Human Machine Interface Market Estimates and Forecasts, by End User (2020-2032) (USD Billion)
9.5.2 Africa
9.5.2.1 Trends Analysis
9.5.2.2 Africa Human Machine Interface Market Estimates and Forecasts, by Country (2020-2032) (USD Billion)
9.5.2.3 Africa Human Machine Interface Market Estimates and Forecasts, by Application (2020-2032) (USD Billion)
9.5.2.4 Africa Human Machine Interface Market Estimates and Forecasts, by End User (2020-2032) (USD Billion)
9.5.2.5 South Africa
9.5.2.5.1 South Africa Human Machine Interface Market Estimates and Forecasts, by Application (2020-2032) (USD Billion)
9.5.2.5.2 South Africa Human Machine Interface Market Estimates and Forecasts, by End User (2020-2032) (USD Billion)
9.5.2.6 Nigeria
9.5.2.6.1 Nigeria Human Machine Interface Market Estimates and Forecasts, by Application (2020-2032) (USD Billion)
9.5.2.6.2 Nigeria Human Machine Interface Market Estimates and Forecasts, by End User (2020-2032) (USD Billion)
9.5.2.7 Rest of Africa
9.5.2.7.1 Rest of Africa Human Machine Interface Market Estimates and Forecasts, by Application (2020-2032) (USD Billion)
9.5.2.7.2 Rest of Africa Human Machine Interface Market Estimates and Forecasts, by End User (2020-2032) (USD Billion)
9.6 Latin America
9.6.1 Trends Analysis
9.6.2 Latin America Human Machine Interface Market Estimates and Forecasts, by Country (2020-2032) (USD Billion)
9.6.3 Latin America Human Machine Interface Market Estimates and Forecasts, by Application (2020-2032) (USD Billion)
9.6.4 Latin America Human Machine Interface Market Estimates and Forecasts, by End User (2020-2032) (USD Billion)
9.6.5 Brazil
9.6.5.1 Brazil Human Machine Interface Market Estimates and Forecasts, by Application (2020-2032) (USD Billion)
9.6.5.2 Brazil Human Machine Interface Market Estimates and Forecasts, by End User (2020-2032) (USD Billion)
9.6.6 Argentina
9.6.6.1 Argentina Human Machine Interface Market Estimates and Forecasts, by Application (2020-2032) (USD Billion)
9.6.6.2 Argentina Human Machine Interface Market Estimates and Forecasts, by End User (2020-2032) (USD Billion)
9.6.7 Colombia
9.6.7.1 Colombia Human Machine Interface Market Estimates and Forecasts, by Application (2020-2032) (USD Billion)
9.6.7.2 Colombia Human Machine Interface Market Estimates and Forecasts, by End User (2020-2032) (USD Billion)
9.6.8 Rest of Latin America
9.6.8.1 Rest of Latin America Human Machine Interface Market Estimates and Forecasts, by Application (2020-2032) (USD Billion)
9.6.8.2 Rest of Latin America Human Machine Interface Market Estimates and Forecasts, by End User (2020-2032) (USD Billion)
10. Company Profiles
10.1 Siemens
10.1.1 Company Overview
10.1.2 Financial
10.1.3 Products/ Services Offered
110.1.4 SWOT Analysis
10.2 Rockwell Automation
10.2.1 Company Overview
10.2.2 Financial
10.2.3 Products/ Services Offered
10.2.4 SWOT Analysis
10.3 Schneider Electric
10.3.1 Company Overview
10.3.2 Financial
10.3.3 Products/ Services Offered
10.3.4 SWOT Analysis
10.4 Mitsubishi Electric
10.4.1 Company Overview
10.4.2 Financial
10.4.3 Products/ Services Offered
10.4.4 SWOT Analysis
10.5 Honeywell
10.5.1 Company Overview
10.5.2 Financial
10.5.3 Products/ Services Offered
10.5.4 SWOT Analysis
10.6 Yokogawa Electric
10.6.1 Company Overview
10.6.2 Financial
10.6.3 Products/ Services Offered
10.6.4 SWOT Analysis
10.7 ABB
10.7.1 Company Overview
10.7.2 Financial
10.7.3 Products/ Services Offered
10.7.4 SWOT Analysis
10.8 Omron
10.8.1 Company Overview
10.8.2 Financial
10.8.3 Products/ Services Offered
10.8.4 SWOT Analysis
10.9 GE Digital
10.9.1 Company Overview
10.9.2 Financial
10.9.3 Products/ Services Offered
10.9.4 SWOT Analysis
10.10 Beckhoff Automation
10.9.1 Company Overview
10.9.2 Financial
10.9.3 Products/ Services Offered
10.9.4 SWOT Analysis
11. Use Cases and Best Practices
12. Conclusion
An accurate research report requires proper strategizing as well as implementation. There are multiple factors involved in the completion of good and accurate research report and selecting the best methodology to compete the research is the toughest part. Since the research reports we provide play a crucial role in any company’s decision-making process, therefore we at SNS Insider always believe that we should choose the best method which gives us results closer to reality. This allows us to reach at a stage wherein we can provide our clients best and accurate investment to output ratio.
Each report that we prepare takes a timeframe of 350-400 business hours for production. Starting from the selection of titles through a couple of in-depth brain storming session to the final QC process before uploading our titles on our website we dedicate around 350 working hours. The titles are selected based on their current market cap and the foreseen CAGR and growth.
The 5 steps process:
Step 1: Secondary Research:
Secondary Research or Desk Research is as the name suggests is a research process wherein, we collect data through the readily available information. In this process we use various paid and unpaid databases which our team has access to and gather data through the same. This includes examining of listed companies’ annual reports, Journals, SEC filling etc. Apart from this our team has access to various associations across the globe across different industries. Lastly, we have exchange relationships with various university as well as individual libraries.
Step 2: Primary Research
When we talk about primary research, it is a type of study in which the researchers collect relevant data samples directly, rather than relying on previously collected data. This type of research is focused on gaining content specific facts that can be sued to solve specific problems. Since the collected data is fresh and first hand therefore it makes the study more accurate and genuine.
We at SNS Insider have divided Primary Research into 2 parts.
Part 1 wherein we interview the KOLs of major players as well as the upcoming ones across various geographic regions. This allows us to have their view over the market scenario and acts as an important tool to come closer to the accurate market numbers. As many as 45 paid and unpaid primary interviews are taken from both the demand and supply side of the industry to make sure we land at an accurate judgement and analysis of the market.
This step involves the triangulation of data wherein our team analyses the interview transcripts, online survey responses and observation of on filed participants. The below mentioned chart should give a better understanding of the part 1 of the primary interview.
Part 2: In this part of primary research the data collected via secondary research and the part 1 of the primary research is validated with the interviews from individual consultants and subject matter experts.
Consultants are those set of people who have at least 12 years of experience and expertise within the industry whereas Subject Matter Experts are those with at least 15 years of experience behind their back within the same space. The data with the help of two main processes i.e., FGDs (Focused Group Discussions) and IDs (Individual Discussions). This gives us a 3rd party nonbiased primary view of the market scenario making it a more dependable one while collation of the data pointers.
Step 3: Data Bank Validation
Once all the information is collected via primary and secondary sources, we run that information for data validation. At our intelligence centre our research heads track a lot of information related to the market which includes the quarterly reports, the daily stock prices, and other relevant information. Our data bank server gets updated every fortnight and that is how the information which we collected using our primary and secondary information is revalidated in real time.
Step 4: QA/QC Process
After all the data collection and validation our team does a final level of quality check and quality assurance to get rid of any unwanted or undesired mistakes. This might include but not limited to getting rid of the any typos, duplication of numbers or missing of any important information. The people involved in this process include technical content writers, research heads and graphics people. Once this process is completed the title gets uploader on our platform for our clients to read it.
Step 5: Final QC/QA Process:
This is the last process and comes when the client has ordered the study. In this process a final QA/QC is done before the study is emailed to the client. Since we believe in giving our clients a good experience of our research studies, therefore, to make sure that we do not lack at our end in any way humanly possible we do a final round of quality check and then dispatch the study to the client.
MARKET SEGMENTATION
By Product Type
Display Terminals
Interface Software
Industrial PCs
Others
By Application Type
Automotive
Food and Beverages
Oil and Gas
Packaging
Others
Request for Segment Customization as per your Business Requirement: Segment Customization Request
REGIONAL COVERAGE:
North America
US
Canada
Mexico
Europe
Eastern Europe
Poland
Romania
Hungary
Turkey
Rest of Eastern Europe
Western Europe
Germany
France
UK
Italy
Spain
Netherlands
Switzerland
Austria
Rest of Western Europe
Asia Pacific
China
India
Japan
South Korea
Vietnam
Singapore
Australia
Rest of Asia Pacific
Middle East & Africa
Middle East
UAE
Egypt
Saudi Arabia
Qatar
Rest of the Middle East
Africa
Nigeria
South Africa
Rest of Africa
Latin America
Brazil
Argentina
Colombia
Rest of Latin America
Request for Country Level Research Report: Country Level Customization Request
Available Customization
With the given market data, SNS Insider offers customization as per the company’s specific needs. The following customization options are available for the report:
Product Analysis
Criss-Cross segment analysis (e.g. Product X Application)
Product Matrix which gives a detailed comparison of product portfolio of each company
Geographic Analysis
Additional countries in any of the regions
Company Information
Detailed analysis and profiling of additional market players (Up to five)
The MEMS Electronic Oscillators Market size was valued at USD 200.60 Billion in 2023. It is estimated to reach $2219.75 Billion at a CAGR of 30.68% by 2032
The Semiconductor Memory Market size is expected to be valued at USD 115.50 Billion in 2023. It is estimated to reach USD 300.27 Billion by 2032 with a growing CAGR of 11.2% over the forecast period 2024-2032.
The Smart Lighting Market Size was valued at USD 11.95 billion in 2023, and is expected to reach USD 40.09 billion by 2032, and grow at a CAGR of 14.44% over the forecast period 2024-2032.
The Surface Mount Technology (SMT) Market size was valued at USD 6.36 billion in 2023 and is expected to grow to USD 12.60 billion by 2032 and grow at a CAGR of 7.9 % over the forecast period of 2024-2032.
The Smart Irrigation Controllers Market size was valued at $2.00 Billion in 2023 and is expected to reach $5.23 Billion at a CAGR of 11.30% by 2024 to 2032
The Multi-factor authentication Market size was valued at USD 16.00 billion in 2023 and is expected to grow to USD 54.12 billion by 2032 and grow at a CAGR of 14.5% over the forecast period of 2024-2032.
Hi! Click one of our member below to chat on Phone