Internet of Things (IoT) Market Report Scope & Overview:
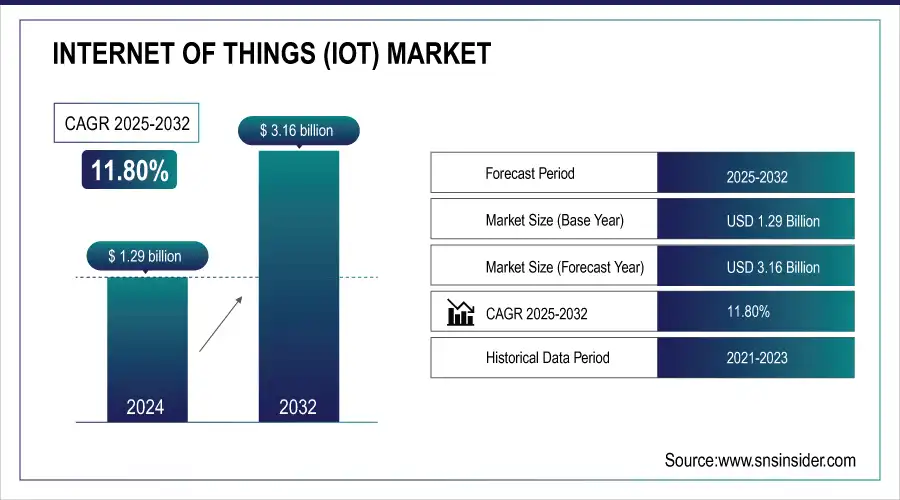
The Internet of Things (IoT) Market was valued at USD 1.29 billion in 2024 and is expected to reach USD 3.16 billion by 2032, growing at a CAGR of 11.80% from 2025-2032.
The IoT market has seen rapid growth in recent years, driven by advances in connectivity, smart devices, and data analytics. This surge is attributed to several factors, including the increasing adoption of smart home devices, industrial automation, and healthcare monitoring systems. One of the primary growth drivers is the expansion of 5G networks, which enable faster and more reliable connections between IoT devices. Additionally, the falling costs of sensors and hardware have made it more affordable for businesses and consumers to adopt IoT solutions. In industrial sectors, IoT is driving significant advancements in predictive maintenance, supply chain optimization, and energy management, contributing to increased efficiency and reduced operational costs.
Get More Information on Internet of Things (IoT) Market - Request Sample Report
In the consumer sector, smart home devices such as thermostats, security systems, and wearable health trackers have gained popularity, further fueling IoT market growth. The healthcare sector, in particular, is witnessing strong demand for IoT devices for remote patient monitoring and telemedicine. By 2025, it’s estimated that the number of IoT-connected devices will exceed 30 billion worldwide, compared to around 14.2 billion in 2019. Furthermore, government initiatives promoting smart city projects and sustainable energy management are boosting IoT adoption across urban infrastructure.
Market Size and Forecast:
-
Market Size in 2024 USD 1.29 Billion
-
Market Size by 2032 USD 3.16 Billion
-
CAGR of 11.80 % From 2025 to 2032
-
Base Year 2024
-
Forecast Period 2025-2032
-
Historical Data 2021-2023
Key Internet of Things (IoT) Market Trends:
• Growing data generation from IoT devices, expected to nearly double within two years, fueling demand for advanced analytics solutions.
• Increasing integration of AI in IoT ecosystems to optimize operations, predict failures, and enhance decision-making across industries.
• Expanding role of IoT in smart cities, healthcare, and manufacturing through predictive analytics and real-time monitoring.
• Rapid adoption of 5G networks enabling faster, more reliable, low-latency connectivity for mission-critical IoT applications.
• Rising reliance on real-time IoT data for predictive maintenance, automation, and operational efficiency in industrial and urban infrastructure.
Internet of Things (IoT) Market Growth Drivers:
-
IoT devices generate large data sets, enhancing decision-making through AI-driven insights.
IoT devices collect vast amounts of data through sensors and connected systems, which are then processed and analyzed to improve decision-making. These devices generate real-time data on various parameters such as temperature, movement, energy usage, and health metrics, providing valuable insights across industries. In 2023, it was estimated that IoT devices worldwide generated around 79.4 zettabytes of data, and this number is expected to rise to 175 zettabytes by 2025.
The integration of Artificial Intelligence (AI) in IoT ecosystems allows for advanced data analytics, helping businesses identify patterns, optimize operations, and make informed decisions. For instance, in manufacturing, AI analyzes IoT-generated data to predict equipment failures, reducing downtime by 30-50%. In smart cities, AI-powered IoT solutions improve traffic management, reducing congestion by up to 20%, while in healthcare, predictive analytics from IoT devices can anticipate health issues, improving patient outcomes. This fusion of AI and IoT is crucial for industries that rely on continuous monitoring and automation. As IoT data grows exponentially, AI-driven insights will play a key role in improving efficiency, reducing operational costs, and enhancing user experiences across sectors like manufacturing, healthcare, and urban infrastructure.
Faster and more reliable connectivity, especially with the expansion of 5G networks, significantly boosts the performance of IoT devices by enabling quicker data transfer and lower latency. This improved network infrastructure allows IoT devices to communicate in real time, which is critical for applications requiring instant responses, such as autonomous vehicles, smart factories, and healthcare monitoring systems. In the industrial IoT sector, for example, real-time data from sensors can be analyzed immediately, allowing for predictive maintenance and operational adjustments without delay.
Internet of Things (IoT) Market Restraints:
-
The upfront investment in IoT infrastructure and integration can be prohibitive for small businesses.
For small businesses, the initial investment required to implement IoT infrastructure can be a significant barrier. Setting up IoT systems involves costs for purchasing connected devices, installing sensors, upgrading network infrastructure, and ensuring data storage and security. Additionally, businesses may need to invest in software platforms for managing and analyzing the vast amounts of data generated by IoT devices. These upfront expenses, along with potential costs for skilled personnel and ongoing maintenance, can be prohibitive for smaller companies with limited budgets.
Furthermore, small businesses may find it challenging to justify the return on investment (ROI) from IoT adoption, especially if they operate in industries where the benefits are not immediately clear. While larger companies can absorb these costs more easily due to economies of scale, smaller enterprises may struggle to afford the initial investment, slowing down IoT adoption in this segment of the market.
Certain IoT devices, especially those with high processing capabilities or continuous data transmission, require substantial power, which can limit their usability in specific applications. For instance, IoT sensors deployed in remote locations or industrial environments often rely on batteries, and frequent recharging or replacement can be impractical. Devices like drones, industrial robots, or smart cameras that require constant operation may drain power quickly, posing challenges in terms of energy consumption and cost-efficiency.
Internet of Things (IoT) Market Segment Analysis:
By Component
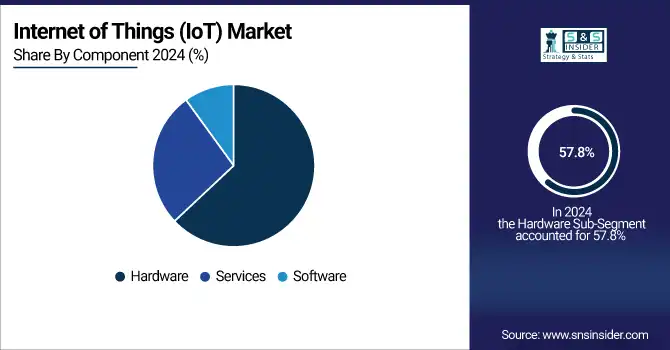
In 2024, the hardware segment dominated the IoT market and represented over 57.8% of the revenue share. IoT devices and sensors play a crucial role in gathering and transmitting data, and the growing popularity of smart devices, wearables, and connected appliances has significantly increased demand for IoT hardware. As the IoT ecosystem grows, so does the need for a wide variety of hardware components.
Meanwhile, the services segment is projected to have the fastest CAGR of 13.9% during the forecast period. Businesses and organizations are increasingly turning to professional services to design, implement, and manage IoT systems, recognizing the technology's potential to improve efficiency and generate new revenue opportunities.
By Deployment
In 2024, on-premise solutions dominated the market and held the largest share of 52% of market revenue. IoT applications in industries like manufacturing, automotive, and critical infrastructure often require real-time data processing and low-latency responses to maintain efficiency and safety. On-premise deployments enable organizations to process data locally, rather than depending on remote cloud servers, which helps reduce latency and enhance overall application performance.
The cloud segment is projected to experience the fastest CAGR during the forecast period. Cloud platforms offer on-demand access to extensive resources such as computing power, storage, and network bandwidth. This flexibility enables organizations to scale their IoT solutions as needed, without the constraints of physical hardware, making it an ideal choice for dynamic and growing IoT deployments.
By Connectivity
In 2024, Wi-Fi led the market in revenue share. It is essential for smart home technologies, such as smart thermostats, lighting systems, security cameras, and voice assistants, which rely on Wi-Fi for connectivity. Wi-Fi offers a convenient and cost-effective way to connect these devices, enabling users to control and monitor their home environments through mobile apps and voice commands. The rising consumer demand for smart home solutions, driven by the desire for convenience, energy efficiency, and enhanced security, is boosting the need for reliable and high-performance Wi-Fi networks.
Meanwhile, Z-Wave is expected to experience significant growth over the forecast period. This technology supports a wide range of smart home products, including sensors, locks, thermostats, and lighting systems. The Z-Wave Alliance includes numerous member companies that produce a diverse range of Z-Wave-certified devices, providing consumers with a broad selection of compatible smart home solutions. For instance, products from brands like Aeotec, Schlage, and Fibaro integrate seamlessly with Z-Wave technology, offering extensive options for smart home enhancements.
By End-Use
In 2024, the consumer electronics segment captured the largest share of market revenue. The growing consumer demand for convenience, energy efficiency, and improved security in their homes is driving the popularity of smart home devices. Products like smart thermostats, lighting systems, locks, and voice assistants are becoming mainstream, offering users enhanced control over their home environments through IoT connectivity.
The agriculture industry is anticipated to grow at the leading CAGR owing to the growing demand for field-based equipment and sensors. Some key applications of the high-tech in the agricultural sector are smart greenhouses, smart farming, precision farming, smart agriculture, smart drones, and many others. The implementation of IoT in agriculture includes various benefits, such as reducing expenses while multiplying yields and improving the decision-making of farmers with accurate data. Such factors create numerous opportunities for the market’s progress.
Internet of Things (IoT) Market Regional Analysis:
North America Internet of Things (IoT) Market Insights
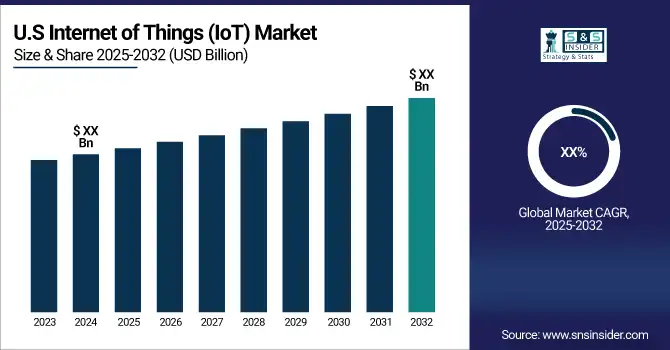
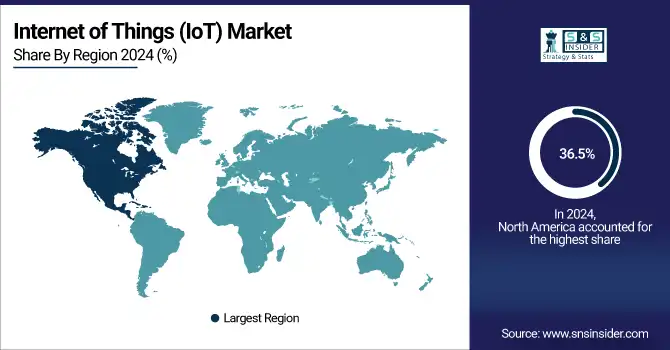
In 2024, North America dominated the market and held the largest market revenue share for IoT, accounting for 36.5%. The U.S. and Canada are at the forefront of developing advanced IoT technologies and solutions, supported by a strong ecosystem of technology firms, research institutions, and venture capital. Major companies like IBM, Cisco, and Microsoft are heavily investing in IoT innovations, including edge computing, artificial intelligence (AI), and 5G networks.
Need any customization research on Internet of Things (IoT) Market - Enquiry Now
Asia Pacific Internet of Things (IoT) Market Insights
The Asia Pacific IoT market is projected to grow at the fastest CAGR during the forecast period. Rapid urban expansion in major cities such as Beijing, Tokyo, and Mumbai is driving significant demand for smart city solutions that use IoT technologies to manage infrastructure, improve public services, and enhance residents' quality of life.Similarly, India's IoT market is expected to experience rapid growth in the coming years. With one of the fastest urbanization rates globally and millions migrating to cities annually, there is a growing need for smart city solutions that utilize IoT technologies to manage urban infrastructure, enhance public services, and improve quality of life.
Europe Internet of Things (IoT) Market Insights
In 2024, the European IoT market was recognized as highly promising. The European Union and individual European countries invest significantly in research and development to advance IoT technologies and applications. Initiatives like Horizon Europe, the EU’s major funding program for research and innovation, offer substantial financial support for IoT research projects.
Internet of Things (IoT) Market Key Players:
Some of the Internet of Things (IoT) Market Companies are
-
IBM - (IBM Watson IoTIBM Maximo)
-
Cisco -(Cisco IoT Solutions, Cisco Meraki)
-
Microsoft ( Microsoft Azure IoT, Microsoft Power BI)
-
Amazon Web Services (AWS) -(AWS IoT Core, AWS Greengrass)
-
Intel - (Intel IoT Platform, Intel NUC (Next Unit of Computing)
-
Siemens - (Siemens MindSphere, iemens SIMATIC)
-
GE Digital - (Predix Platform, GE Digital Wind Farm Solutions)
-
Honeywell - (Honeywell Connected Plant, Honeywell Building Management Solutions)
-
Samsung Electronics - (Samsung SmartThings, Samsung ARTIK IoT Modules)
-
Bosch - (Bosch IoT Suite, Bosch Connected Devices and Solutions)
-
SAP - ( SAP Leonardo IoT, SAP Cloud Platform)
-
Oracle - (Oracle IoT Cloud, Oracle Autonomous Database)
-
Huawei - ( Huawei IoT Solution, Huawei Cloud IoT Platform)
-
Qualcomm - ( Qualcomm Snapdragon IoT Platforms, Qualcomm IoT Connectivity Solutions)
-
PTC - ( PTC ThingWorx, PTC Vuforia )
-
ABB - (ABB Ability, ABB Industrial IoT Solutions)
-
Zebra Technologies- ( Zebra IoT Solutions, Zebra Data Capture Devices)
-
Arm Holdings - ( Arm Mbed IoT Device Platform, Arm Cortex-M Processors)
-
Dell Technologies- (Dell Edge Gateway, Dell IoT Solutions)
-
Schneider Electric- ( Eco Struxure IoT Platform, Schneider Electric Smart Building Solutions)
Competitive Landscape for Internet of Things (IoT) Market:
Cisco Systems is a global leader in networking and IoT solutions, offering platforms like Cisco IoT and Cisco Meraki. The company enables secure connectivity, real-time data management, and edge computing for industries. Its IoT solutions optimize operations, enhance automation, and support digital transformation across manufacturing, healthcare, energy, and smart city applications.
-
In June 2024, Cisco Systems, Inc. introduced an Intelligent Industrial IoT Network to support Artificial Intelligence (AI) and Machine Learning (ML) applications. This network improves industrial operations by enhancing uptime, yield, security, and revenue generation.
PTC is a leading provider of Internet of Things (IoT) and augmented reality (AR) solutions, best known for its ThingWorx IoT platform and Vuforia AR suite. The company empowers industries to connect devices, analyze real-time data, and improve operational efficiency. PTC’s IoT innovations drive digital transformation across manufacturing, automotive, healthcare, and smart infrastructure sectors.
-
In January 2023, PTC acquired Service Max, a company specializing in service management solutions. This acquisition strengthens PTC’s IoT portfolio by integrating field service management with advanced IoT analytics and augmented reality (AR), thereby enhancing service operations and customer support.
|
Report Attributes |
Details |
| Market Size in 2024 | USD 1.29 Billion |
| Market Size by 2032 | USD 3.16 Billion |
| CAGR | CAGR of 11.80% From 2025 to 2032 |
| Base Year | 2024 |
| Forecast Period | 2025-2032 |
| Historical Data | 2021-2023 |
|
Report Scope & Coverage |
Market Size, Segments Analysis, Competitive Landscape, Regional Analysis, DROC & SWOT Analysis, Forecast Outlook |
|
Key Segments |
• By Component ( Hardware, Software, Services) |
|
Regional Analysis/Coverage |
North America (US, Canada), Europe (Germany, UK, France, Italy, Spain, Russia, Poland, Rest of Europe), Asia Pacific (China, India, Japan, South Korea, Australia, ASEAN Countries, Rest of Asia Pacific), Middle East & Africa (UAE, Saudi Arabia, Qatar, South Africa, Rest of Middle East & Africa), Latin America (Brazil, Argentina, Mexico, Colombia, Rest of Latin America). |
|
Company Profiles |
IBM, Cisco, Microsoft, Amazon Web Services (AWS), Intel , Siemens, GE Digital, Honeywell, Samsung Electronics, Bosch and others. |
Frequently Asked Questions
key drivers in the Internet of Things (IoT) market are
- Growing need for remote patient monitoring and telemedicine solutions, especially post-pandemic.
- Faster and more reliable connectivity enhances IoT device performance.
North America region dominated the Internet of Things (IoT) Market.
The key players of the Internet of Things (IoT) Market are Amazon Web Service, Bosch Software Innovation Gmbh, Cisco Systems, Inc., Google Llc, Hewlett Packard Enterprise, International Business Machine Corporation (Ibm), Intel Corporation, Microsoft Corporation, Oracle Corporation, and SAP SE.
The growth rate of the Internet of Things (IoT) Market is 11.80% over the forecast period 2025-2032
The Internet of Things (IoT) Market was valued at USD 1.29 billion in 2024 and is expected to reach USD 3.16 billion by 2032, growing at a CAGR of 11.80% from 2025-2032.
Get in Touch
