image

Hybrid Supercapacitor Market Size, Share, and Segmentation By Type (Lithium-Ion Capacitors, Lithium Hybrid Capacitors, and Composite Capacitors) Component (Electrodes, Electrolytes, Separators, and Current Collectors), Application (Automotive, Energy, Consumer Electronics, Aerospace, and Industrial Equipment), Energy Density (Low, Medium, and High), and Region | Global Forecast 2025-2032

Date: July 2025 Report Code: SNS/SEMI/7914 Page 300

Hybrid Supercapacitor Market Report Scope & Overview:

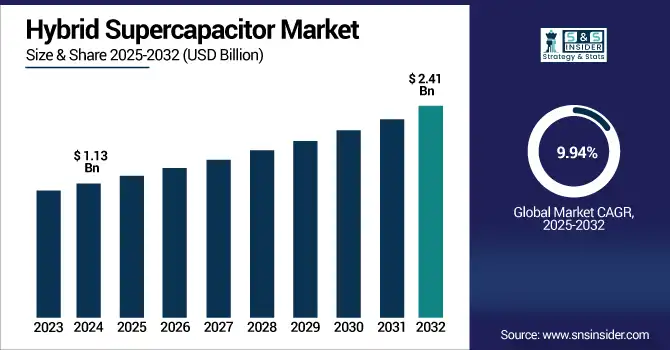
The Hybrid Supercapacitor Market Size was valued at USD 1.13 billion in 2024 and is expected to reach USD 2.41 billion by 2032 and grow at a CAGR of 9.94% over the forecast period of 2025-2032.

Hybrid-Supercapacitor-Market revenue analysis

To Get more information on Hybrid-Supercapacitor-Market - Request Free Sample Report

The global market is segmented by type, component, application, and energy density, including regional performance detailed analysis. A fast-growing ecosystem, driven by increasing demand for fast-charging, high-energy-density solutions across automotive, industrial, and renewable sectors. Offering durability against environmental fluctuations, these supercapacitors are considered the best choice for high-efficiency systems. Hybrid Supercapacitor Market analysis reveals evolving trends in energy resilience, as rapid technological advancements and adoption in mission-critical applications are driving the market toward global adoption.

For instance, compared to lithium-ion batteries, hybrid supercapacitors show a 60% lower risk of thermal runaway under fault conditions.

The U.S. Hybrid Supercapacitor Market size was USD 0.23 billion in 2024 and is expected to reach USD 0.49 billion by 2032, growing at a CAGR of 9.69% over the forecast period of 2025–2032.

The U.S. market is stimulated by the rapid adoption of electric vehicles, increased grid modernization activities, and the growing need for energy storage for both defense and aerospace applications. Bolstered by robust technological framework and conducive policies for sustainable energy at large, the nation is emerging as a frontrunner of hybrid supercapacitor innovations. All these factors combined enable the U.S. to be at the heart of the development of the next generation of high-performance, thermally stable energy storage technologies.

For instance, hybrid supercapacitors show a 70% lower failure rate in extreme environments compared to conventional battery alternatives.

Market Dynamics:

Key Drivers:

  • Increasing Demand for Efficient Power Storage in Electric Vehicles and Consumer Electronics Drive Market Expansion

Hybrid supercapacitors are characterized by their high-power density and rapid charge/discharge property, which leads to their significant applications in electric vehicles and portable electronics in the continuous advancement. They offer bursting power and long lifecycle advantages, filling the gaps of battery limitations. Automotive manufacturers and tech giants are warming up to them for improved efficiency, particularly in applications, such as regenerative braking and energy backup systems. The surge in proliferation of EVs and portable devices is directly contributing to the demand for hybrid supercapacitors worldwide, as they represent novel energy storage systems that are highly compact and efficient.

For instance, in regenerative braking systems, hybrid supercapacitors can recover and reuse up to 30% of braking energy.

Restraints:

  • High Initial Cost of Hybrid Supercapacitors Compared to Conventional Batteries Hinder Market Growth

Although hybrid supercapacitors can deliver higher performance levels, they often entail sky-high production and material costs due to cutting edge electrode material and electrolyte. This makes them more expensive than lithium-ion batteries, particularly in low-margin sectors. In sectors, where budget is a concern, the initial investment blocks off adoption. Price competitiveness limits mass-market penetration unless large cost reductions can be achieved through economics of scale (common with emerging technologies) or technological innovation themselves.

Opportunities:

  • Rising Demand for Backup Power and UPS Systems Across Data Centers and Industrial Units Provide Better Market Growth Opportunities

Industries and data centers have started depending on uninterruptible power supplies (UPS) and backup systems more than ever to avoid downtimes and assure data integrity. Short-term power stabilization can be done with hybrid supercapacitors, which have quick response times and are long-lasting. Rising infrastructure reliance is a key driver of Hybrid Supercapacitor Market growth. The transition from traditional types of batteries opens the door to hybrid supercapacitor installation on critical infrastructure applications, where health of a few milliseconds means big losses on operations.

For instance, integrating hybrid supercapacitors into UPS systems can reduce unplanned downtime risk by up to 40%.

Challenges:

  • Limited Energy Storage Duration Compared to Traditional Batteries in Long-Duration Use Cases Can Challenge Market Growth

Hybrid supercapacitors are very good at providing high rates of power over short time, but they are poor for energy storage at long time scales. This makes batteries more suitable than hybrid capacitors for applications that require hours of sustained power, such as stationary storage for residential solar, or for heavy duty applications, such as electric trucks. This performance limitation impedes their uptake in areas where long-term autonomy is essential. One of the major technological and commercial barriers is bridging the energy gap between power density and capacity.

Segmentation Analysis:

By Type

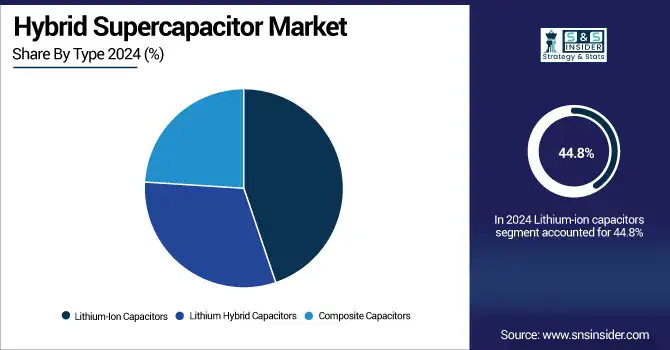
Lithium-ion capacitors covered the largest Hybrid Supercapacitor Market share of 44.8% in 2024 due to their high energy density, thermal stability, and excellent cycle life. The characteristics allow them to be used in automotive control systems, grid storage and renewable energy integration. Advanced lithium-ion capacitors manufactured by companies, such as Maxwell Technologies are also stable under high-heat conditions. Therefore, the segment has remained prominent in energy-intensive applications that need consistent thermal performance and reliability.

Lithium hybrid capacitors are anticipated to grow at the highest CAGR by 11.05% over 2024-2032 owing to its ability to provide fast charging and high energy output at the same time. Since they incorporate the advantages of both supercapacitors and batteries, supercapacitors are excellent candidates for EVs and drones at high-performance applications. One of the main players in this segment is CAP-XX Ltd., which has hybrid capacitor technologies for thermal stability and long life-cycles in industrial electronics.

Hybrid-Supercapacitor-Market-By-Type

By Component

In 2024, Electrodes accounted for the lead market with around 38.5% market share owing to their importance as energy transfer points and also their charge retaining capability under high thermal conditions. The application of advanced materials, such as carbon composites and nanostructures possesses conductivity and stability. Skeleton Technologies, up to now most often mentioned for its ultracapacitor components and breakthroughs in the electrode engineering supporting performance for demanding applications, such as the grid storage or electric mobility systems.

Electrolytes are projected to achieve the fastest CAGR of 11.04% during 2024-2032 due to the development of solid and gel-based chemistries with heat resistant and safety benefits. In aerospace, defense, and energy sectors, reliability in thermal cable systems is increased through next-generation electrolyte formulations from TOKIN Corporation, which is currently investing in formulations to improve high-voltage, high-temperature sustainability.

By Application 

In 2024, the automotive segment held the largest market share of 36.4%, owing to the growing production of electric and hybrid vehicles, which require a robust cable design containing hot conditions and high-power current for safety requirements. TE Connectivity, a global leader in automotive cable systems, strengthens this segment leadership with high-temperature cable solutions for next-gen EV powertrains that attain mission critical durability and regulatory compliance in harsh environments.

The Energy segment is predicted to increase at fastest CAGR of 11.02% during 2024-2032 owing to the growth of solar, wind and grid-scale power systems. At high-temperature, helps manage the power flow at extreme heat, enclosed installation. Prysmian Group is a key driver of the expansion of this market segment with its HTS cables for global renewable and smart grid applications.
 

By Energy Density

In 2024, the medium energy density segment dominated the market, capturing 39.4% share owing to its widespread use across automotive, industrial, and defense sectors. They deliver the right mix of capacity, safety, and economy. Current Hybrid Supercapacitor Market trends highlight rising demand for balanced performance, as Nexans, among others, offer multiple high-temperature medium-capacity cables for manufacturing, automation, and power distribution systems, facilitating broad adoption in medium-load applications.

The segment of high energy density cables is expected to register the fastest CAGR of 10.39% during the projection period of 2024-2032. These wires are for applications that require small, light, and high-power energy transfer solutions and are under high temperatures. Leoni has uplisted its expertise in thermal cables; and needs that ahigh-performance thermal cable system will hold strong against the different environments experienced at high temperatures, and what this means to aerospace and fast-charging EV are high performance charging cables.

Regional Analysis:

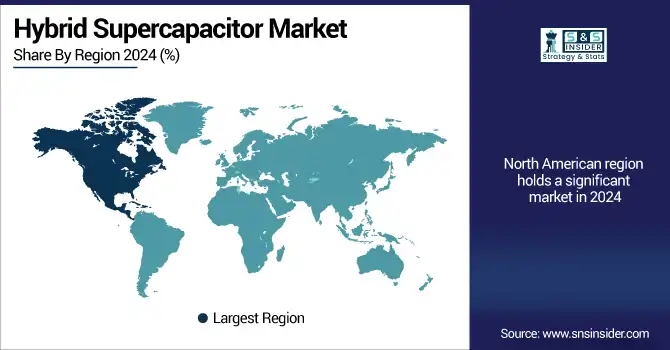
North America is a prominent player in the Hybrid Supercapacitor Market with increased adoption of electric vehicles, smart grid modernization, and high demand for hybrid and electric transportation from aerospace and defense. This is also partly driven by the presence of leading technology firms along with robust regulatory support fueling the growth of the market. Innovation and sustainability efforts across both the industrial and transportation sectors continue within the region.

  • The U.S. dominates the North American hybrid supercapacitor industry globally due to its strong EV ecosystem, advanced defense sector, and significant investments in renewable energy and smart grid infrastructure, supported by favorable government policies and technological leadership.

Asia Pacific accounted for the largest revenue share of 33.5% in the global Hybrid Supercapacitor Market in 2024, owing to high production of EVs, huge demand for consumer electronics, and encouraging government incentives in countries, such as China, Japan, and South Korea. Additionally, the highest projected growth CAGR of 10.81% is expected in this region until 2032, due to rapid industrialization, clean energy goals and increasing exports. Regional local innovation and commodity-advantaged policies continue to draw global manufacturers to the region.

  • China leads the Asia Pacific market owing to its massive EV production capacity, extensive electronics manufacturing base, and aggressive government initiatives promoting energy storage technologies and domestic innovation across industrial and transportation sectors.

Europe actions as a prominent contributor for Hybrid Supercapacitor market due to its clear focus on sustainable mobility, energy efficiency and decarbonization. Evoking demand due to its focus on electric vehicle expansion, renewable energy adoption, and strict environmental regulation in the region. Supportive EU policies along with significant investments into research and development are causing high-performance energy storage technologies to develop across major European economies.

  • Germany dominates the European Hybrid Supercapacitor Market due to its advanced automotive industry, strong R&D capabilities, and significant investments in renewable energy and industrial electrification. Its leadership in engineering innovation and energy storage integration positions it ahead of France, the U.K., Italy, and Spain.

The UAE is leading in the Middle East & Africa as a result of strong investments in renewable energy, smart grid infrastructure & government-driven innovation. Brazil stands atop Latin America's market due to its growing renewable energy sector, and its electric mobility projects and policies that encourage below zero emissions while deploying advanced energy storage technologies, such as hybrid supercapacitors, across the main industries.

Hybrid-Supercapacitor-Market-By-region.

Get Customized Report as per Your Business Requirement - Enquiry Now

Key Players:

Major Key Players in Hybrid Supercapacitor companies are Maxwell Technologies, CAP-XX Limited, Skeleton Technologies, TOKIN Corporation, Ioxus Inc., Panasonic Corporation, Eaton Corporation, LS Mtron, Samwha Capacitor Group, AVX Corporation, Seiko Instruments Inc., Yunasko Ltd., Jianghai Capacitor Co., Ltd., Nippon Chemi-Con Corporation, Murata Manufacturing Co., Ltd., Cornell Dubilier Electronics, KEMET Corporation, Nesscap Energy Inc., Tecate Group, and Shanghai Aowei Technology Development Co., Ltd and others.

Recent Developments:

  • In March 2024, Maxwell Technologies, now integrated with Tesla, launched a 3 500 F, 3.0 V industrial ultracapacitor designed for heavy-duty power systems. This high-capacity device targets grid stabilization, renewable integration, and EV infrastructure, marking a significant leap in energy endurance and thermal resilience.

  • In February 2025, ATX Networks introduced its Areca™ Hybrid Supercapacitor Group 31 Modules at Fiber Connect 2025 in Nashville. These IP65-rated modules (12–48 V) deliver up to 20,000 full-depth-of-discharge cycles and are designed for compact, rugged telecom environments.

Hybrid Supercapacitor Market Report Scope:

Report Attributes Details
Market Size in 2024 USD 1.13 Billion 
Market Size by 2032 USD 2.41 Billion 
CAGR CAGR of 9.94% From 2025 to 2032
Base Year 2024
Forecast Period 2025-2032
Historical Data 2021-2023
Report Scope & Coverage Market Size, Segments Analysis, Competitive Landscape, Regional Analysis, DROC & SWOT Analysis, Forecast Outlook
Key Segments • By Type (Lithium-Ion Capacitors, Lithium Hybrid Capacitors, Composite Capacitors)
• By Component (Electrodes, Electrolytes, Separators, Current Collectors)
• By Application (Automotive, Energy, Consumer Electronics, Aerospace and Industrial Equipment)
• By Energy Density (Low, Medium and High)
Regional Analysis/Coverage North America (US, Canada, Mexico), Europe (Germany, France, UK, Italy, Spain, Poland, Turkey, Rest of Europe), Asia Pacific (China, India, Japan, South Korea, Singapore, Australia,Taiwan, Rest of Asia Pacific), Middle East & Africa (UAE, Saudi Arabia, Qatar, South Africa, Rest of Middle East & Africa), Latin America (Brazil, Argentina, Rest of Latin America)
Company Profiles Maxwell Technologies, CAP-XX Limited, Skeleton Technologies, TOKIN Corporation, Ioxus Inc., Panasonic Corporation, Eaton Corporation, LS Mtron, Samwha Capacitor Group, AVX Corporation, Seiko Instruments Inc., Yunasko Ltd., Jianghai Capacitor Co., Ltd., Nippon Chemi-Con Corporation, Murata Manufacturing Co., Ltd., Cornell Dubilier Electronics, KEMET Corporation, Nesscap Energy Inc., Tecate Group and Shanghai Aowei Technology Development Co., Ltd.

Frequently Asked Questions

Ans: The Hybrid Supercapacitor Market is expected to grow at a CAGR of 9.94% from 2025-2032.

Ans: The Hybrid Supercapacitor Market size was USD 1.13 Billion in 2024 and is expected to reach USD 2.41 Billion by 2032.

Ans: Rising demand for fast-charging, high-power energy storage in electric vehicles, industrial systems, and renewable grids drives market growth.

Ans: The Lithium-Ion Capacitors segment dominated the Hybrid Supercapacitor Market in 2024.

Ans: Asia Pacific dominated the Hybrid Supercapacitor Market in 2024.

Table Of Contents

1. Introduction

1.1 Market Definition & Scope

 1.2 Research Assumptions & Abbreviations

 1.3 Research Methodology

2. Executive Summary

2.1 Market Snapshot

 2.2 Market Absolute $ Opportunity Assessment & Y-o-Y Analysis, 2021–2032

 2.3 Market Size & Forecast, By Segmentation, 2021–2032

  2.3.1 Market Size By Type

  2.3.2 Market Size By Component

 2.4 Market Share & Bps Analysis By Region, 2024

 2.5 Industry Growth Scenarios – Conservative, Likely & Optimistic

 2.6 Industry CxO’s Perspective

3. Market Overview

3.1 Market Dynamics

  3.1.1 Drivers

  3.1.2 Restraints

  3.1.3 Opportunities

  3.1.4 Key Market Trends

 3.2 Industry PESTLE Analysis

 3.3 Key Industry Forces (Porter’s) Impacting Market Growth

 3.4 Industry Supply Chain Analysis

  3.4.1 Raw Material Suppliers

  3.4.2 Manufacturers

  3.4.3 Distributors/Suppliers

  3.4.4 Customers/End-Users

 3.5 Industry Life Cycle Assessment

 3.6 Parent Market Overview

 3.7 Market Risk Assessment

4. Statistical Insights & Trends Reporting

4.1.1 Overview

4.1.1.1 Average selling price (ASP) trends globally and regionally

4.1.1.2 Factors influencing price shifts: component costs, design complexity, brand value

4.1.1.3 Cost vs. retail markup analysis across product categories

4.1.1.4 Seasonal discounting trends (Black Friday, Singles’ Day, etc.)

4.1.1.5 Price tier breakdown: Entry-level, mid-tier, premium

4.1.2 Pricing Analysis & Forecast By Type, 2021–2032

4.1.2.1 Forecast of pricing erosion By Type type due to commoditization

4.1.2.2 Subscription-based pricing forecasts (e.g., Whoop, Fitbit Premium)

4.1.2.3 Bundled pricing trends (e.g., with health insurance, telecom plans)

4.1.2.4 Shifts in average pricing due to sensor upgrades (ECG, SpO2, etc.)

4.1.3 Price Benchmarking By Key Players, 2024

4.1.3.1 Price vs. feature benchmarking of leading brands (e.g., Apple, Fitbit, Huawei, Amazfit)

4.1.3.2 Strategic pricing: penetration pricing (e.g., Xiaomi), skimming (e.g., Garmin)

4.1.3.3 Pricing dispersion across regions for same models

4.1.3.4 Benchmarking of hardware-only vs. device + subscription models

4.2 Regulatory Landscape

4.2.1 Overview

4.2.1.1 Global regulatory maturity level by region

4.2.1.2 Timeline of key regulatory developments affecting wearables

4.2.1.3 Emerging standards for accuracy, safety, and data transmission

4.2.1.4 Ethical concerns in wearable health data collection

4.2.2 Regulatory Trends By Key Countries

4.2.2.1 USA: FDA’s evolving digital health framework, RPM guidelines

4.2.2.2 EU: GDPR compliance in wearable apps; MDR device classification

4.2.2.3 China: Cybersecurity Law implications for cloud-based wearable platforms

4.2.2.4 India: Digital Personal Data Protection Act (DPDP), BIS certification

4.2.2.5 Brazil, Australia, Japan: Health & consumer tech policy landscape

4.2.3 Regulatory Outlook By Type Type

4.2.3.1 Medical-grade smartwatches vs. wellness wearables: classification differences

4.2.3.2 Hearables and data recording/privacy mandates

4.2.3.3 Smart glasses: face capture/AR compliance with privacy laws

4.2.3.4 Cross-border compliance challenges for global brands

4.3 Trade Analysis

4.3.1 Overview

4.3.1.1 Global trade volume and growth trends in wearable electronics

4.3.1.2 Shifts in global supply chains: China+1 strategies

4.3.1.3 Impact of geopolitical tensions (US–China, EU–China) on trade

4.3.1.4 Import/export cost inflation due to semiconductor shortages

4.3.2 Import Analysis (Value & Volume), By Country, 2021–2024

4.3.2.1 Top importing countries By Type segment (e.g., smartwatches vs. smart rings)

4.3.2.2 Import dependency analysis: % domestic vs. foreign procurement

4.3.2.3 Role of Free Trade Agreements (FTAs) in wearable imports

4.3.2.4 Change in importer profiles post-pandemic (e.g., rise in India, LATAM)

4.3.3 Export Analysis (Value & Volume), By Country, 2021–2024

4.3.3.1 Key exporting countries and their share of global exports

4.3.3.2 Exports by ODM/OEMs vs. branded exports

4.3.3.3 Growth in export volume for health-focused vs. fitness-focused devices

4.3.3.4 Decline/growth in component vs. finished goods exports

4.3.4 Major Importing Countries

4.3.4.1 Consumer demographics and spending behavior

4.3.4.2 Tariff analysis for key importing countries

4.3.4.3 Logistics performance and supply chain reliability

4.3.4.4 Government procurement trends (public healthcare or military wearables)

4.3.5 Major Exporting Countries

4.3.5.1 Share of global manufacturing located in China, Vietnam, Taiwan

4.3.5.2 Government support for exports (e.g., tax incentives, subsidies)

4.3.5.3 Export value per unit and profitability by country

4.3.5.4 Export-led innovation hubs and clusters (e.g., Shenzhen, Seoul)

5. Hybrid Supercapacitor Market Segmental Analysis & Forecast, By Type, 2021 – 2032, Value (Usd Billion) & Volume (Litre)

5.1 Introduction

 5.2 Lithium-Ion Capacitors

  5.2.1 Key Trends

  5.2.2 Market Size & Forecast, 2021 – 2032

 5.3 Lithium Hybrid Capacitors

  5.3.1 Key Trends

  5.3.2 Market Size & Forecast, 2021 – 2032

 5.4 Composite Capacitors

  5.4.1 Key Trends

  5.4.2 Market Size & Forecast, 2021 – 2032

6. Hybrid Supercapacitor Market Segmental Analysis & Forecast, By Component, 2021 – 2032, Value (Usd Billion) & Volume (Litre)

    6.1 Introduction

 6.2 Electrodes

  6.2.1 Key Trends

  6.2.2 Market Size & Forecast, 2021 – 2032

 6.3 Electrolytes

  6.3.1 Key Trends

  6.3.2 Market Size & Forecast, 2021 – 2032

 6.4 Separators

  6.4.1 Key Trends

  6.4.2 Market Size & Forecast, 2021 – 2032

    6.5 Current Collectors

  6.5.1 Key Trends

  6.5.2 Market Size & Forecast, 2021 – 2032

7. Hybrid Supercapacitor Market Segmental Analysis & Forecast, By Application, 2021 – 2032, Value (Usd Billion) & Volume (Litre)

    7.1 Introduction

 7.2 Automotive

  7.2.1 Key Trends

  7.2.2 Market Size & Forecast, 2021 – 2032

 7.3 Energy

  7.3.1 Key Trends

  7.3.2 Market Size & Forecast, 2021 – 2032

 7.4 Consumer Electronics

  7.4.1 Key Trends

  7.4.2 Market Size & Forecast, 2021 – 2032

 7.5 Aerospace

  7.5.1 Key Trends

  7.5.2 Market Size & Forecast, 2021 – 2032

    7.6 Industrial Equipment

  7.6.1 Key Trends

  7.6.2 Market Size & Forecast, 2021 – 2032

8. Hybrid Supercapacitor Market Segmental Analysis & Forecast, By Energy Density, 2021 – 2032, Value (Usd Billion) & Volume (Litre)

    8.1 Introduction

 8.2 Low

  8.2.1 Key Trends

  8.2.2 Market Size & Forecast, 2021 – 2032

 8.3 Medium

  8.3.1 Key Trends

  8.3.2 Market Size & Forecast, 2021 – 2032

 8.4 High

  8.4.1 Key Trends

  8.4.2 Market Size & Forecast, 2021 – 2032

9. Hybrid Supercapacitor Market Segmental Analysis & Forecast By Region, 2021 – 2025, Value (Usd Billion) & Volume (Litre)

9.1 Introduction

9.2 North America

 9.2.1 Key Trends

 9.2.2 Hybrid Supercapacitor Market Size & Forecast, By Type, 2021 – 2032

 9.2.3 Hybrid Supercapacitor Market Size & Forecast, By Component, 2021 – 2032

 9.2.4 Hybrid Supercapacitor Market Size & Forecast, By Application, 2021 – 2032

 9.2.5 Hybrid Supercapacitor Market Size & Forecast, By Energy Density, 2021 – 2032

 9.2.6 Hybrid Supercapacitor Market Size & Forecast, By Country, 2021 – 2032

  9.2.6.1 USA

   9.2.6.1.1 Hybrid Supercapacitor Market Size & Forecast, By Type, 2021 – 2032

   9.2.6.1.2 Hybrid Supercapacitor Market Size & Forecast, By Component, 2021 – 2032

   9.2.6.1.3 Hybrid Supercapacitor Market Size & Forecast, By Application, 2021 – 2032

   9.2.6.1.4 Hybrid Supercapacitor Market Size & Forecast, By Energy Density, 2021 – 2032

  9.2.6.2 Canada

   9.2.6.2.1 Hybrid Supercapacitor Market Size & Forecast, By Type, 2021 – 2032

   9.2.6.2.2 Hybrid Supercapacitor Market Size & Forecast, By Component, 2021 – 2032

   9.2.6.2.3 Hybrid Supercapacitor Market Size & Forecast, By Application, 2021 – 2032

   9.2.6.2.4 Hybrid Supercapacitor Market Size & Forecast, By Energy Density, 2021 – 2032

9.3 Europe

 9.3.1 Key Trends

 9.3.2 Hybrid Supercapacitor Market Size & Forecast, By Type, 2021 – 2032

 9.3.3 Hybrid Supercapacitor Market Size & Forecast, By Component, 2021 – 2032

 9.3.4 Hybrid Supercapacitor Market Size & Forecast, By Application, 2021 – 2032

 9.3.5 Hybrid Supercapacitor Market Size & Forecast, By Energy Density, 2021 – 2032

 9.3.6 Hybrid Supercapacitor Market Size & Forecast, By Country, 2021 – 2032

  9.3.6.1 Germany

   9.3.6.1.1 Hybrid Supercapacitor Market Size & Forecast, By Type, 2021 – 2032

   9.3.6.1.2 Hybrid Supercapacitor Market Size & Forecast, By Component, 2021 – 2032

   9.3.6.1.3 Hybrid Supercapacitor Market Size & Forecast, By Application, 2021 – 2032

   9.3.6.1.4 Hybrid Supercapacitor Market Size & Forecast, By Energy Density, 2021 – 2032

  9.3.6.2 UK

   9.3.6.2.1 Hybrid Supercapacitor Market Size & Forecast, By Type, 2021 – 2032

   9.3.6.2.2 Hybrid Supercapacitor Market Size & Forecast, By Component, 2021 – 2032

   9.3.6.2.3 Hybrid Supercapacitor Market Size & Forecast, By Application, 2021 – 2032

   9.3.6.2.4 Hybrid Supercapacitor Market Size & Forecast, By Energy Density, 2021 – 2032

  9.3.6.3 France

   9.3.6.3.1 Hybrid Supercapacitor Market Size & Forecast, By Type, 2021 – 2032

   9.3.6.3.2 Hybrid Supercapacitor Market Size & Forecast, By Component, 2021 – 2032

   9.3.6.3.3 Hybrid Supercapacitor Market Size & Forecast, By Application, 2021 – 2032

   9.3.6.3.4 Hybrid Supercapacitor Market Size & Forecast, By Energy Density, 2021 – 2032

  9.3.6.4 Italy

   9.3.6.4.1 Hybrid Supercapacitor Market Size & Forecast, By Type, 2021 – 2032

   9.3.6.4.2 Hybrid Supercapacitor Market Size & Forecast, By Component, 2021 – 2032

   9.3.6.4.3 Hybrid Supercapacitor Market Size & Forecast, By Application, 2021 – 2032

   9.3.6.4.4 Hybrid Supercapacitor Market Size & Forecast, By Energy Density, 2021 – 2032

  9.3.6.5 Spain

   9.3.6.5.1 Hybrid Supercapacitor Market Size & Forecast, By Type, 2021 – 2032

   9.3.6.5.2 Hybrid Supercapacitor Market Size & Forecast, By Component, 2021 – 2032

   9.3.6.5.3 Hybrid Supercapacitor Market Size & Forecast, By Application, 2021 – 2032

   9.3.6.5.4 Hybrid Supercapacitor Market Size & Forecast, By Energy Density, 2021 – 2032

  9.3.6.6 Russia

   9.3.6.6.1 Hybrid Supercapacitor Market Size & Forecast, By Type, 2021 – 2032

   9.3.6.6.2 Hybrid Supercapacitor Market Size & Forecast, By Component, 2021 – 2032

   9.3.6.6.3 Hybrid Supercapacitor Market Size & Forecast, By Application, 2021 – 2032

   9.3.6.6.4 Hybrid Supercapacitor Market Size & Forecast, By Energy Density, 2021 – 2032

  9.3.6.7 Poland

   9.3.6.7.1 Hybrid Supercapacitor Market Size & Forecast, By Type, 2021 – 2032

   9.3.6.7.2 Hybrid Supercapacitor Market Size & Forecast, By Component, 2021 – 2032

   9.3.6.7.3 Hybrid Supercapacitor Market Size & Forecast, By Application, 2021 – 2032

   9.3.6.7.4 Hybrid Supercapacitor Market Size & Forecast, By Energy Density, 2021 – 2032

  9.3.6.8 Rest of Europe

   9.3.6.8.1 Hybrid Supercapacitor Market Size & Forecast, By Type, 2021 – 2032

   9.3.6.8.2 Hybrid Supercapacitor Market Size & Forecast, By Component, 2021 – 2032

   9.3.6.8.3 Hybrid Supercapacitor Market Size & Forecast, By Application, 2021 – 2032

   9.3.6.8.4 Hybrid Supercapacitor Market Size & Forecast, By Energy Density, 2021 – 2032   

9.4 Asia-Pacific

 9.4.1 Key Trends

 9.4.2 Hybrid Supercapacitor Market Size & Forecast, By Type, 2021 – 2032

 9.4.3 Hybrid Supercapacitor Market Size & Forecast, By Component, 2021 – 2032

 9.4.4 Hybrid Supercapacitor Market Size & Forecast, By Application, 2021 – 2032

 9.4.5 Hybrid Supercapacitor Market Size & Forecast, By Energy Density, 2021 – 2032

 9.4.6 Hybrid Supercapacitor Market Size & Forecast, By Country, 2021 – 2032

  9.4.6.1 China

   9.4.6.1.1 Hybrid Supercapacitor Market Size & Forecast, By Type, 2021 – 2032

   9.4.6.1.2 Hybrid Supercapacitor Market Size & Forecast, By Component, 2021 – 2032

   9.4.6.1.3 Hybrid Supercapacitor Market Size & Forecast, By Application, 2021 – 2032

   9.4.6.1.4 Hybrid Supercapacitor Market Size & Forecast, By Energy Density, 2021 – 2032

  9.4.6.2 India

   9.4.6.2.1 Hybrid Supercapacitor Market Size & Forecast, By Type, 2021 – 2032

   9.4.6.2.2 Hybrid Supercapacitor Market Size & Forecast, By Component, 2021 – 2032

   9.4.6.2.3 Hybrid Supercapacitor Market Size & Forecast, By Application, 2021 – 2032

   9.4.6.2.4 Hybrid Supercapacitor Market Size & Forecast, By Energy Density, 2021 – 2032

  9.4.6.3 Japan

   9.4.6.3.1 Hybrid Supercapacitor Market Size & Forecast, By Type, 2021 – 2032

   9.4.6.3.2 Hybrid Supercapacitor Market Size & Forecast, By Component, 2021 – 2032

   9.4.6.3.3 Hybrid Supercapacitor Market Size & Forecast, By Application, 2021 – 2032

   9.4.6.3.4 Hybrid Supercapacitor Market Size & Forecast, By Energy Density, 2021 – 2032

  9.4.6.4 South Korea

   9.4.6.4.1 Hybrid Supercapacitor Market Size & Forecast, By Type, 2021 – 2032

   9.4.6.4.2 Hybrid Supercapacitor Market Size & Forecast, By Component, 2021 – 2032

   9.4.6.4.3 Hybrid Supercapacitor Market Size & Forecast, By Application, 2021 – 2032

   9.4.6.4.4 Hybrid Supercapacitor Market Size & Forecast, By Energy Density, 2021 – 2032

  9.4.6.5 Australia

   9.4.6.5.1 Hybrid Supercapacitor Market Size & Forecast, By Type, 2021 – 2032

   9.4.6.5.2 Hybrid Supercapacitor Market Size & Forecast, By Component, 2021 – 2032

   9.4.6.5.3 Hybrid Supercapacitor Market Size & Forecast, By Application, 2021 – 2032

   9.4.6.5.4 Hybrid Supercapacitor Market Size & Forecast, By Energy Density, 2021 – 2032

  9.4.6.6 ASEAN Countries

   9.4.6.6.1 Hybrid Supercapacitor Market Size & Forecast, By Type, 2021 – 2032

   9.4.6.6.2 Hybrid Supercapacitor Market Size & Forecast, By Component, 2021 – 2032

   9.4.6.6.3 Hybrid Supercapacitor Market Size & Forecast, By Application, 2021 – 2032

   9.4.6.6.4 Hybrid Supercapacitor Market Size & Forecast, By Energy Density, 2021 – 2032

  9.4.6.7 Rest of Asia-Pacific

   9.4.6.7.1 Hybrid Supercapacitor Market Size & Forecast, By Type, 2021 – 2032

   9.4.6.7.2 Hybrid Supercapacitor Market Size & Forecast, By Component, 2021 – 2032

   9.4.6.7.3 Hybrid Supercapacitor Market Size & Forecast, By Application, 2021 – 2032

   9.4.6.7.4 Hybrid Supercapacitor Market Size & Forecast, By Energy Density, 2021 – 2032

9.5 Latin America

 9.5.1 Key Trends

 9.5.2 Hybrid Supercapacitor Market Size & Forecast, By Type, 2021 – 2032

 9.5.3 Hybrid Supercapacitor Market Size & Forecast, By Component, 2021 – 2032

 9.5.4 Hybrid Supercapacitor Market Size & Forecast, By Application, 2021 – 2032

 9.5.5 Hybrid Supercapacitor Market Size & Forecast, By Energy Density, 2021 – 2032

 9.5.6 Hybrid Supercapacitor Market Size & Forecast, By Country, 2021 – 2032

  9.5.6.1 Brazil

   9.5.6.1.1 Hybrid Supercapacitor Market Size & Forecast, By Type, 2021 – 2032

   9.5.6.1.2 Hybrid Supercapacitor Market Size & Forecast, By Component, 2021 – 2032

   9.5.6.1.3 Hybrid Supercapacitor Market Size & Forecast, By Application, 2021 – 2032

   9.5.6.1.4 Hybrid Supercapacitor Market Size & Forecast, By Energy Density, 2021 – 2032

  9.5.6.2 Argentina

   9.5.6.2.1 Hybrid Supercapacitor Market Size & Forecast, By Type, 2021 – 2032

   9.5.6.2.2 Hybrid Supercapacitor Market Size & Forecast, By Component, 2021 – 2032

   9.5.6.2.3 Hybrid Supercapacitor Market Size & Forecast, By Application, 2021 – 2032

   9.5.6.2.4 Hybrid Supercapacitor Market Size & Forecast, By Energy Density, 2021 – 2032

  9.5.6.3 Mexico

   9.5.6.3.1 Hybrid Supercapacitor Market Size & Forecast, By Type, 2021 – 2032

   9.5.6.3.2 Hybrid Supercapacitor Market Size & Forecast, By Component, 2021 – 2032

   9.5.6.3.3 Hybrid Supercapacitor Market Size & Forecast, By Application, 2021 – 2032

   9.5.6.3.4 Hybrid Supercapacitor Market Size & Forecast, By Energy Density, 2021 – 2032

  9.5.6.4 Colombia

   9.5.6.4.1 Hybrid Supercapacitor Market Size & Forecast, By Type, 2021 – 2032

   9.5.6.4.2 Hybrid Supercapacitor Market Size & Forecast, By Component, 2021 – 2032

   9.5.6.4.3 Hybrid Supercapacitor Market Size & Forecast, By Application, 2021 – 2032

   9.5.6.4.4 Hybrid Supercapacitor Market Size & Forecast, By Energy Density, 2021 – 2032

  9.5.6.5 Rest of Latin America

   9.5.6.5.1 Hybrid Supercapacitor Market Size & Forecast, By Type, 2021 – 2032

   9.5.6.5.2 Hybrid Supercapacitor Market Size & Forecast, By Component, 2021 – 2032

   9.5.6.5.3 Hybrid Supercapacitor Market Size & Forecast, By Application, 2021 – 2032

   9.5.6.5.4 Hybrid Supercapacitor Market Size & Forecast, By Energy Density, 2021 – 2032

9.6 Middle East & Africa

 9.6.1 Key Trends

 9.6.2 Hybrid Supercapacitor Market Size & Forecast, By Type, 2021 – 2032

 9.6.3 Hybrid Supercapacitor Market Size & Forecast, By Component, 2021 – 2032

 9.6.4 Hybrid Supercapacitor Market Size & Forecast, By Application, 2021 – 2032

 9.6.5 Hybrid Supercapacitor Market Size & Forecast, By Energy Density, 2021 – 2032

 9.6.6 Hybrid Supercapacitor Market Size & Forecast, By Country, 2021 – 2032

  9.6.6.1 UAE

   9.6.6.1.1 Hybrid Supercapacitor Market Size & Forecast, By Type, 2021 – 2032

   9.6.6.1.2 Hybrid Supercapacitor Market Size & Forecast, By Component, 2021 – 2032

   9.6.6.1.3 Hybrid Supercapacitor Market Size & Forecast, By Application, 2021 – 2032

   9.6.6.1.4 Hybrid Supercapacitor Market Size & Forecast, By Energy Density, 2021 – 2032

  9.6.6.2 Saudi Arabia

   9.6.6.2.1 Hybrid Supercapacitor Market Size & Forecast, By Type, 2021 – 2032

   9.6.6.2.2 Hybrid Supercapacitor Market Size & Forecast, By Component, 2021 – 2032

   9.6.6.2.3 Hybrid Supercapacitor Market Size & Forecast, By Application, 2021 – 2032

   9.6.6.2.4 Hybrid Supercapacitor Market Size & Forecast, By Energy Density, 2021 – 2032

  9.6.6.3 Qatar

   9.6.6.3.1 Hybrid Supercapacitor Market Size & Forecast, By Type, 2021 – 2032

   9.6.6.3.2 Hybrid Supercapacitor Market Size & Forecast, By Component, 2021 – 2032

   9.6.6.3.3 Hybrid Supercapacitor Market Size & Forecast, By Application, 2021 – 2032

   9.6.6.3.4 Hybrid Supercapacitor Market Size & Forecast, By Energy Density, 2021 – 2032

  9.6.6.4 Egypt

   9.6.6.4.1 Hybrid Supercapacitor Market Size & Forecast, By Type, 2021 – 2032

   9.6.6.4.2 Hybrid Supercapacitor Market Size & Forecast, By Component, 2021 – 2032

   9.6.6.4.3 Hybrid Supercapacitor Market Size & Forecast, By Application, 2021 – 2032

   9.6.6.4.4 Hybrid Supercapacitor Market Size & Forecast, By Energy Density, 2021 – 2032

  9.6.6.5 South Africa

   9.6.6.5.1 Hybrid Supercapacitor Market Size & Forecast, By Type, 2021 – 2032

   9.6.6.5.2 Hybrid Supercapacitor Market Size & Forecast, By Component, 2021 – 2032

   9.6.6.5.3 Hybrid Supercapacitor Market Size & Forecast, By Application, 2021 – 2032

   9.6.6.5.4 Hybrid Supercapacitor Market Size & Forecast, By Energy Density, 2021 – 2032

  9.6.6.6 Rest of Middle East & Africa

   9.6.6.6.1 Hybrid Supercapacitor Market Size & Forecast, By Type, 2021 – 2032

   9.6.6.6.2 Hybrid Supercapacitor Market Size & Forecast, By Component, 2021 – 2032

   9.6.6.6.3 Hybrid Supercapacitor Market Size & Forecast, By Application, 2021 – 2032

   9.6.6.6.4 Hybrid Supercapacitor Market Size & Forecast, By Energy Density, 2021 – 2032

10. Competitive Landscape

 10.1 Key Players' Positioning

 10.2 Competitive Developments

  10.2.1 Key Strategies Adopted (%), By Key Players, 2024

  10.2.2 Year-Wise Strategies & Development, 2021 – 2025

  10.2.3 Number Of Strategies Adopted By Key Players, 2024

 10.3 Market Share Analysis, 2024

 10.4 Product/Service & Application Benchmarking

  10.4.1 Product/Service Specifications & Features By Key Players

  10.4.2 Product/Service Heatmap By Key Players

  10.4.3 Application Heatmap By Key Players

 10.5 Industry Start-Up & Innovation Landscape

 10.6 Key Company Profiles

10.6 Key Company Profiles

 10.6.1 Maxwell Technologies

  10.6.1.1 Company Overview & Snapshot

  10.6.1.2 Product/Service Portfolio

  10.6.1.3 Key Company Financials

  10.6.1.4 SWOT Analysis

 10.6.2 CAP-XX Limited

  10.6.2.1 Company Overview & Snapshot

  10.6.2.2 Product/Service Portfolio

  10.6.2.3 Key Company Financials

  10.6.2.4 SWOT Analysis

 10.6.3 Skeleton Technologies

  10.6.3.1 Company Overview & Snapshot

  10.6.3.2 Product/Service Portfolio

  10.6.3.3 Key Company Financials

  10.6.3.4 SWOT Analysis

 10.6.4 TOKIN Corporation

  10.6.4.1 Company Overview & Snapshot

  10.6.4.2 Product/Service Portfolio

  10.6.4.3 Key Company Financials

  10.6.4.4 SWOT Analysis

 10.6.5 Ioxus Inc.

  10.6.5.1 Company Overview & Snapshot

  10.6.5.2 Product/Service Portfolio

  10.6.5.3 Key Company Financials

  10.6.5.4 SWOT Analysis

 10.6.6 Panasonic Corporation

  10.6.6.1 Company Overview & Snapshot

  10.6.6.2 Product/Service Portfolio

  10.6.6.3 Key Company Financials

  10.6.6.4 SWOT Analysis

 10.6.7 Eaton Corporation

  10.6.7.1 Company Overview & Snapshot

  10.6.7.2 Product/Service Portfolio

  10.6.7.3 Key Company Financials

  10.6.7.4 SWOT Analysis

 10.6.8 LS Mtron

  10.6.8.1 Company Overview & Snapshot

  10.6.8.2 Product/Service Portfolio

  10.6.8.3 Key Company Financials

  10.6.8.4 SWOT Analysis

 10.6.9 Samwha Capacitor Group

  10.6.9.1 Company Overview & Snapshot

  10.6.9.2 Product/Service Portfolio

  10.6.9.3 Key Company Financials

  10.6.9.4 SWOT Analysis

 10.6.10 AVX Corporation

  10.6.10.1 Company Overview & Snapshot

  10.6.10.2 Product/Service Portfolio

  10.6.10.3 Key Company Financials

  10.6.10.4 SWOT Analysis

 10.6.11 Seiko Instruments Inc.

  10.6.11.1 Company Overview & Snapshot

  10.6.11.2 Product/Service Portfolio

  10.6.11.3 Key Company Financials

  10.6.11.4 SWOT Analysis

 10.6.12 Yunasko Ltd.

  10.6.12.1 Company Overview & Snapshot

  10.6.12.2 Product/Service Portfolio

  10.6.12.3 Key Company Financials

  10.6.12.4 SWOT Analysis

 10.6.13 Jianghai Capacitor Co., Ltd.

  10.6.13.1 Company Overview & Snapshot

  10.6.13.2 Product/Service Portfolio

  10.6.13.3 Key Company Financials

  10.6.13.4 SWOT Analysis

 10.6.14 Nippon Chemi-Con Corporation

  10.6.14.1 Company Overview & Snapshot

  10.6.14.2 Product/Service Portfolio

  10.6.14.3 Key Company Financials

  10.6.14.4 SWOT Analysis

 10.6.15 Murata Manufacturing Co., Ltd.

  10.6.15.1 Company Overview & Snapshot

  10.6.15.2 Product/Service Portfolio

  10.6.15.3 Key Company Financials

  10.6.15.4 SWOT Analysis

 10.6.16 Cornell Dubilier Electronics

  10.6.16.1 Company Overview & Snapshot

  10.6.16.2 Product/Service Portfolio

  10.6.16.3 Key Company Financials

  10.6.16.4 SWOT Analysis

 10.6.17 KEMET Corporation

  10.6.17.1 Company Overview & Snapshot

  10.6.17.2 Product/Service Portfolio

  10.6.17.3 Key Company Financials

  10.6.17.4 SWOT Analysis

 10.6.18 Nesscap Energy Inc.

  10.6.18.1 Company Overview & Snapshot

  10.6.18.2 Product/Service Portfolio

  10.6.18.3 Key Company Financials

  10.6.18.4 SWOT Analysis

 10.6.19 Tecate Group

  10.6.19.1 Company Overview & Snapshot

  10.6.19.2 Product/Service Portfolio

  10.6.19.3 Key Company Financials

  10.6.19.4 SWOT Analysis

 10.6.20 Shanghai Aowei Technology Development Co., Ltd.

  10.6.20.1 Company Overview & Snapshot

  10.6.20.2 Product/Service Portfolio

  10.6.20.3 Key Company Financials

  10.6.20.4 SWOT Analysis

11. Analyst Recommendations

 11.1 SNS Insider Opportunity Map

 11.2 Industry Low-Hanging Fruit Assessment

 11.3 Market Entry & Growth Strategy

 11.4 Analyst Viewpoint & Suggestions On Market Growth

12. Assumptions

13. Disclaimer

14. Appendix

 14.1 List Of Tables

 14.2 List Of Figures

An accurate research report requires proper strategizing as well as implementation. There are multiple factors involved in the completion of good and accurate research report and selecting the best methodology to compete the research is the toughest part. Since the research reports we provide play a crucial role in any company’s decision-making process, therefore we at SNS Insider always believe that we should choose the best method which gives us results closer to reality. This allows us to reach at a stage wherein we can provide our clients best and accurate investment to output ratio.

Each report that we prepare takes a timeframe of 350-400 business hours for production. Starting from the selection of titles through a couple of in-depth brain storming session to the final QC process before uploading our titles on our website we dedicate around 350 working hours. The titles are selected based on their current market cap and the foreseen CAGR and growth.


The 5 steps process:

Step 1: Secondary Research:

Secondary Research or Desk Research is as the name suggests is a research process wherein, we collect data through the readily available information. In this process we use various paid and unpaid databases which our team has access to and gather data through the same. This includes examining of listed companies’ annual reports, Journals, SEC filling etc. Apart from this our team has access to various associations across the globe across different industries. Lastly, we have exchange relationships with various university as well as individual libraries.

Secondary Research

Step 2: Primary Research

When we talk about primary research, it is a type of study in which the researchers collect relevant data samples directly, rather than relying on previously collected data.  This type of research is focused on gaining content specific facts that can be sued to solve specific problems. Since the collected data is fresh and first hand therefore it makes the study more accurate and genuine.

We at SNS Insider have divided Primary Research into 2 parts.

Part 1 wherein we interview the KOLs of major players as well as the upcoming ones across various geographic regions. This allows us to have their view over the market scenario and acts as an important tool to come closer to the accurate market numbers. As many as 45 paid and unpaid primary interviews are taken from both the demand and supply side of the industry to make sure we land at an accurate judgement and analysis of the market.

This step involves the triangulation of data wherein our team analyses the interview transcripts, online survey responses and observation of on filed participants. The below mentioned chart should give a better understanding of the part 1 of the primary interview.

Primary Research

Part 2: In this part of primary research the data collected via secondary research and the part 1 of the primary research is validated with the interviews from individual consultants and subject matter experts.

Consultants are those set of people who have at least 12 years of experience and expertise within the industry whereas Subject Matter Experts are those with at least 15 years of experience behind their back within the same space. The data with the help of two main processes i.e., FGDs (Focused Group Discussions) and IDs (Individual Discussions). This gives us a 3rd party nonbiased primary view of the market scenario making it a more dependable one while collation of the data pointers.

Step 3: Data Bank Validation

Once all the information is collected via primary and secondary sources, we run that information for data validation. At our intelligence centre our research heads track a lot of information related to the market which includes the quarterly reports, the daily stock prices, and other relevant information. Our data bank server gets updated every fortnight and that is how the information which we collected using our primary and secondary information is revalidated in real time.

Data Bank Validation

Step 4: QA/QC Process

After all the data collection and validation our team does a final level of quality check and quality assurance to get rid of any unwanted or undesired mistakes. This might include but not limited to getting rid of the any typos, duplication of numbers or missing of any important information. The people involved in this process include technical content writers, research heads and graphics people. Once this process is completed the title gets uploader on our platform for our clients to read it.

Step 5: Final QC/QA Process:

This is the last process and comes when the client has ordered the study. In this process a final QA/QC is done before the study is emailed to the client. Since we believe in giving our clients a good experience of our research studies, therefore, to make sure that we do not lack at our end in any way humanly possible we do a final round of quality check and then dispatch the study to the client.

Key Segments: 

By Type

  • Lithium-Ion Capacitors

  • Lithium Hybrid Capacitors

  • Composite Capacitors

By Component

  • Electrodes

  • Electrolytes

  • Separators

  • Current Collectors

By Application

  • Automotive

  • Energy

  • Consumer Electronics

  • Aerospace

  • Industrial Equipment

By Energy Density

  • Low

  • Medium

  • High

Request for Segment Customization as per your Business Requirement: Segment Customization Request

Regional Coverage:

North America

  • US

  • Canada

Europe

  • Germany

  • UK

  • France

  • Italy

  • Spain

  • Russia

  • Poland

  • Rest of Europe

Asia Pacific

  • China

  • India

  • Japan

  • South Korea

  • Australia

  • ASEAN Countries

  • Rest of Asia Pacific

Middle East & Africa

  • UAE

  • Saudi Arabia

  • Qatar

  • South Africa

  • Rest of Middle East & Africa

Latin America

  • Brazil

  • Argentina

  • Mexico

  • Colombia

  • Rest of Latin America

Request for Country Level Research Report: Country Level Customization Request

Available Customization 

With the given market data, SNS Insider offers customization as per the company’s specific needs. The following customization options are available for the report: 

  • Detailed Volume Analysis 

  • Criss-Cross segment analysis (e.g. Product X Application) 

  • Competitive Product Benchmarking 

  • Geographic Analysis 

  • Additional countries in any of the regions 

  • Customized Data Representation 

  • Detailed analysis and profiling of additional market players

Explore Key Insights.


  • Analyzes market trends, forecasts, and regional dynamics
  • Covers core offerings, innovations, and industry use cases
  • Profiles major players, value chains, and strategic developments
  • Highlights innovation trends, regulatory impacts, and growth opportunities
Request an Analyst Call