Smart Grid Market Size & Growth:
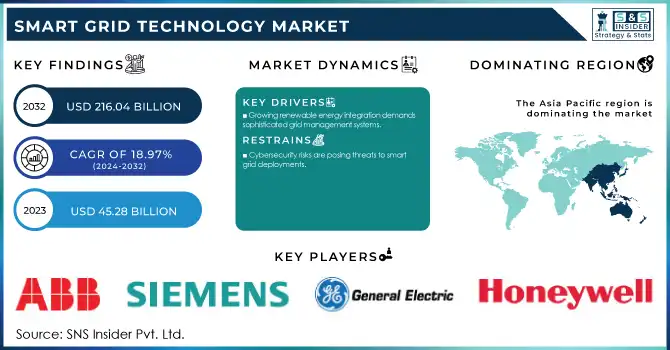
The Smart Grid Market Size was valued at USD 45.28 Billion in 2023 and is expected to reach USD 216.04 Billion by 2032 and grow at a CAGR of 18.97% over the forecast period of 2024-2032.
The smart grid market analysis highlights one of the most significant growth areas for technological advancements in energy systems modernization globally. Growing demand for smart energy management and renewable energy incorporation, and increasing dependence on the strength of the smart grid, motivates governments globally to implement these smart grid structures.
For instance, On October 18, 2024, the U.S. Department of Energy revealed almost USD 2 billion for 38 initiatives aimed at safeguarding the U.S. power grid from escalating risks of severe weather, reducing costs for communities, and enhancing grid capacity to accommodate load growth driven by a rise in manufacturing, data centers, and electrification.
This comprises 14 initiatives chosen under Grid Resilience Utility and Industry Grants. Similarly, India’s Revamped Distribution Sector Scheme, launched in 2023, emphasizes widespread adoption of smart meters and upgrading distribution networks to minimize losses and improve reliability.

Get more information on Smart Grid Technology Market - Request Sample Report
Technological progress has been pivotal, with the adoption of AI, blockchain, and advanced analytics redefining grid operations. In 2023, the EU will roll out new integrated frameworks for renewable energy and electric vehicles that seamlessly integrate with the grid. Japan has accelerated the deployment of grid-scale energy storage in 2024 to mitigate the intermittency of renewable energy and ensure reliable energy supply. Most importantly, the proliferation of IoT devices, smart sensors, and DERMS is continuously improving the efficiency of the grid through real-time data generation, analysis, and decision-making.
Another factor fueling the evolution of the market is the penetration of renewable energy and adoption of EVs. The International Energy Agency estimates that renewables have become the source of more than 30% of global electricity in 2023, demanding high-end grid solutions for stable integration. Furthermore, the rapid adoption of EVs poses unprecedented demand on the grid infrastructure, requiring novel load management systems and vehicle-to-grid technologies for effective balancing of energy flows.
Future prospects include smart grids for decentralized energy systems where consumers can become "prosumers" by producing and trading their own energy. Public-private partnerships are also driving innovation, as governments encourage private investments to increase smart grid deployments. For instance, China remains committed to spending billions of dollars on ultra-high-voltage transmission lines and smart grid projects to absorb its increasing renewable energy capacity.
Smart Grid Technology Market Dynamics:
Drivers:
-
Growing Renewable Energy Incorporation Demands Sophisticated Grid Management Systems Driving Market Growth
By 2030, as renewable energy will exceed 30% of the global supply, normal grids face challenges from variable energy supply. Dynamic energy management in smart grids balances efficient supply and demand. For instance, Germany recorded 46% supply in 2023 of renewable energy, which requires stabilizing the network with intelligent systems. Advanced technologies, such as demand response systems and energy storage integration ensure grid stability despite fluctuating renewable energy inputs. These capabilities are critical for maintaining consistent energy supply, reducing outages, and optimizing energy flow, thus driving the need for smart grid technologies.
-
Increased Electric Vehicles (EV) Adoption Pressures Grid Infrastructure Driving Market Expansion
The International Energy Agency reported that sales of electric vehicles accounted for 18% of total vehicle sales in 2023 and it is also forecasted to grow to 30% by 2030. This marks a tremendous demand on the electrical grid, especially during peak hours of charging, propelling smart grid technology market expansion. Smart grids offer remedies, such as load balancing, time-of-use, and integration into vehicle-to-grid (V2G). For instance, in 2024, China's State Grid Corporation will deploy V2G technologies across major cities that will enable feeding excess energy from EVs into the grid. This symbiosis between EVs and smart grids underlines a need for an intelligent grid system to support an evolving energy landscape.
Restraints:
-
Cybersecurity Risks are Posing Threats to Smart Grid Deployments Hindering Market Expansion
Smart grids rely on highly interconnected systems and digital communication. Cyberattacks will easily target them, and large-scale disruptions could occur through exploiting vulnerabilities in the grid infrastructure. According to reports in 2023, there was a 30% increase in cyber incidents targeting energy infrastructure. Some of the incidents that have caught the attention include ransomware attacks on grid operators in the U.S. and Europe, which pointed out weaknesses in the cybersecurity protocols.
Strong security frameworks, system audits, and investment in advanced threat detection technologies will address this challenge. For instance, the European Union passed the Network Code for cybersecurity in 2024 to increase the grid security standards among member states. Nevertheless, this does not alleviate the challenge due to the evolution of cyber threats persists and calls for continued innovation and vigilance in order to operate smart grids safely and reliably.
Smart Grid Market Segmentation Analysis:
By Technology
In 2023, the wired segment dominated the market with a 69% share based on its reliability and secure data transfer capability. Wired solutions, such as fiber optics and power line communications, are crucial for critical infrastructure that needs steady and high-speed connectivity. They hold a strategic place in tracking and controlling extensive networks of power especially in the city areas.
The wireless segment is anticipated to witness growth with the fastest CAGR of 19.93% in the range from 2024 to 2032 with rising demands for easy and inexpensive systems in hard terrain and far places. With zigbee, lorawan, 5g technology, and wireless also supports immediate real-time exchange between the scattered sources of distributed energy systems, smart meters, and utility providers. This flexibility is important for expanding grid coverage in underserved regions and integrating renewable energy sources. As innovation in wireless communication accelerates, its adoption is set to redefine the scalability and adaptability of smart grid systems globally.
By Application
The distribution segment dominated the Smart Grid Market in 2023, accounting for 39%. This is because of growing interest in reduced energy losses and reliable power supply by advanced distribution management systems. Features, such as real-time monitoring, outage management, and fault detection are driving smart grid solutions for this segment.
Looking ahead, the distribution segment is expected to gain the highest CAGR of 19.24% over 2024-2032 owing to the increased integration of renewable energy sources into local grids and the ubiquitous installation of smart meters. Smart grid technologies in the distribution segment have the potential to transform energy delivery by offering efficient energy distribution and enabling real-time usage awareness among consumers. Increasingly, government initiatives, too, help bolster the smart grid market trend, especially through India's smart meter rollout program, which assists in increasing grid efficiency and involving consumers.
Smart Grid Market Regional Outlook:
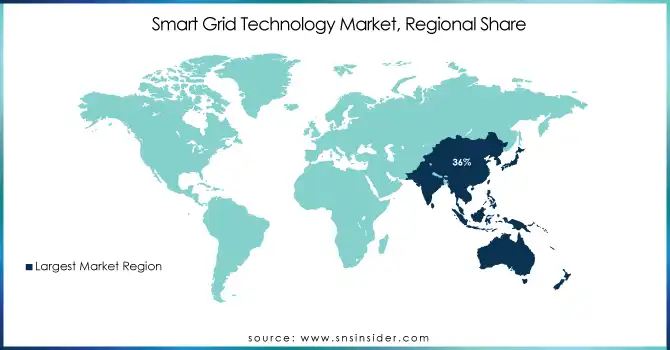
The Asia Pacific region held a dominant smart grid market share of 36% in 2023. This growth is driven by massive government investments in upgrading the grid through the integration of renewables and smart meters. Countries, such as China and India will be at the helm, with mega initiatives including ultra-high voltage transmission projects in China and the National Smart Grid Mission in India.
North America is expected to grow the fastest, with a CAGR of 19.61% over 2024-2032. This growth is driven by the surging penetration of renewable energy, advancements in grid infrastructure, and supportive regulatory frameworks. For instance, the U.S. Department of Energy's Grid Modernization Initiative aims to enhance the resilience of the grid and integrate distributed energy resources.
On October 18, 2023, the U.S. Department of Energy revealed up to USD 3.46 billion in investments through the Grid Resilience and Innovation Partnerships (GRIP) Program for 58 projects spanning 44 states to enhance the resilience and reliability of the electric grid across the U.S. This comprises 16 initiatives chosen through the Grid Resilience Utility and Industry Grants program.
Canada is also gaining momentum, with heavy investments in renewable energy and smart grid pilot projects. Regional trends thus denote the dynamic nature of the smart grid market owing to their tailored strategies and investments in different parts globally.

Need any customization research on Smart Grid Technology Market - Enquire Now
Smart Grid Companies are:
-
ABB (Smart meters, Grid automation systems)
-
General Electric (Grid software, Advanced distribution systems)
-
Siemens (Energy management systems, Distribution automation)
-
Schneider Electric (Microgrid solutions, Smart metering solutions)
-
Hitachi Energy (Grid edge solutions, High-voltage equipment)
-
Honeywell (Demand response systems, Smart thermostats)
-
ITRON (AMI solutions, Smart water management)
-
Cisco Systems (Grid security, IoT connectivity)
-
IBM (Utility analytics, AI for grid optimization)
-
Oracle (Grid management software, Meter data management)
-
Mitsubishi Electric (Advanced SCADA, Grid-scale storage solutions)
-
Landis+Gyr (AMI software, Metering devices)
-
Toshiba (Grid stability systems, HVDC solutions)
-
Eaton (Energy automation, Smart grid hardware)
-
Huawei (Wireless smart grid solutions, IoT-based systems)
-
ABB Power Grids (Substation automation, Digital twin technology)
-
ZIV (Grid monitoring solutions, Fault detection systems)
-
Open Systems International (Real-time grid operations, SCADA systems)
-
S&C Electric (Grid protection devices, Self-healing grid technology)
-
Nexans (Grid connectivity solutions, Cable management systems)
Major Suppliers (Components, Technologies)
-
3M (Conductive tapes, Insulating materials)
-
Dow Chemical (Silicones, Encapsulation resins)
-
BASF (Polymers, Coatings)
-
DuPont (Dielectrics, Advanced materials)
-
Honeywell Materials (Advanced fibers, Insulation)
-
Corning (Glass fibers, Specialty ceramics)
-
Schneider Materials Division (Wiring materials, Connectors)
-
TE Connectivity (Connectors, Terminals)
-
Molex (Power connectors, Networking components)
-
Amphenol (Interconnect systems, Cable assemblies)
Major Clients
-
Duke Energy
-
National Grid
-
Southern Company
-
PG&E
-
Exelon Corporation
-
Enel
-
Tokyo Electric Power Company (TEPCO)
-
Iberdrola
-
E.ON
-
EDF Energy
Smart Grid Market Recent Trends
-
November 2024: Siemens is collaborating with Enemalta to digitally revolutionize Malta's grid by utilizing Siemens' Gridscale X platform. This will improve service, decrease outages, optimize operations, and enhance network management for more than 450,000 individuals.
-
February 2024: GE Appliances, a Haier company, and Savant Systems, Inc., are joining forces to introduce a game-changing whole-home, connected solution that empowers consumers to take control of their energy efficiency and management, as well as offer home builders and homeowners the ability to simplify installation and control everything with an intuitive app.
| Report Attributes | Details |
|---|---|
| Market Size in 2023 | USD 45.28 Billion |
| Market Size by 2032 | USD 216.04 Billion |
| CAGR | CAGR of 18.97% From 2024 to 2032 |
| Base Year | 2023 |
| Forecast Period | 2024-2032 |
| Historical Data | 2020-2022 |
| Report Scope & Coverage | Market Size, Segments Analysis, Competitive Landscape, Regional Analysis, DROC & SWOT Analysis, Forecast Outlook |
| Key Segments | By Components (Software, Service, Hardware), By Technology (Wireless, Wired), By Application (Generation, Distribution, Transmission, Consumption), By End Use (Residential, Industrial, Commercial) |
| Regional Analysis/Coverage | North America (US, Canada, Mexico), Europe (Eastern Europe [Poland, Romania, Hungary, Turkey, Rest of Eastern Europe] Western Europe] Germany, France, UK, Italy, Spain, Netherlands, Switzerland, Austria, Rest of Western Europe]), Asia Pacific (China, India, Japan, South Korea, Vietnam, Singapore, Australia, Rest of Asia Pacific), Middle East & Africa (Middle East [UAE, Egypt, Saudi Arabia, Qatar, Rest of Middle East], Africa [Nigeria, South Africa, Rest of Africa], Latin America (Brazil, Argentina, Colombia, Rest of Latin America) |
| Company Profiles | ABB, General Electric, Siemens, Schneider Electric, Hitachi Energy, Honeywell, Itron, Cisco Systems, IBM, Oracle, Mitsubishi Electric, Landis+Gyr, Toshiba, Eaton, Huawei, ABB Power Grids, ZIV, Open Systems International, S&C Electric, Nexans. |
| Key Drivers | • Growing renewable energy integration demands sophisticated grid management systems. • Increased electric vehicle (EV) adoption pressures grid infrastructure. |
| Restraints | • Cybersecurity risks are posing threats to smart grid deployments. |

