image

I2C Bus Market Report Scope & Overview:

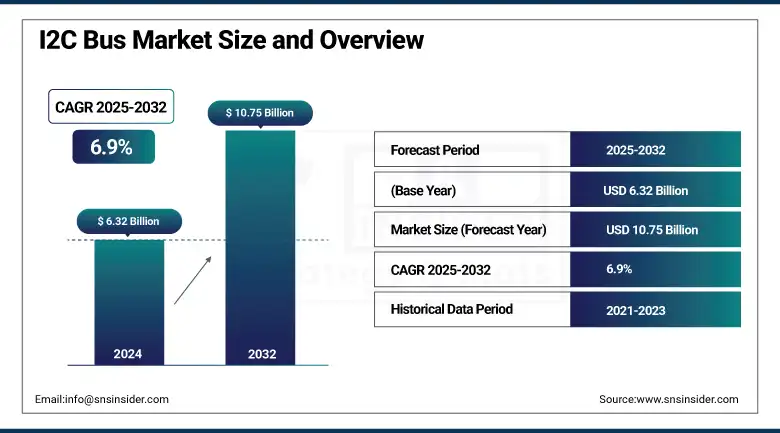
The I2C Bus Market size was valued at USD 6.32 billion in 2024 and is expected to reach USD 10.75 billion by 2032, expanding at a CAGR of 6.9% over the forecast period of 2025-2032.

The I2C (Inter-Integrated Circuit) Bus Market is growing because most embedded system designs require a simple, elegant, low-speed, short-distance communication method means that I2C will always have a place in the system; it is not intended for long-distance communication or high bandwidth applications. For consumer electronics, automotive, industrial, and IoT applications, the two-wire architecture also enables easy multi-device connectivity. Use of sensors and microcontrollers is increasing day by day, and I2C is widely used due to its simplicity, scalability, and low power consumption. Fast-mode Plus and other enhanced variants are broadening their use, while legacy support is ensuring ubiquity. While I3C is a new interconnect type on the horizon and there are alternatives like SPI, I2C is still ideal for high-volume electronics and smart device ecosystems where affordability and small footprint are important.

According to research, I2C is preferred in battery-powered, edge AI, and wearable devices, offering up to 30% lower power consumption and supporting over 60–80% of sensor communication due to its efficiency and scalability.

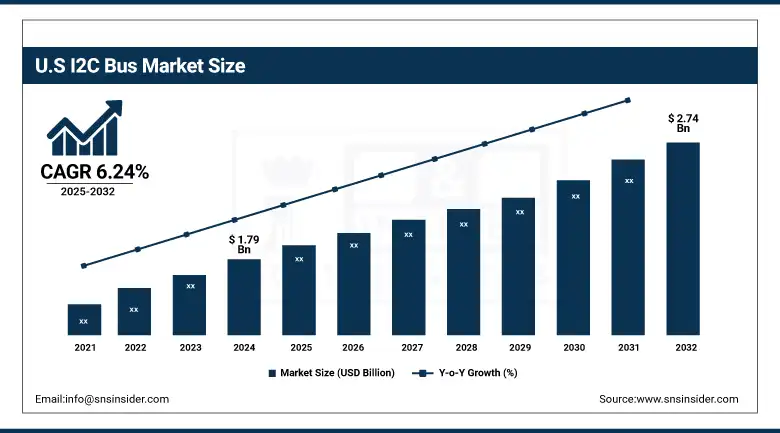
The U.S I2C Bus Market size reached USD 1.79 billion in 2024 and is expected to reach USD 2.74 billion in 2032 at a CAGR of 6.24% from 2025 to 2032.

The U.S. dominates the global I2C bus market due to the growth of its semiconductor I2C bus market industry, the presence of various key market players, and the high demand for embedded systems in automotive, aerospace, and consumer electronics. The proliferation of smart devices, the growing implementation of IoT solutions, and the rising need for compact and efficient communication protocols are among the crucial factors driving the I2C Bus Market growth of the market. The expansion of the U.S. I2C market is driven by additional government support for domestic chip manufacturing, along with continued innovation in automation and medical electronics.

Market Dynamics:

Drivers:

  • Increased Integration of Embedded Systems in Consumer Electronics and Automotive Enhances Communication Interface Adoption

With consumer electronics and automotive systems becoming increasingly sophisticated, the demand for embedded communication including I2C is growing even faster. Since devices demand effortless, low-power interconnections between several sensors, displays, and microcontrollers, I2C is the protocol of choice with its two-wire, low-power, and multi-slave scalability. The increasing trend of electric vehicles and advanced driver-assistance systems (ADAS) in the automotive sector is urging the integration of components enabled with I2C, a communication option. Recent I2C bus market trends indicate increasing adoption in IoT and automotive sectors due to its low power consumption and scalability.

According to research, approximately 85% of smart home hubs and controllers use I2C buses to manage multi-sensor arrays and peripheral devices efficiently.

Restraints:

  • Limited Data Rate and Communication Speed Restricts Suitability for High-Performance Applications in Industrial and Commercial Systems

I2C is straightforward and inexpensive, it has a low transfer rate it rarely exceeding 3.4 Mbps in high-speed modes, which is not suitable for applications where you desire fast and massive data throughput. Protocols, such as SPI or Ethernet are preferred for their better performance in high-performance systems including industrial automation and high-end computing platforms. As devices become increasingly data-dependent, this limitation becomes a heavy constraint. As a result, performance reliability, particularly in time-sensitive circumstances, also suffers from clock stretching, bus contention, and from a poor multi-master capability.

Opportunities:

  • Rising Adoption of Smart and Connected Devices in IoT Ecosystems Presents Growth Potential for Low-Power Communication Protocols

The growing penetration of IoT applications in home, factory, and clinic setups is providing significant growth opportunities for low-power, small-size communication standards such as I2C. Being smart devices, internal interconnects among the different elements making up the device, including sensors, processors, and displays, are numerous, and I2C is popular as it can have minimal wiring and power usage. Applications, such as Smart metering, remote environmental monitoring, and wearable medical devices have recently deployed I2C.

Challenges:

  • Complexity in Managing Multiple Slave Devices on a Shared Bus Increases Design and Debugging Challenges for Developers

Managing the integrity of communications becomes increasingly difficult as systems scale and the number of I2C slave devices that are connected increases. Long trace lengths, excessive electrical noise, or both can cause problems like address clashes, bus arbitration, and signal degradation. Solving these issues requires careful timing, custom board development, and often more debugging time than you have planned for, pushing out your development schedule and increasing costs. In addition, similar to all standard I2Cs, there are no built-in error-checking mechanisms in I3C that can detect a malfunction while in operation.

Segmentation Analysis

By Type

In 2024, the Unidirectional I2C Bus segment held the largest revenue share of 55.30% due to its large-scale provision in applications with straightforward, single-direction data transmission from master to slave devices. Providing lower design overhead, it is implemented in low-cost and low-power systems, such as wearables or devices of home automation. For improved connectivity, I2C bus market companies, such as NXP Semiconductors and Microchip Technology have introduced I2C-compatible unidirectional microcontrollers and EEPROMs.

The Bidirectional I2C Bus segment is expected to witness the fastest CAGR of 8.50% due to the need for flexible, two-way data communication in smart devices, automotive electronics, and industrial automation systems. The easy, bi-directional switching of master-slave roles and real-time data feedback capabilities are both indispensable assets in complex embedded applications. Advanced bidirectional transceivers for high-reliability systems and I2C expanders with very high temperature functionality were introduced by companies, such as NXP Semiconductors and Microchip Technology.

By Data Transfer Modes

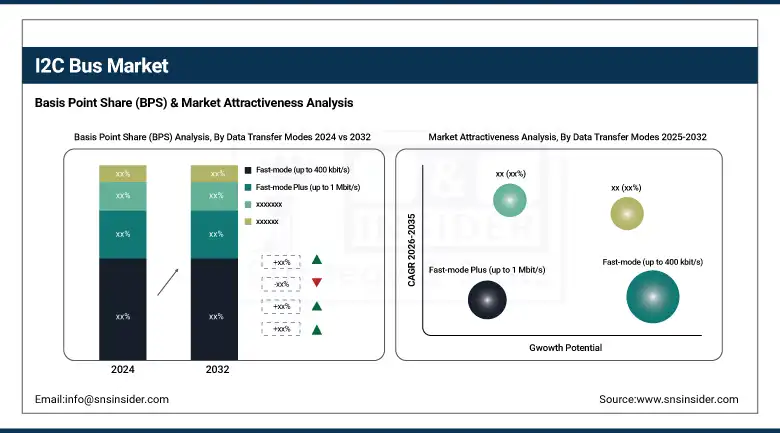
The Fast-mode (up to 400 kbit/s) segment accounted for the largest revenue share in 2024 at 25.13%, as it offers a good balance between speed and reliability for mass-market applications. It is prevalent in consumer electronics, memory modules, and sensor interfaces. To meet the growth stemming from home automation, smart appliance companies have launched Fast-mode compatible ICs, such as those from Texas Instruments and Renesas Electronics. A key driver is the growing demand for medium-speed communication in devices with a moderate level of complexity.

The Fast-mode Plus (up to 1 Mbit/s) is projected to be the fastest-growing segment with a CAGR of 8.81% during the forecast period, owing to the increasing demand for rapid communication in the identified applications with advanced sensor arrays, industrial control systems, and infotainment modules. Some of the latest products are Analog Devices’ high-speed I2C-compatible digital isolators for rugged industrial applications. It enables longer cables and higher capacitance; thus, this mode supports a more flexible system design.

By Application

The SMBus held the fastest share in 2024 at 31.52% and is important for monitoring and management components, thus system health and status in computers, servers, and battery systems. The key factors driving the market include the rising need for thermal and voltage management in data centres and laptops. SMBus has been incorporated by companies including Intel and ON Semiconductor directly into power management ICs and processor support chips. Its compatibility with existing I2C infrastructure and widespread use in servers and industrial systems strengthens its dynamic role in expanding Inter-Integrated Circuit (I2C) Bus Market applications.

The PMBus segment is anticipated to post the fastest CAGR of 8.81% over the forecast period due to the growing requirement for smart power supply monitoring in telecom, data centers, and industrial automation. It enables power supply units to be configured and faulted in real-time, improving reliability and energy efficiency. Examples include PMBus power modules for cloud infrastructure from Infineon Technologies and Monolithic Power Systems. PMBus provides scalable, programmable solutions that are ideally matched to increasing power density, operational complexity, and green energy mandates.

Regional Analysis:

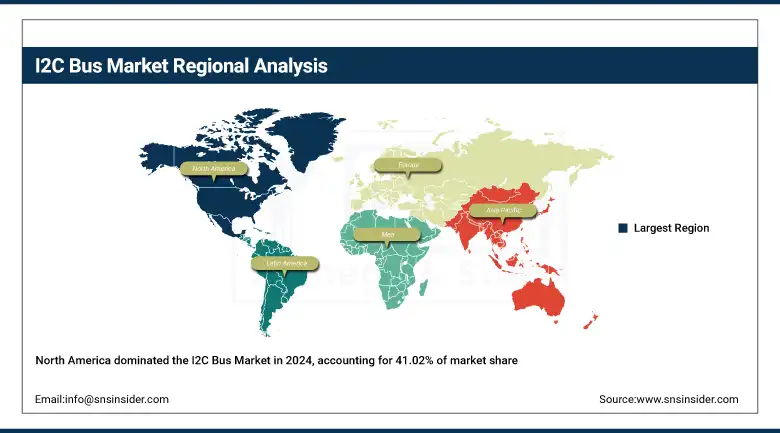
North America leads the market, accounting for 41.02% of market share, owing to a strong consumer electronics industry, an innovative automotive industry, and a developing industrial automation segment. This shift toward I2C-enabled legacy and next-gen applications, such as IoT and smart healthcare, is propelled by the region’s advanced semiconductor infrastructure and strong R&D capabilities.

The U.S. will continue to lead the regional space given its robust semiconductor manufacturing base, technological know-how, and large usage of I2C across automotive, aerospace, and medical equipment.

Europe Market develops the shooting of automobile hardware, with the demand for efficient integrated solutions and industrial management systems. Driven by sustainable initiatives and intelligent infrastructure, the area implements I2C in other sensor networks, EV components, and energy monitoring applications, aided by an increasing number of private and public collaborations.

Germany is the leader due to the automotive innovation, the engineering ecosystem, and the use of I2C in precision engineering and Industry 4.0.

Asia Pacific is the fastest-growing region with a CAGR of 9.46% over the forecast period, owing to the high-volume production of electronics-intensive products, IoT expansion, and favourable government initiatives for domestic semiconductor ecosystem development. Low production costs with the availability of OEMs will propel the adoption of I2C in smartphones, wearables, and industrial automation equipment.

China drives innovation, powered by a massive consumer electronics manufacturing base, rapid industrial digitalization, and major investments in chip fab and smart device ecosystems.

The Middle East & Africa and Latin America is expected to grow steadily over the forecast period, owing to the automation investments, Smart city initiatives, emergence of embedded systems in Industrial, automotive, and agriculture applications.

Key Players:

The major key players of the I2C Bus Market are Texas Instruments Incorporated, NXP Semiconductors N.V., STMicroelectronics N.V., Analog Devices, Inc., ON Semiconductor Corporation, Renesas Electronics Corporation, Microchip Technology Inc., Infineon Technologies AG, Broadcom Inc., Maxim Integrated Products, Inc., and others.

Key Developments:

  • In May 2024, Infineon Technologies introduced a new NFC-to-I2C bridge tag providing secure, Contactless configuration and authentication for IoT devices, and boosting security by making setup easier in smart homes and wearables.

  • in April 2024, NXP Semiconductors recorded a 5% year-over-year fall in revenue to USD12.61 billion but retained healthy margins and revealed a USD 307 million purchase of Kinara to augment edge AI functionality.

I2C Bus Market Report Scope:

Report Attributes Details
Market Size in 2024 USD 6.32 Billion 
Market Size by 2032 USD 10.75 Billion 
CAGR CAGR of 6.9% from 2025 to 2032
Base Year 2024
Forecast Period 2025-2032
Historical Data 2021-2023
Report Scope & Coverage Market Size, Segments Analysis, Competitive Landscape, Regional Analysis, DROC & SWOT Analysis, Forecast Outlook
Key Segments •By Type (Bidirectional I2C Bus, Unidirectional I2C Bus)
•By Data Transfer Modes (Standard-mode, Fast-mode, Fast-mode Plus, High-speed mode, Ultra-fast mode)
•By Application (System Management Bus (SMBus), Power Management Bus (PMBus), Intelligent Platform Management Interface (IPMI), Display Data Channel (DDC), Advanced Telecom Computing Architecture (ATCA))
Regional Analysis/Coverage North America (US, Canada, Mexico), Europe (Germany, France, UK, Italy, Spain, Poland, Turkey, Rest of Europe), Asia Pacific (China, India, Japan, South Korea, Singapore, Australia, Rest of Asia Pacific), Middle East & Africa (UAE, Saudi Arabia, Qatar, South Africa, Rest of Middle East & Africa), Latin America (Brazil, Argentina, Rest of Latin America)
Company Profiles Texas Instruments Incorporated, NXP Semiconductors N.V., STMicroelectronics N.V., Analog Devices, Inc., ON Semiconductor Corporation, Renesas Electronics Corporation, Microchip Technology Inc., Infineon Technologies AG, Broadcom Inc., Maxim Integrated Products, Inc.

Frequently Asked Questions

Answer: The I2C Bus Market is expected to expand at a CAGR of 6.9% over the forecast period from 2025 to 2032.

Answer: The market size of the I2C Bus Market in 2024 was USD 6.32 billion.

Answer: The major growth factor is the increased integration of embedded systems

Answer: The Unidirectional I2C Bus segment dominated the market in 2024, holding the largest revenue share of 55.30%, due to its widespread use in simple, single-direction data transmission applications like wearables and home automation.

Answer: North America dominated the I2C Bus Market in 2024, accounting for 41.02% of the market share, driven by strong growth in consumer electronics, automotive, and industrial automation sectors.

Table of Contents

1. Introduction

1.1 Market Definition

1.2 Scope (Inclusion and Exclusions)

1.3 Research Assumptions

2. Executive Summary

2.1 Market Overview

2.2 Regional Synopsis

2.3 Competitive Summary

3. Research Methodology

3.1 Top-Down Approach

3.2 Bottom-up Approach

3.3. Data Validation

3.4 Primary Interviews

4. Market Dynamics Impact Analysis

4.1 Market Driving Factors Analysis

4.1.1 Drivers

4.1.2 Restraints

4.1.3 Opportunities

4.1.4 Challenges

4.2 PESTLE Analysis

4.3 Porter’s Five Forces Model

5. Statistical Insights and Trends Reporting

5.1 Average Number of I2C Nodes per Device

5.2 I2C Error Rate in Field Deployments

5.3 I2C Pin Utilization Efficiency

5.4 Transition Rate from I2C to I3C

6. Competitive Landscape

6.1 List of Major Companies, By Region

6.2 Market Share Analysis, By Region

6.3 Product Benchmarking

6.3.1 Product specifications and features

6.3.2 Pricing

6.4 Strategic Initiatives

6.4.1 Marketing and promotional activities

6.4.2 Distribution and Supply Chain Strategies

6.4.3 Expansion plans and new Product launches

6.4.4 Strategic partnerships and collaborations

6.5 Technological Advancements

6.6 Market Positioning and Branding

7. I2C Bus Market Segmentation By Type

7.1 Chapter Overview

7.2 UNIDIRECTIONAL I2C BUS

7.2.1 UNIDIRECTIONAL I2C BUS Market Trends Analysis (2021-2032)

7.2.2 UNIDIRECTIONAL I2C BUS Market Size Estimates and Forecasts to 2032 (USD Billion)

7.3 Bidirectional I2C Bus

     7.3.1 Bidirectional I2C Bus Market Trends Analysis (2021-2032)

           7.3.2 Bidirectional I2C Bus Market Size Estimates and Forecasts to 2032 (USD Billion)

8. I2C Bus Market Segmentation By Data Transfer Modes

8.1 Chapter Overview

8.2 Standard-mode (up to 100 kbit/s)

     8.2.1 Standard-mode (up to 100 kbit/s) Market Trend Analysis (2021-2032)

           8.2.2 Standard-mode (up to 100 kbit/s) Market Size Estimates and Forecasts to 2032 (USD Billion)

8.3 Fast-mode (up to 400 kbit/s)

      8.3.1 Fast-mode (up to 400 kbit/s) Market Trends Analysis (2021-2032)

           8.3.2 Fast-mode (up to 400 kbit/s) Market Size Estimates and Forecasts to 2032 (USD Billion)

8.4 Fast-mode Plus (up to 1 Mbit/s)

      8.4.1 Fast-mode Plus (up to 1 Mbit/s) Market Trends Analysis (2021-2032)

           8.4.2 Fast-mode Plus (up to 1 Mbit/s) Market Size Estimates and Forecasts to 2032 (USD Billion)

8.5 High-speed mode (up to 3.4 Mbit/s)

      8.5.1 High-speed mode (up to 3.4 Mbit/s) Market Trends Analysis (2021-2032)

           8.5.2 High-speed mode (up to 3.4 Mbit/s) Market Size Estimates and Forecasts to 2032 (USD Billion)

8.6 Ultra-fast mode (up to 5 Mbit/s)

      8.6.1 Ultra-fast mode (up to 5 Mbit/s) Market Trends Analysis (2021-2032)

           8.6.2 Ultra-fast mode (up to 5 Mbit/s) Market Size Estimates and Forecasts to 2032 (USD Billion)

9. I2C Bus Market Segmentation By Application

9.1 Chapter Overview

9.2 System Management Bus (SMBus)

        9.2.1 System Management Bus (SMBus) Market Trends Analysis (2021-2032)

9.2.2 System Management Bus (SMBus) Market Size Estimates and Forecasts to 2032 (USD Billion)

9.3 Power Management Bus (PMBus)

        9.3.1 Power Management Bus (PMBus) Market Trends Analysis (2021-2032)

9.3.2 Power Management Bus (PMBus) Market Size Estimates and Forecasts to 2032 (USD Billion)

9.4 Intelligent Platform Management Interface (IPMI)

        9.4.1 Intelligent Platform Management Interface (IPMI) Market Trends Analysis (2021-2032)

9.4.2 Intelligent Platform Management Interface (IPMI) Market Size Estimates and Forecasts to 2032 (USD Billion)

9.5 Display Data Channel (DDC)

        9.5.1 Display Data Channel (DDC) Market Trends Analysis (2021-2032)

9.5.2 Display Data Channel (DDC) Market Size Estimates and Forecasts to 2032 (USD Billion)

9.6 Advanced Telecom Computing Architecture (ATCA)

        9.6.1 Advanced Telecom Computing Architecture (ATCA) Market Trends Analysis (2021-2032)

9.6.2 Advanced Telecom Computing Architecture (ATCA) Market Size Estimates and Forecasts to 2032 (USD Billion)

10. Regional Analysis

10.1 Chapter Overview

10.2 North America

10.2.1 Trends Analysis

10.2.2 North America I2C Bus Market Estimates and Forecasts, by Country (2021-2032) (USD Billion)

10.2.3 North America I2C Bus Market Estimates and Forecasts, By Type (2021-2032) (USD Billion) 

10.2.4 North America I2C Bus Market Estimates and Forecasts, By Data Transfer Modes (2021-2032) (USD Billion)

10.2.5 North America I2C Bus Market Estimates and Forecasts, By Application (2021-2032) (USD Billion)

10.2.6 USA

10.2.6.1 USA I2C Bus Market Estimates and Forecasts, By Type (2021-2032) (USD Billion)

10.2.6.2 USA I2C Bus Market Estimates and Forecasts, By Data Transfer Modes (2021-2032) (USD Billion)

10.2.6.3 USA I2C Bus Market Estimates and Forecasts, By Application (2021-2032) (USD Billion)

10.2.7 Canada

10.2.7.1 Canada I2C Bus Market Estimates and Forecasts, By Type (2021-2032) (USD Billion)

10.2.7.2 Canada I2C Bus Market Estimates and Forecasts, By Data Transfer Modes (2021-2032) (USD Billion)

10.2.7.3 Canada I2C Bus Market Estimates and Forecasts, By Application (2021-2032) (USD Billion)

10.2.8 Mexico

10.2.8.1 Mexico I2C Bus Market Estimates and Forecasts, By Type (2021-2032) (USD Billion)

10.2.8.2 Mexico I2C Bus Market Estimates and Forecasts, By Data Transfer Modes (2021-2032) (USD Billion)

10.2.8.3 Mexico I2C Bus Market Estimates and Forecasts, By Application (2021-2032) (USD Billion)

10.3 Europe

10.3.1 Trends Analysis

10.3.2 Europe I2C Bus Market Estimates and Forecasts, by Country (2021-2032) (USD Billion)

10.3.3 Europe I2C Bus Market Estimates and Forecasts, By Type (2021-2032) (USD Billion) 

10.3.4 Europe I2C Bus Market Estimates and Forecasts, By Data Transfer Modes (2021-2032) (USD Billion)

10.3.5 Europe I2C Bus Market Estimates and Forecasts, By Application(2021-2032) (USD Billion)

10.3.6 Germany

10.3.1.6.1 Germany I2C Bus Market Estimates and Forecasts, By Type (2021-2032) (USD Billion)

10.3.1.6.2 Germany I2C Bus Market Estimates and Forecasts, By Data Transfer Modes (2021-2032) (USD Billion)

10.3.1.6.3 Germany I2C Bus Market Estimates and Forecasts, By Application (2021-2032) (USD Billion)

10.3.7 France

10.3.7.1 France I2C Bus Market Estimates and Forecasts, By Type (2021-2032) (USD Billion)

10.3.7.2 France a I2C Bus Market Estimates and Forecasts, By Data Transfer Modes (2021-2032) (USD Billion)

10.3.7.3 France I2C Bus Market Estimates and Forecasts, By Application (2021-2032) (USD Billion)

10.3.8 UK

10.3.8.1 UK I2C Bus Market Estimates and Forecasts, By Type (2021-2032) (USD Billion)

10.3.8.2 UK I2C Bus Market Estimates and Forecasts, By Data Transfer Modes (2021-2032) (USD Billion)

10.3.8.3 UK I2C Bus Market Estimates and Forecasts, By Application (2021-2032) (USD Billion)

10.3.9 Italy

10.3.9.1 Italy I2C Bus Market Estimates and Forecasts, By Type (2021-2032) (USD Billion)

10.3.9.2 Italy I2C Bus Market Estimates and Forecasts, By Data Transfer Modes (2021-2032) (USD Billion)

10.3.9.3 Italy I2C Bus Market Estimates and Forecasts, By Application (2021-2032) (USD Billion)

10.3.10 Spain

10.3.10.1 Spain I2C Bus Market Estimates and Forecasts, By Type (2021-2032) (USD Billion)

10.3.10.2 Spain I2C Bus Market Estimates and Forecasts, By Data Transfer Modes (2021-2032) (USD Billion)

10.3.10.3 Spain I2C Bus Market Estimates and Forecasts, By Application (2021-2032) (USD Billion)

10.3.12 Poland

10.3.12.1 Poland I2C Bus Market Estimates and Forecasts, by Country (2021-2032) (USD Billion)

10.3.12.1 Poland I2C Bus Market Estimates and Forecasts, By Type (2021-2032) (USD Billion) 

10.3.12.3 Poland I2C Bus Market Estimates and Forecasts, By Data Transfer Modes (2021-2032) (USD Billion)

10.3.12.3 Poland I2C Bus Market Estimates and Forecasts, By Application (2021-2032) (USD Billion)

10.3.13 Turkey

10.3.13.1 Turkey I2C Bus Market Estimates and Forecasts, By Type (2021-2032) (USD Billion)

10.3.13.2 Turkey I2C Bus Market Estimates and Forecasts, By Data Transfer Modes (2021-2032) (USD Billion)

10.3.13.3 Turkey I2C Bus Market Estimates and Forecasts, By Application (2021-2032) (USD Billion)

10.3.14 Rest of Europe

10.3.14.1 Rest of Europe I2C Bus Market Estimates and Forecasts, By Type (2021-2032) (USD Billion)

10.3.14.2 Rest of Europe I2C Bus Market Estimates and Forecasts, By Data Transfer Modes (2021-2032) (USD Billion)

10.3.14.3 Rest of Europe I2C Bus Market Estimates and Forecasts, By Application(2021-2032) (USD Billion)

10.4 Asia-Pacific

10.4.1 Trends Analysis

  10.4.2 Asia-Pacific I2C Bus Market Estimates and Forecasts, by Country (2021-2032) (USD Billion)

 10.4.3 Asia-Pacific I2C Bus Market Estimates and Forecasts, By Type (2021-2032) (USD Billion) 

 10.4.4 Asia-Pacific I2C Bus Market Estimates and Forecasts, By Data Transfer Modes (2021-2032) (USD Billion)

 10.4.5 Asia-Pacific I2C Bus Market Estimates and Forecasts, By Application (2021-2032) (USD Billion)

10.4.6 China

10.4.6.1 China I2C Bus Market Estimates and Forecasts, By Type (2021-2032) (USD Billion)

10.4.6.2 China I2C Bus Market Estimates and Forecasts, By Data Transfer Modes (2021-2032) (USD Billion)

10.4.6.3 China I2C Bus Market Estimates and Forecasts, By Application (2021-2032) (USD Billion)

10.4.7 India

10.4.7.1 India I2C Bus Market Estimates and Forecasts, By Type (2021-2032) (USD Billion)

10.4.7.2 India I2C Bus Market Estimates and Forecasts, By Data Transfer Modes (2021-2032) (USD Billion)

10.4.7.3 India I2C Bus Market Estimates and Forecasts, By Application (2021-2032) (USD Billion)

10.4.8 Japan

10.4.8.1 Japan I2C Bus Market Estimates and Forecasts, By Type (2021-2032) (USD Billion)

10.4.8.2 Japan I2C Bus Market Estimates and Forecasts, By Data Transfer Modes (2021-2032) (USD Billion)

10.4.8.3 Japan I2C Bus Market Estimates and Forecasts, By Application (2021-2032) (USD Billion)

10.4.9 South Korea

10.4.9.1 South Korea I2C Bus Market Estimates and Forecasts, By Type (2021-2032) (USD Billion)

10.4.9.2 South Korea I2C Bus Market Estimates and Forecasts, By Data Transfer Modes (2021-2032) (USD Billion)

10.4.9.3 South Korea I2C Bus Market Estimates and Forecasts, By Application (2021-2032) (USD Billion)

10.4.10 Singapore

10.4.10.1 Singapore I2C Bus Market Estimates and Forecasts, By Type (2021-2032) (USD Billion)

10.4.10.2 Singapore I2C Bus Market Estimates and Forecasts, By Data Transfer Modes (2021-2032) (USD Billion)

10.4.10.3 Singapore I2C Bus Market Estimates and Forecasts, By Application (2021-2032) (USD Billion)

10.4.11 Australia

10.4.11.1 Australia I2C Bus Market Estimates and Forecasts, By Type (2021-2032) (USD Billion)

10.4.11.2 Australia I2C Bus Market Estimates and Forecasts, By Data Transfer Modes (2021-2032) (USD Billion)

10.4.11.3 Australia I2C Bus Market Estimates and Forecasts, By Application (2021-2032) (USD Billion)

10.4.12 Rest of Asia-Pacific

10.4.12.1 Rest of Asia-Pacific I2C Bus Market Estimates and Forecasts, By Type (2021-2032) (USD Billion)

10.4.12.2 Rest of Asia-Pacific I2C Bus Market Estimates and Forecasts, By Data Transfer Modes (2021-2032) (USD Billion)

10.4.12.3 Rest of Asia-Pacific I2C Bus Market Estimates and Forecasts, By Application (2021-2032) (USD Billion)

10.5 Middle East and Africa

10.5.1 Trends Analysis

10.5.2 Middle East and Africa East I2C Bus Market Estimates and Forecasts, by Country (2021-2032) (USD Billion)

10.5.3Middle East and Africa I2C Bus Market Estimates and Forecasts, By Type (2021-2032) (USD Billion) 

10.5.4 Middle East and Africa I2C Bus Market Estimates and Forecasts, By Data Transfer Modes (2021-2032) (USD Billion)

10.5.5 Middle East and Africa I2C Bus Market Estimates and Forecasts, By Application (2021-2032) (USD Billion)

10.5.6 UAE

10.5.6.1 UAE I2C Bus Market Estimates and Forecasts, By Type (2021-2032) (USD Billion)

10.5.6.2 UAE I2C Bus Market Estimates and Forecasts, By Data Transfer Modes (2021-2032) (USD Billion)

10.5.6.3 UAE I2C Bus Market Estimates and Forecasts, By Application (2021-2032) (USD Billion)

10.5.7 Saudi Arabia

10.5.7.1 Saudi Arabia I2C Bus Market Estimates and Forecasts, By Type (2021-2032) (USD Billion)

10.5.7.2 Saudi Arabia I2C Bus Market Estimates and Forecasts, By Data Transfer Modes (2021-2032) (USD Billion)

10.5.7.3 Saudi Arabia I2C Bus Market Estimates and Forecasts, By Application (2021-2032) (USD Billion)

10.5.8 Qatar

10.5.8.1 Qatar I2C Bus Market Estimates and Forecasts, By Type (2021-2032) (USD Billion)

10.5.8.2 Qatar I2C Bus Market Estimates and Forecasts, By Data Transfer Modes (2021-2032) (USD Billion)

10.5.8.3 Qatar I2C Bus Market Estimates and Forecasts, By Application (2021-2032) (USD Billion)

10.5.9 South Africa

10.5.9 1 South Africa I2C Bus Market Estimates and Forecasts, By Type (2021-2032) (USD Billion)

10.5.9 2 South Africa I2C Bus Market Estimates and Forecasts By Data Transfer Modes (2021-2032) (USD Billion)

10.5.9 3 South Africa I2C Bus Market Estimates and Forecasts, By Application (2021-2032) (USD Billion)

10.5.10 Rest of Middle East & Africa

10.5.10.1 Rest of Middle East & Africa I2C Bus Market Estimates and Forecasts, By Type (2021-2032) (USD Billion)

10.5.10.2 Rest of Middle East & Africa I2C Bus Market Estimates and Forecasts, By Data Transfer Modes (2021-2032) (USD Billion)

10.5.10.3 Rest of Middle East & Africa I2C Bus Market Estimates and Forecasts, By Application (2021-2032) (USD Billion)

10.6 Latin America

10.6.1 Trends Analysis

10.6.2 Latin America I2C Bus Market Estimates and Forecasts, by Country (2021-2032) (USD Billion)

10.6.3 Latin America I2C Bus Market Estimates and Forecasts, By Type (2021-2032) (USD Billion) 

10.6.4 Latin America I2C Bus Market Estimates and Forecasts, By Data Transfer Modes (2021-2032) (USD Billion)

10.6.5 Latin America I2C Bus Market Estimates and Forecasts, By Application (2021-2032) (USD Billion)

10.6.6 Brazil

10.6.6.1 Brazil I2C Bus Market Estimates and Forecasts, By Type (2021-2032) (USD Billion)

10.6.6.2 Brazil I2C Bus Market Estimates and Forecasts, By Data Transfer Modes (2021-2032) (USD Billion)

10.6.6.3 Brazil I2C Bus Market Estimates and Forecasts, By Application (2021-2032) (USD Billion)

10.6.7 Argentina

10.6.7.1 Argentina I2C Bus Market Estimates and Forecasts, By Type (2021-2032) (USD Billion)

10.6.7.2 Argentina I2C Bus Market Estimates and Forecasts, By Data Transfer Modes (2021-2032) (USD Billion)

10.6.7.3 Argentina I2C Bus Market Estimates and Forecasts, By Application (2021-2032) (USD Billion)

10.6.8 Rest of Latin America

10.6.8.1 Rest of Latin America I2C Bus Market Estimates and Forecasts, By Type (2021-2032) (USD Billion)

10.6.8.2 Rest of Latin America I2C Bus Market Estimates and Forecasts, By Data Transfer Modes (2021-2032) (USD Billion)

10.6.8.3 Rest of Latin America I2C Bus Market Estimates and Forecasts, By Application (2021-2032) (USD Billion)

12. Company Profiles

12.1 Texas Instruments Incorporated

          12.1.1 Company Overview

12.1.2 Financial

12.1.3 Products/ Services Offered

12.1.4 SWOT Analysis

12.2 NXP Semiconductors N.V.

           12.2.1 Company Overview

12.2.2 Financial

12.2.3 Products/ Services Offered

12.2.4 SWOT Analysis

12.3 STMicroelectronics N.V.

          12.3.1 Company Overview

12.3.2 Financial

12.3.3 Products/ Services Offered

12.3.4 SWOT Analysis

12.4 Analog Devices, Inc

          12.4.1 Company Overview

12.4.2 Financial

12.4.3 Products/ Services Offered

12.4.4 SWOT Analysis

12.5 ON Semiconductor Corporation

          12.5.1 Company Overview

12.5.2 Financial

12.5.3 Products/ Services Offered

12.5.4 SWOT Analysis

12.6 Renesas Electronics Corporation

            12.6.1 Company Overview

12.6.2 Financial

12.6.3 Products/ Services Offered

12.6.4 SWOT Analysis

12.7 Microchip Technology Inc.

          12.7.1 Company Overview

12.7.2 Financial

12.7.3 Products/ Services Offered

12.7.4 SWOT Analysis

12.8 Infineon Technologies AG

12.8.1 Company Overview

12.8.2 Financial

12.8.3 Products/ Services Offered

12.8.4 SWOT Analysis

12.9 Broadcom Inc.

12.9.1 Company Overview

12.9.2 Financial

12.9.3 Products/ Services Offered

12.9.4 SWOT Analysis

12.10 Maxim Integrated Products, Inc.

12.10.1 Company Overview

12.10.2 Financial

12.10.3 Products/ Services Offered

12.10.4 SWOT Analysi

12. Use Cases and Best Practices

13. Conclusion

An accurate research report requires proper strategizing as well as implementation. There are multiple factors involved in the completion of good and accurate research report and selecting the best methodology to compete the research is the toughest part. Since the research reports we provide play a crucial role in any company’s decision-making process, therefore we at SNS Insider always believe that we should choose the best method which gives us results closer to reality. This allows us to reach at a stage wherein we can provide our clients best and accurate investment to output ratio.

Each report that we prepare takes a timeframe of 350-400 business hours for production. Starting from the selection of titles through a couple of in-depth brain storming session to the final QC process before uploading our titles on our website we dedicate around 350 working hours. The titles are selected based on their current market cap and the foreseen CAGR and growth.


The 5 steps process:

Step 1: Secondary Research:

Secondary Research or Desk Research is as the name suggests is a research process wherein, we collect data through the readily available information. In this process we use various paid and unpaid databases which our team has access to and gather data through the same. This includes examining of listed companies’ annual reports, Journals, SEC filling etc. Apart from this our team has access to various associations across the globe across different industries. Lastly, we have exchange relationships with various university as well as individual libraries.

Secondary Research

Step 2: Primary Research

When we talk about primary research, it is a type of study in which the researchers collect relevant data samples directly, rather than relying on previously collected data.  This type of research is focused on gaining content specific facts that can be sued to solve specific problems. Since the collected data is fresh and first hand therefore it makes the study more accurate and genuine.

We at SNS Insider have divided Primary Research into 2 parts.

Part 1 wherein we interview the KOLs of major players as well as the upcoming ones across various geographic regions. This allows us to have their view over the market scenario and acts as an important tool to come closer to the accurate market numbers. As many as 45 paid and unpaid primary interviews are taken from both the demand and supply side of the industry to make sure we land at an accurate judgement and analysis of the market.

This step involves the triangulation of data wherein our team analyses the interview transcripts, online survey responses and observation of on filed participants. The below mentioned chart should give a better understanding of the part 1 of the primary interview.

Primary Research

Part 2: In this part of primary research the data collected via secondary research and the part 1 of the primary research is validated with the interviews from individual consultants and subject matter experts.

Consultants are those set of people who have at least 12 years of experience and expertise within the industry whereas Subject Matter Experts are those with at least 15 years of experience behind their back within the same space. The data with the help of two main processes i.e., FGDs (Focused Group Discussions) and IDs (Individual Discussions). This gives us a 3rd party nonbiased primary view of the market scenario making it a more dependable one while collation of the data pointers.

Step 3: Data Bank Validation

Once all the information is collected via primary and secondary sources, we run that information for data validation. At our intelligence centre our research heads track a lot of information related to the market which includes the quarterly reports, the daily stock prices, and other relevant information. Our data bank server gets updated every fortnight and that is how the information which we collected using our primary and secondary information is revalidated in real time.

Data Bank Validation

Step 4: QA/QC Process

After all the data collection and validation our team does a final level of quality check and quality assurance to get rid of any unwanted or undesired mistakes. This might include but not limited to getting rid of the any typos, duplication of numbers or missing of any important information. The people involved in this process include technical content writers, research heads and graphics people. Once this process is completed the title gets uploader on our platform for our clients to read it.

Step 5: Final QC/QA Process:

This is the last process and comes when the client has ordered the study. In this process a final QA/QC is done before the study is emailed to the client. Since we believe in giving our clients a good experience of our research studies, therefore, to make sure that we do not lack at our end in any way humanly possible we do a final round of quality check and then dispatch the study to the client.

Key Segments: 

By Type

  • Unidirectional I2C Bus

  • Bidirectional I2C Bus

By Data Transfer Modes

  • Standard-mode (up to 100 kbit/s)

  • Fast-mode (up to 400 kbit/s)

  • Fast-mode Plus (up to 1 Mbit/s)

  • High-speed mode (up to 3.4 Mbit/s)

  • Ultra-fast mode (up to 5 Mbit/s)

By Application

  • System Management Bus (SMBus)

  • Power Management Bus (PMBus)

  • Intelligent Platform Management Interface (IPMI)

  • Display Data Channel (DDC)

  • Advanced Telecom Computing Architecture (ATCA)

Request for Segment Customization as per your Business Requirement: Segment Customization Request

Regional Coverage: 

North America

  • US

  • Canada

  • Mexico

Europe

  • Germany

  • France

  • UK

  • Italy

  • Spain

  • Poland

  • Turkey

  • Rest of Europe

Asia Pacific

  • China

  • India

  • Japan

  • South Korea

  • Singapore

  • Australia

  • Rest of Asia Pacific

Middle East & Africa

  • UAE

  • Saudi Arabia

  • Qatar

  • South Africa

  • Rest of Middle East & Africa

Latin America

  • Brazil

  • Argentina

  • Rest of Latin America

Request for Country Level Research Report: Country Level Customization Request

Available Customization 

With the given market data, SNS Insider offers customization as per the company’s specific needs. The following customization options are available for the report: 

  • Detailed Volume Analysis 

  • Criss-Cross segment analysis (e.g. Product X Application) 

  • Competitive Product Benchmarking 

  • Geographic Analysis 

  • Additional countries in any of the regions 

  • Customized Data Representation 

  • Detailed analysis and profiling of additional market players

Explore Key Insights 


  • Analyzes market trends, forecasts, and regional dynamics
  • Covers core offerings, innovations, and industry use cases
  • Profiles major players, value chains, and strategic developments
  • Highlights innovation trends, regulatory impacts, and growth opportunities
Request an Analyst Call