AI-Generated Personalized Flashcard Market Report Scope & Overview:
AI-Generated Personalized Flashcard Market size was valued at USD 1.98 billion in 2024 and is expected to reach USD 8.62 billion by 2032, growing at a CAGR of 20.25% over 2025-2032.

To Get more information on AI-Generated-Personalized-Flashcard-Market - Request Free Sample Report
The AI-Generated Personalized Flashcard Market growth is driven by the rising demand for adaptive learning solutions that enhance student engagement and retention. With increasing digital adoption in education and corporate training, AI-powered flashcards offer real-time personalization, making learning more effective and efficient. The growing focus on test preparation, language learning, and skill development also fuels demand.
Notably, institutions including Nigel JKO (U.S. military training) are leveraging AI for adaptive learning paths, accelerating personnel training and progression highlighting AI’s effectiveness in high-stakes, fast-paced learning environments.
Moreover, academic initiatives, such as flashcardsGPT, developed by students at FHNW (Switzerland), demonstrate how large language models can convert lecture slides into flashcards while preserving data privacy using open-source frameworks.
The expansion of mobile-based learning platforms and integration with gamification elements further boost user interest. Advancements in natural language processing and machine learning continue to improve the contextual relevance of content, supporting the market's rapid growth across diverse end-user segments.
The U.S. AI-Generated Personalized Flashcard Market size was valued at USD 0.54 billion in 2024 and is expected to reach USD 2.34 billion by 2032, growing at a CAGR of 20.07% over 2025-2032.
The U.S. AI-Generated Personalized Flashcard Market is growing due to increasing demand for personalized, adaptive learning in education and professional training. Widespread smartphone use, EdTech adoption, and AI-driven content customization enhance engagement and retention. Supportive government policies and strong presence of key players further fuel market expansion across user segments.
Market Dynamics
Drivers
-
Rising Demand for Personalized Learning Tools Among Students and Lifelong Learners Is Rapidly Fueling the Adoption Of AI-Generated Flashcards
The demand for studious, exam aspirants, and professionals for tailored learning that suits their pace and gap has been ever-increasing. AI-generated flashcards that respond and change according to user performance, and add spaced repetition for better retention along with instant dashboard analytics. Mobile-first access and gamification enhances interest and everyday usage, as micro-learning proliferates. This emerging trend of self-directed learning has accelerated the need for institutions and developers to implement content delivery via AI-based solutions. As a result of this behavior-driven customization, AI flashcards are crucial to modern-day education in any setting due to their high-level satisfaction.
A University of Waterloo study shows learners forget approximately 70% of new information within 24 hours and nearly 90% within a week without review. However, research from UCLA demonstrates that spaced repetition can improve long-term retention by 200–300%. Furthermore, a University of California study found that AI-powered flashcards can reduce study time by 30–50% while maintaining or even enhancing retention levels.
Restraints:
-
Limited Access to High-Quality Training Datasets Restricts the Content Accuracy and Personalization Depth Of AI-Generated Flashcard Systems
Limitations in content foundations in many flashcard tools mean that AI-powered personalization is grounded in splintered, low-quality training data. Flashcards misaligned with curriculum needs due to biased or incorrect data, which undermines trust and scalability. The absence of annotated datasets related to more niche subjects or in non-English languages does not promote contextualization, or adaptive complexity. Educational publishers may be reluctant to license content, limiting access to data. In the absence of open, standards-based repositories, however, AI flashcard systems will struggle to provide effective and scalable personalized learning.
A survey in PMC notes that AI in education often uses unbalanced datasets, which “may produce systematic and repeatable errors disadvantaging minorities” unless carefully addressed. Additionally, an arXiv review highlights that algorithmic bias stemming from data-related, user-feedback, and sampling issues fundamentally undermines fairness in educational AI.
Opportunities:
-
Growing Adoption of AI in Language Learning Apps Presents Vast Potential for Tailored Flashcard Integration Across Multilingual Education Platforms
One of the fastest growing areas of EdTech is language learning, where the use of AI-generated flashcards is crucial for vocabulary retention and spaced learning features. Adaptive flashcards are used by platforms, such as Duolingo, Babbel, and Memrise to increase engagement and memory recall. These use personalization, contextualization and local lingo to create better experiences than current offerings that cover gaps with text overloards. This is particularly important as the global demand for multilingualism continues to rise in emerging, mobile-first and low-bandwidth markets in Asia, Latin America, and Africa, where flashcards may be a highly scalable and personalized, yet low-impact language education solution.
Duolingo now serves over 46.6 million daily active users and 130.2 million monthly users as of Q1 2025 showing its massive reach and the effectiveness of adaptive tools like flashcards in engaging global learners. Additionally, a study using Memrise and Quizlet showed that implementing flashcards significantly improved vocabulary achievement (from average scores of 55.6 to 89.5) and boosted student motivation in academic settings.
Challenges
-
Ensuring Pedagogical Alignment and Educational Relevance Across Diverse Curricula Remains a Major Hurdle in Deploying AI-Generated Flashcards at Scale
AI-generated flashcards provide powerful personalization but often struggle to align with diverse curricula and academic standards. Variations in learning objectives and terminology can lead to generic or misaligned content, raising concerns among educators about accuracy and rigor. These flashcards require constant updates to match evolving syllabi, demanding backend investment. Additionally, balancing algorithmic output with educator oversight is challenging. Without proper validation, flashcards risk spreading misinformation, limiting their use in high-stakes exams and highlighting the need for a hybrid and educator-led approach.
An MIT study shows AI-assisted writing can reduce brain activity and executive control, raising concerns over diminished rigor especially regarding unvetted AI-generated learning resources. Furthermore, Chegg reports that 53% of undergraduates worry about “incorrect or inaccurate information” from GenAI tools, reinforcing the need for educator-led validation.
Segmentation Analysis:
By Component
The software segment dominated the AI-generated personalized flashcard market share of a 76% in 2024, as it enables scalable architecture, easy integration, and provide the advantage of usage in mobile apps, LMS, and other platforms. Cost-effectiveness, automated content generation, and real-time personalization further make software solutions the primary pick among learners and institutions for leveraging digital education tools.
The services segment is expected to grow at the fastest CAGR of 22.05% over 2025–2032, due to the rise in demand for the bespoke implementation of capabilities and technology support, and for the fine-tuning of AI models, and content administration. The integration of AI-powered flashcard systems by educational institutions and businesses will further increase reliance on said service providers for training, regular updates, and optimization boosting adoption of service and allowing high long-term growth potential in various end-user environments.
By Application
The education segment led the AI-generated personalized flashcard market with a 32% revenue share in 2024 owing to the extensive number of Students, Educators, and Academic Platforms who use flashcards to study and engage in interactive learning. Flashcards powered by AI have gained traction as institutions move towards digital learning, gamified study tools, and even content closely aligned with a curriculum, particularly in K–12 and undergraduate learning, where repetition and personalization aid memory retention.
The test preparation segment is projected to grow at the fastest CAGR of 22.03% over 2025–2032 owing to the increase in competition for various standardized exams, thereby increasing the demand for adaptive study tools. With customized revision, spaced repetition, and instant performance metrics, AI flashcards are the perfect tool for effective preparation for high-stakes examinations, such as SAT, GRE, GMAT, and civil services, where precision learning correlates to performance.
By End-User
The higher education segment dominated the market with a 28% revenue share in 2024, as universities and colleges were integrating AI-based flashcards into the e-learning platform for complex subjects. Students in areas including medicine, engineering, and law need memoisation tools to recall and retain knowledge, which is mission-critical, thus fueling demand for always-on, personalizable, mobile-first learning aids.
The enterprises segment is expected to grow at the fastest CAGR of 21.65% over 2025–2032, owing to the increasing corporate training, onboarding, and upskilling investment. Companies are using AI-generated flashcards to provide content that is distinctively bite-sized in nature, role-specific, and customized in language, which is leading to better engagement and performance of employees at a lower cost and a shorter time-to-competency compared to traditional training modules.
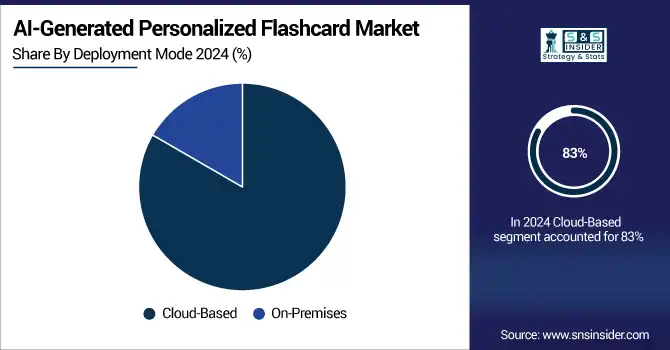
By Deployment Mode
Cloud-Based segment dominated the AI-Generated Personalized Flashcard Market with the highest revenue share of about 83% in 2024, and is expected to grow at the fastest CAGR of about 20.96% over 2025–2032. Its widespread adoption and fast expansion rely on effortless accessibility, minimal infrastructure, and scalability. Cloud-based platforms provide the ability to automatically synchronize across devices, integrate seamlessly and instantly with a LMS, and deliver personalized, flexible and affordable digital-learning solutions to educational institutions and learners, across the globe, across devices.
Regional Analysis:
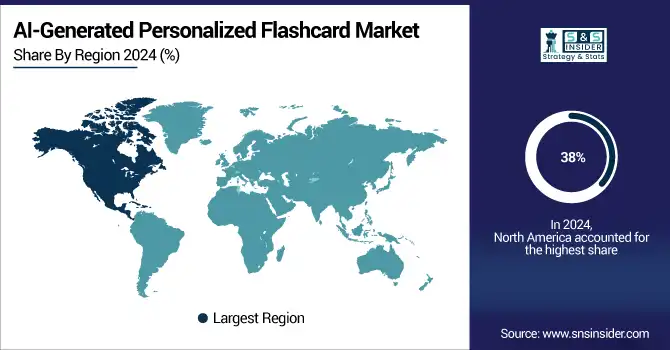
North America
North America dominated the AI-generated personalized flashcard market with a 38% revenue share in 2024 attributed to earlier adoption of digital infrastructure, high market presence of edtech companies, and uniqueness of AI in education in the North American region. The dominant position of this region in the market was due to the generalization of mobile learning tools, early implementation of adaptive learning platforms in schools and universities, and rapid investments in R&D of AI.
A 2024 Ellucian survey of 445 U.S. and Canadian faculty and administrators revealed that 93% expect to expand AI use in their institutions over the next two years, reinforcing the region’s momentum in embracing AI-powered educational tools.
The U.S. dominated the AI-generated personalized flashcard market among North American countries in 2024 due to high edtech adoption and AI integration
Asia Pacific
Asia Pacific is expected to grow at the fastest CAGR of 22.13% during 2025–2032, owing to the rapid digitalization in education, increasing smartphones usage and rising student population in India, China, and Southeast Asia countries. The demand for AI-based, personalized learning solutions across regional and linguistic markets in the region is being fueled by government initiatives that encourage e-learning and the rise in the popularity of competitive exam preparations.
China dominated the AI-generated personalized flashcard market in Asia Pacific in 2024 due to its massive student base and rapid edtech innovation.
A nationwide campaign launched in March 2024 established AI learning modules and ethics guidelines on China’s smart education platform, reinforcing the country's push toward AI-integrated learning.
Additionally, China's Ministry of Education is rolling out AI literacy programs in primary and secondary schools, designating over 184 pilot schools as of December 2024 to lead this transition.
Europe
The AI-generated personalized flashcard market trends in Europe are projected to witness a stable growth owing to increasing digital transformation in educational institutions, supporting government initiatives for e-learning in corporate, government, and education establishments, and growing multilingual, adaptive learning tools demand throughout schools, universities, and corporate training environments.
The U.K. dominated the AI-generated personalized flashcard market in Europe in 2024 due to strong digital learning infrastructure and early AI adoption.
Middle East & Africa and Latin America
The Middle East & Africa has witnessed moderate adoption of AI-based personalized flashcards due to digitalized education initiatives, whereas Latin America is likely to expand rapidly due to increasing demand for mobile learning and personalized student engagement.
Get Customized Report as per Your Business Requirement - Enquiry Now
Key Players:
AI-generated personalized flashcard Market companies are Quizlet, Brainscape, Anki, Chegg, Cram, StudyBlue, GoConqr, Memrise, Tinycards, Flashcard Machine, Quizizz, Knowunity, StudyStack, Zorbi, RemNote, Magoosh, EdApp, Classmint, and Decktopus.
Recent Developments:
-
2024 – Brainscape added smart AI card organization tools, expanded file import options (.txt, .tsv, and Excel), and rolled out new dark mode features on its mobile apps.
-
2024 – Quizlet launched an AI Practice Test Generator that automatically creates tests and flashcards from notes, documents, or textbooks using generative AI, enhancing real-time study aid efficiency.
-
2023 – Quizlet launched Q‑Chat, an AI tutor powered by ChatGPT, offering conversational learning and personalized Q&A for students. It marked Quizlet’s first major move into generative AI.
| Report Attributes | Details |
|---|---|
| Market Size in 2024 | USD 1.98 Billion |
| Market Size by 2032 | USD 8.68 Billion |
| CAGR | CAGR of 20.25% From 2025 to 2032 |
| Base Year | 2024 |
| Forecast Period | 2025-2032 |
| Historical Data | 2021-2023 |
| Report Scope & Coverage | Market Size, Segments Analysis, Competitive Landscape, Regional Analysis, DROC & SWOT Analysis, Forecast Outlook |
| Key Segments | • By Component (Software, Services) • By Application (Education, Corporate Training, Test Preparation, Language Learning, Others) • By Deployment Mode (Cloud-Based, On-Premises) • By End-User (K-12, Higher Education, Enterprises, Individuals, Others) |
| Regional Analysis/Coverage | North America (US, Canada, Mexico), Europe (Germany, France, UK, Italy, Spain, Poland, Turkey, Rest of Europe), Asia Pacific (China, India, Japan, South Korea, Singapore, Australia, Rest of Asia Pacific), Middle East & Africa (UAE, Saudi Arabia, Qatar, South Africa, Rest of Middle East & Africa), Latin America (Brazil, Argentina, Rest of Latin America) |
| Company Profiles | Quizlet, Brainscape, Anki, Chegg, Cram, StudyBlue, GoConqr, Memrise, Tinycards, Flashcard Machine, Quizizz, Knowunity, StudyStack, Zorbi, RemNote, Magoosh, EdApp, Classmint, Decktopus |
Get in Touch
