Inline Metrology Market Report Scope & Overview:
Get more information on Inline Metrology Market - Request Sample Report
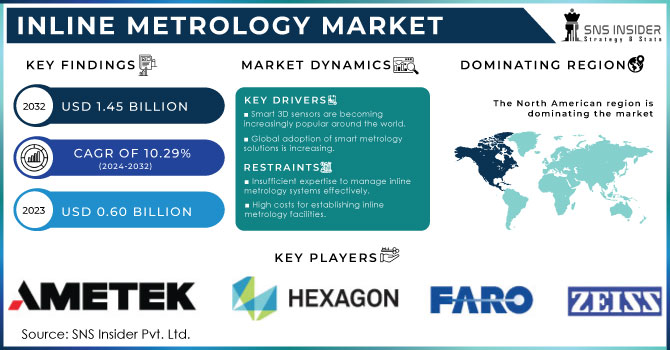
The Inline Metrology Market Size was valued at USD 0.60 billion in 2023 and is expected to reach USD 1.45 billion by 2032 and grow at a CAGR of 10.29% over the forecast period 2024-2032.
Inline metrology systems are becoming more and more crucial in semiconductor manufacturing, providing instant measurements and quality control necessary for attaining the level of precision needed in sophisticated semiconductor procedures. As semiconductor production progresses, there will be an increasing demand for these systems to precisely assess and examine intricate materials and structures in today's chips. The connection between the growth of the semiconductor industry and the demand for inline metrology underlines the crucial role of metrology in achieving objectives outlined in government programs such as the CHIPS Act. Intel stated that shortages of chips resulted in a loss of USD 240 billion for the U.S. economy. In reaction to this, the CHIPS and Science Act, endorsed in 2022, designated USD 280 billion over a decade to enhance semiconductor fabrication, with USD 53 billion for research and manufacturing and USD24 billion in tax breaks. The goal of the European Commission's €43 billion investment is to increase the EU's chip production to 20% by 2030. The investments in new manufacturing plants have sped up, yet the intricacy of new technologies requires advanced measurement solutions to guarantee success in mass production. The U.S. CHIPS R&D Metrology Program, headed by NIST, highlights the importance of new metrology techniques, outlining ten main focus areas in its strategic plan, "Metrology Gaps in the Semiconductor Ecosystem."
Inline metrology plays a crucial role in contemporary manufacturing by scanning, measuring, and controlling parts in real-time as they move through a production line. This method is known for its dependability, automated features, quickness, and non-invasive qualities, making it a key component of thorough process management. Inline metrology systems are created to be completely incorporated into production operations, allowing smooth data exchange among various processing stages. This skill is crucial for upholding high levels of accuracy and excellence in production, especially in fields with little room for mistakes.Reverse engineering often relies on inline metrology to obtain accurate measurements of current components for reproduction or enhancement purposes. Moreover, it is crucial in quality control and inspection to make sure products meet strict specifications before being released to the market. Inline metrology is extensively utilized in a range of industries such as semiconductors, aerospace, automotive, energy & power, and medical devices. In these industries, the capability to perform live measurements without disrupting operations is extremely valuable, as it increases efficiency, cuts down on waste, and enhances overall product quality. The semiconductor sector has greatly benefited from the implementation of inline metrology. Due to the growing complexity and miniaturization of semiconductor devices, there is an increasing demand for accurate measurement and control in the manufacturing process. Inline metrology systems ensure that modern semiconductor devices meet their performance standards by accurately measuring and characterizing new materials and structures. The U.S. government has made significant investments in the semiconductor industry by supporting initiatives such as the CHIPS and Science Act, acknowledging the significance of advanced manufacturing technologies.
Market Dynamics
Drivers
- Metrological traceability is an essential factor in driving the growth of the inline metrology market.
Metrological traceability, a key component of measurement science, is increasingly becoming a crucial factor in the expansion of the inline metrology market. The significance of metrological traceability has been emphasized by NIST through the creation of continuous chains of calibrations connected to national or international standards, such as the SI. As manufacturing processes place a greater emphasis on precision and reliability, the need for accurate and traceable measurements is rising. Inline metrology, positioned uniquely to meet this demand, allows for real-time measurement and quality control within production lines. Inline metrology systems are capable of giving continuous, non-destructive measurements, guaranteeing that manufacturing processes stay within strict tolerance levels, cutting down on waste and improving product quality. This is especially important in industries like semiconductors, aerospace, and automotive, where even small deviations can cause major operational disruptions. Inline metrology systems, which are essential tools for meeting SI unit traceability standards, are increasingly necessary for industries due to their advanced calibration techniques. Incorporating these systems into production lines allows every measurement to be connected to a national or international standard, ensuring the utmost precision and uniformity. This ability to track products not only improves economic security by reducing mistakes and reworking but also adheres to worldwide quality assurance standards, strengthening the competitiveness of industries in the global market. Consequently, the inline metrology sector is seeing strong expansion due to the rising demand for accurate, immediate measurement solutions that meet the strict criteria established by entities such as NIST. This pattern is predicted to persist as companies worldwide understand the importance of metrological traceability in attaining high standards in production.
- Boosting R&D spending on automation technologies driving expansion in the Inline Metrology Market.
The increase in worldwide investment in research and development (R&D) for automation technologies is greatly driving the expansion of the inline metrology market. With industries around the globe placing more emphasis on automation to improve efficiency, productivity, and product quality, investing in research and development has become essential for driving technological progress. In the field of electronics, ongoing research and development initiatives have driven fast technological advancements, resulting in the frequent introduction of new and creative products. To stay ahead, firms need to focus on research and development to create innovative products that meet changing market needs. New products must go through thorough testing, requiring the utilization of advanced metrology solutions to guarantee quality, efficiency, and defect identification in the initial manufacturing phases. Incorporating inline metrology for real-time, non-destructive measurements directly into production lines is increasingly essential in this setting. As automation technologies progress, the complexity and accuracy needed in manufacturing processes grow, leading to a greater need for advanced metrology tools. Businesses are making investments in both manual and automated inline metrology solutions in order to uphold strict quality control, minimize waste, and improve operational efficiency. This tendency is especially noticeable in advanced sectors like semiconductors, aerospace, and automotive, where even slight variations can lead to important outcomes. The increasing significance of quality assurance in these industries, along with the quick advancements in technology, are leading to significant opportunities for measurement companies that focus on inline metrology. With R&D expenditures increasing worldwide due to the emphasis on automation and innovation, the inline metrology market is projected to experience growth as the demand for advanced metrology solutions rises. This increase shows the growing complexity of current manufacturing and highlights the importance of accurate measurement in the success of new technologies and products.
Restraints
- One of the main obstacles when integrating inline metrology systems.
The shortage of skilled experts is a major obstacle to the successful integration of inline metrology systems in different industries, especially as these systems become more advanced and exact. Inline metrology equipment, crucial for immediate quality assessment in manufacturing, requires a specialized technical knowledge suited to the industry and products being inspected. In contrast to conventional Coordinate Measuring Machines (CMMs) used in numerous manufacturing settings, inline metrology systems demand operators to possess a profound knowledge of sophisticated measurement technologies and the complex production processes they oversee. Regrettably, the existing workforce frequently lacks the necessary preparation to fulfill these requirements because of the absence of specialized training and certification programs specifically for inline metrology. The lack of knowledge is worsened by the fact that numerous manufacturing experts have gained extensive experience using traditional CMMs, making it difficult to switch to more advanced inline systems. Being comfortable with outdated technologies can make it harder to embrace newer, more complicated systems, which in turn hinders the incorporation of inline metrology in production processes. Moreover, the quick rate of technological progress in metrology necessitates ongoing education and adjustment, yet there are not many industry-focused training facilities or certification programs available. Consequently, there is an increasing shortage of skilled professionals capable of effectively running and upkeeping these sophisticated systems. This deficiency affects manufacturing companies' operational efficiency and limits their ability to maximize the advantages of inline metrology, like improved quality control and decreased production errors. To tackle this issue, it is crucial to invest more in training initiatives and certifications that specialize in inline metrology, guaranteeing a skilled workforce.
Segment Analysis
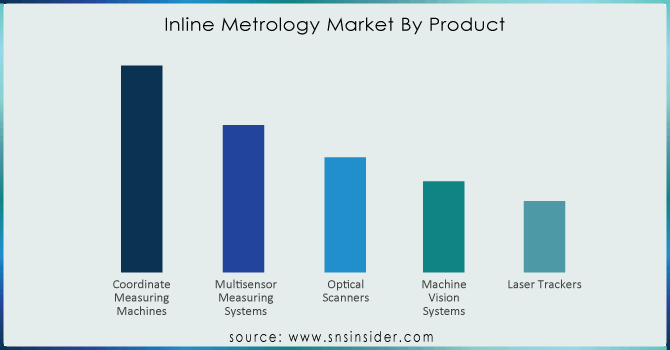
By Product
Based on Product, Coordinate Measuring Machines is captured the largest share in Inline Metrology market with 32% of share in 2023. Highlighting their crucial importance in both production and quality assurance. CMMs are well-known for their accuracy and flexibility in assessing the physical geometrical qualities of an item, which is why they are vital in sectors like automotive, aerospace, and electronics. Continuous innovations and product launches drive this key sector, improving CMM capabilities to meet the changing needs of modern manufacturing. Prominent companies in the metrology industry, like Zeiss, Hexagon, and Mitutoyo, have been leading this development. As an example, Zeiss launched the most recent version of the Zeiss Accura, which incorporates state-of-the-art sensors and automation capabilities to enhance measurement precision and speed, targeting high-precision uses. In the same way, the Optiv Performance series from Hexagon provides increased versatility through multi-sensor technology, enabling thorough measurements in intricate settings. Mitutoyo's advancements in CMM technology aim to broaden their selection of high-speed, high-precision systems catered to both large-scale and micro-level inspections. The progress mirrors a general move towards incorporating more advanced technologies into CMMs, such as automated data processing, real-time analytics, and advanced software to improve measurement capabilities. The increasing need for precision and productivity in manufacturing processes is fueling the demand for these advancements, as businesses aim to utilize CMMs for improved inline metrology effectiveness. Advanced CMMs play a crucial role in enhancing operational efficiency and product quality through real-time quality control and decreased measurement errors. The constant creation and introduction of new CMM models not only strengthen their leading position in the inline metrology market but also emphasize the essential role these systems play in advancing manufacturing technologies. As inline metrology solutions become more popular in industries, CMMs are expected to remain important due to continuous improvements that make them more effective and versatile in various manufacturing settings.
By Industry
Based on Industry, Automotive is holding the largest share in inline metrology market with 34% of share in 2023. Because of the vital requirement for accurate examination, sizing, and assessment of automobile parts. The industry's growing use of advanced inline metrology systems, like optical measurement systems and sophisticated Coordinate Measuring Machines (CMMs), indicates a change from conventional techniques to faster, more effective inspection technologies. Enterprises such as Zeiss, Hexagon, and Mitutoyo are at the forefront of advancements in this field, greatly influencing the way the automotive industry deals with quality assurance. For instance, Zeiss's O-Inspect multisensor CMM combines optical and contact measurement methods to allow thorough and quick examination of intricate automotive components. Hexagon's Absolute Tracker AT960 provides precise measurements through its laser scanning features, essential for maintaining the precision of complex vehicle parts. The Crysta-Apex S, a new advancement by Mitutoyo, offers improved real-time data processing and fast measurement abilities, boosting the efficiency of automotive assembly lines. The increasing need for cars in emerging markets like Russia, South Africa, and China requires quick and dependable quality control procedures. As these nations enhance their automotive production capacities, the importance of precise inline metrology solutions that are fast is growing. Incorporating sophisticated CMMs and optical measurement systems in production lines allows for immediate identification of flaws and variations, guaranteeing improved quality standards and operational efficiency. This trend supports the competitiveness of the automotive industry and also promotes the wider use of inline metrology technologies, boosting market growth and innovation. The ongoing development of precision measurement tools for the automotive industry highlights the industry's dedication to upholding strict quality control measures despite increasing worldwide need.
Get Customized Report as per your Business Requirement - Request For Customized Report
Regional Analysis
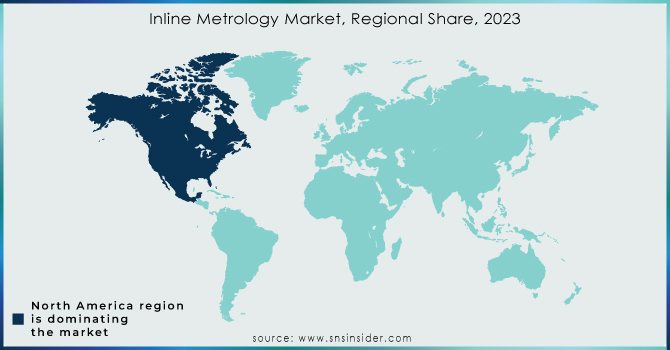
North America is captured the largest share in inline metrology market with 34% of share in 2023. Substantial investments in cutting-edge manufacturing technologies and a strong emphasis on innovation in industries like automotive, aerospace, and electronics have led to this notable presence. Businesses in the area are leading the way in creating and incorporating advanced in-line measurement solutions for improved production efficiency and quality assurance. For example, prominent companies such as Zeiss and Hexagon have made significant progress in North America with their most recent product advancements. Recently, Zeiss introduced the O-Inspect multisensor coordinate measuring machine, which combines optical and tactile measurement technologies to deliver precise inspections needed in industries like aerospace and automotive. In contrast, Hexagon unveiled the Leica Absolute Tracker AT960, an advanced laser tracking system created to provide unmatched precision and efficiency in intricate manufacturing settings. These developments show North America's dedication to using advanced technology to retain competitive edge and adapt to changing needs in various industries. The strong manufacturing industry and high demand for precision engineering in the region are also contributing to the growth of the inline metrology market, driven by the necessity for immediate quality control and defect identification. Furthermore, the continuous growth of production capacities in the United States and Canada, combined with higher spending on automation and smart manufacturing technologies, enhances the use of inline metrology systems. As North America remains at the forefront of innovation and market growth, its leadership in the inline metrology industry is projected to grow stronger, solidifying its essential position in improving worldwide manufacturing norms and promoting technological advancements.
Asia-Pacific is the fastest growing region in Inline Metrology Market with cagr of 10.29 % over the forecast period of 2024-2032. This increase is fueled by the significant economic growth in key nations such as China and India, which serve as major centers for car and electronics production. The area's rapid expansion is supported by a growing need for innovative in-line metrology solutions, essential for ensuring quality and accuracy in busy production settings. Prominent organizations are making strategic investments in the area to take advantage of these opportunities. For instance, Zeiss has increased its footprint by launching the Zeiss O-Inspect, a multisensor CMM with advanced optical and tactile measurement features, designed for the expanding automotive and electronics markets in APAC. Hexagon has grown its presence with the introduction of the Absolute Scanner AS1, specifically created for quick and accurate measurement in intricate industrial settings. In addition, Mitutoyo has launched the Crysta-Apex S series, which incorporates advanced technology for instant data processing and improved measurement speed, meeting the requirements of quickly developing production lines in APAC. This surge of new metrology solutions coincides with the region's efforts to incorporate smart manufacturing technologies and improve quality control procedures. The strong participation of important parties and their ongoing creativity will guarantee that inline metrology systems can fulfill the growing need for accuracy and productivity in the thriving manufacturing industries of APAC. With the ongoing acceleration of economic growth and expansion in manufacturing capabilities, the inline metrology market in Asia-Pacific is expected to experience substantial growth, reinforcing its leadership in the global market.
KEY PLAYERS:
The key players in the inline metrology market are Hexagon, Faro Technologies, Carl Zeiss, Jenoptik, LMI Technologies, AMETEK, ABB Ltd, Nikon Metrology, KLA Corporation, Renishaw, Mitutoyo Corporation, Perceptron & Other Players.
RECENT DEVELOPMENT
-
In August 2022: LMI Technologies (LMI) officially launched its latest Gocator® 2600 Series, comprising intelligent 3D laser line profile sensors boasting 4K+ resolution.
-
In February 2023: LMI Technologies (LMI) introduced its new Gocator 2540/50, presenting high-speed wide field of view 3D laser line profile sensors.
| Report Attributes | Details |
|---|---|
| Market Size in 2023 | USD 0.60 Billion |
| Market Size by 2032 | USD 1.45 Billion |
| CAGR | CAGR of 10.29% From 2024 to 2032 |
| Base Year | 2023 |
| Forecast Period | 2024-2032 |
| Historical Data | 2020-2022 |
| Report Scope & Coverage | Market Size, Segments Analysis, Competitive Landscape, Regional Analysis, DROC & SWOT Analysis, Forecast Outlook |
| Key Segments | • By Product (Coordinate Measuring Machines, Multisensor Measuring Systems, Optical Scanners, Machine Vision Systems, Laser Trackers) • By Offering (Hardware, Software, Services) By Application (Reverse Engineering, Quality Control And Inspection, Others) • By Industry (Automotive, Aerospace, Energy & Power, Semiconductors, Others) |
| Regional Analysis/Coverage | North America (US, Canada, Mexico), Europe (Eastern Europe [Poland, Romania, Hungary, Turkey, Rest of Eastern Europe] Western Europe] Germany, France, UK, Italy, Spain, Netherlands, Switzerland, Austria, Rest of Western Europe]), Asia-Pacific (China, India, Japan, South Korea, Vietnam, Singapore, Australia, Rest of Asia-Pacific), Middle East & Africa (Middle East [UAE, Egypt, Saudi Arabia, Qatar, Rest of Middle East], Africa [Nigeria, South Africa, Rest of Africa], Latin America (Brazil, Argentina, Colombia, Rest of Latin America) |
| Company Profiles | Hexagon, Faro Technologies, Carl Zeiss, Jenoptik, LMI Technologies, AMETEK, ABB Ltd, Nikon Metrology, KLA Corporation, Renishaw, Mitutoyo Corporation and Perceptron. |
| Key Drivers |
• Metrological traceability is an essential factor in driving the growth of the inline metrology market. • Boosting R&D spending on automation technologies driving expansion in the Inline Metrology Market. |
| RESTRAINTS |
• One of the main obstacles when integrating inline metrology systems. |
Get in Touch
