image

Jerry Cans Market Report Scope & Overview:

The Jerry Cans Market size was USD 2.83 billion in 2022 and is expected to Reach USD 3.99 billion by 2030 and grow at a CAGR of 4.4% over the forecast period of 2023-2030.

Demand for jerry cans reached to around more than 2.8 billion in the year 2022. Due to the expansion of chemical industry the market is expected to see rise of 1.2 billion over the forecast period. The expansion of jerry cans market is expected to be around 1.5 times over the forecast period. Due to the end use of jerry cans the sales is expected to rise 1.5 times over the projection period.

Jerry Cans Market Revenue Analysis

Get More Information on Jerry Cans Market - Request Sample Report
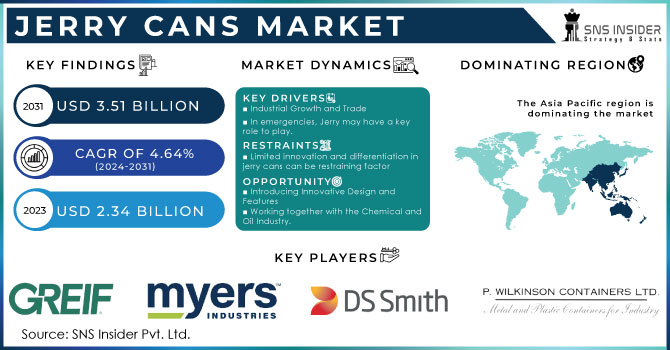
MARKET DYNAMICS

KEY DRIVERS:

  • Industrial Growth and Trade

The demand for jerry cans is highly correlated with industrial growth, manufacturing and world trade. The need to store and transport liquids of all types, e.g. Chemical, Oil or Other Industrial Fluids, increases as the economy expands and trade activities become more intense, which drives demand for jerry cans.

  • In emergencies, Jerry may have a key role to play.

RESTRAIN:

  • Limited innovation and differentiation in jerry cans can be restraining factor

It may lead to lower consumer interest and slower growth, if the jerry can market becomes too saturated and there are limited innovation in terms of design and functionality.

OPPORTUNITY:

  • Introducing Innovative Design and Features

In order to increase the user friendliness and consumer appeal of jerry cans, it is appropriate to introduce innovation in design such as better pour mechanisms, integrated handles or stackable designs.

  • Working together with the Chemical and Oil Industry.

CHALLENGES:

  • The price fluctuations of the raw materials used by jerry can, for example plastics or metals, are liable to have an impact on production costs and lead to a decline in profitability.

IMPACT OF RUSSIAN UKRAINE WAR:

The market for jerry cans has been significantly affected by the conflict between Russia and Ukraine. Jerry cans have been used for storing and transporting fuel; war has caused the world's supply to be interrupted. This, coupled with the fact that jerry cans are becoming more scarce, prompted people to rush for fuel in case of shortages.

In the United States, in the weeks following the start of the war, the average price of a 5 gallon jerry can increased from $10 to $20. The prices for jerry cans have risen considerably in Europe, where some of them are sold at as much as $50. The United Kingdom has set a limit of two jerrycans per day for each person. A study conducted by the Association of Convenience Stores in the United Kingdom shows that since the outbreak of war, there has been a 500 % rise in sales of jerry cans.

IMPACT OF ONGOING RECESSION:

The current economic downturn is expected to have a negative impact on the jerry can market. A 11.1% drop has occurred on the market. The growing popularity of electric vehicles. The electric vehicle doesn't require fuel, so you need fewer jerry cans to store it and transport it. Development of new technology for the storage and transportation of petroleum. jerry cans may become obsolete because of these new technologies. The jerry can is being regulated more and more. Jerry tanks are becoming increasingly regulated by governments, which can increase their costs and make it more difficult for them to operate. There was an uneven effect on the jerry cans market from the economic downturn. In some segments of the market, recession is more likely than others. For instance, there is more vulnerability in the market for jerry drums used by businesses compared with the market for bottles sold to consumers. In fact, companies are more likely to reduce production during recessions and consumers tend to still use jerry cans when they need them.

KEY MARKET SEGMENTS

By Material

  • Plastic

  • Metal

Based on Material, Plastic is the dominant subsegment globally. The plastic segment is estimated to hold around 80 % market share. The plastic is easily available raw material due to which it is most common used packaging material.

By Capacity

  • 20-40 liters

  • 40-60 liters

  • 60-80 liters

  • Others

The 20 Litres segment is dominating the market by capacity. This is due to the increased demand from end use industries such as agrochemicals, petrochemicals.

By Shape

  • Round

  • Stackable

  • Square

  • Others

In 2022, By Shape the square segment dominated the global market. The square shape is easy to handle and store the liquid items. Hence, they are more preferable. They are more rigid and have high strength. 1140 x 1140 mm pallet is ideal dimensions for the usage.

By Manufacturing Process

  • Blow Molding

  • Compression Molding

  • Injection Molding

Based on the manufacturing process, blow molding is holding a significant market share.

By End Use

  • Food & Beverages

  • Pharmaceuticals

  • Oil & Lubricants

  • Chemicals

  • Agrochemicals

  • Others

Jerry Cans Market Segmentation Analysis

Get Customized Report as per Your Business Requirement - Request For Customized Report

Food & Beverages end use segment accounted for the largest market share of around more than 60%. In this industry the jerry cans are widely used in transportation of liquid items such as sauces, liquid food. Along with this the increased alcoholic beverages consumptions is giving boost to the segment growth.
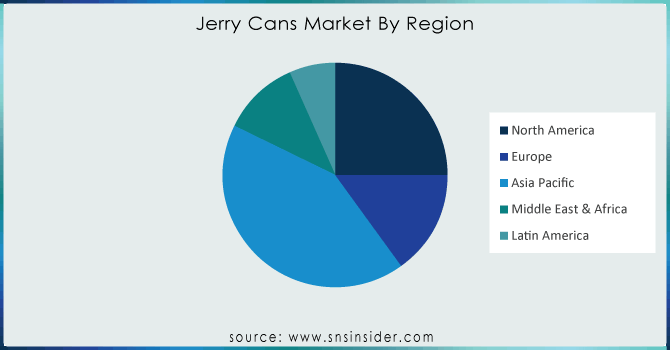
REGIONAL ANALYSIS

Over the projection period, Asia Pacific will remain the dominant market for the jerry cans. Due to the rapid industrialization, and growth of the construction and manufacturing sectors in the countries such as India and China. This is increasing demand for the various chemicals and petrochemical needs, which is also giving growth to the jerry cans market.

Europe is the second largest market for the jerry cans due to the growth of millennial population in the regions.

North America is the fastest growing market over the forecast period.

REGIONAL COVERAGE:

North America

  • US

  • Canada

  • Mexico

Europe

  • Eastern Europe

    • Poland

    • Romania

    • Hungary

    • Turkey

    • Rest of Eastern Europe

  • Western Europe

    • Germany

    • France

    • UK

    • Italy

    • Spain

    • Netherlands

    • Switzerland

    • Austria

    • Rest of Western Europe

Asia Pacific

  • China

  • India

  • Japan

  • South Korea

  • Vietnam

  • Singapore

  • Australia

  • Rest of Asia Pacific

Middle East & Africa

  • Middle East

    • UAE

    • Egypt

    • Saudi Arabia

    • Qatar

    • Rest of Middle East

  • Africa

    • Nigeria

    • South Africa

    • Rest of Africa

Latin America

  • Brazil

  • Argentina

  • Colombia

  • Rest of Latin America    

Key Players

Some major key players in the Jerry Cans market are Greif Inc, Myers Industries Inc, Barrier Plastics Inc, Wilkinson Containers Ltd, DS Smith Plastics Ltd, Can-One Berhad, Time Technoplast Ltd, California Plastics Products, Nexus Packaging Ltd,  Carrick Packaging and other players.

Barrier Plastics Inc-Company Financial Analysis

Company Landscape Analysis

RECENT DEVELOPMENT

  • In 2022, Greif Inc., announced the launch in Brazil of a lightweight, high- performance jerry can for agrochemicals, chemicals, beverages and preservatives.

  • In 2022, Myers Industries Inc, acquired a rotational molding facility in Georgia to increase its production capacity.

Jerry Cans Market Report Scope:
Report Attributes Details
Market Size in 2022  US$ 2.83 Bn
Market Size by 2030  US$ 3.99 Bn
CAGR   CAGR of 4.4 % From 2023 to 2030
Base Year 2022
Forecast Period  2023-2030
Historical Data  2019-2021
Report Scope & Coverage Market Size, Segments Analysis, Competitive  Landscape, Regional Analysis, DROC & SWOT Analysis, Forecast Outlook
Key Segments • by Material (Plastic, Metal)
• by Capacity (20-40 litres, 40-60 litres, 60-80 litres, Others)
• by Shape (Round, Stackable, Square, Others)
• by Manufacturing Process (Blow Molding, Compression Molding, Injection Molding)
• by End Use (Food & Beverages, Pharmaceuticals, Oil & Lubricants, Chemicals, Agrochemicals, Others)
Regional Analysis/Coverage North America (US, Canada, Mexico), Europe (Eastern Europe [Poland, Romania, Hungary, Turkey, Rest of Eastern Europe] Western Europe] Germany, France, UK, Italy, Spain, Netherlands, Switzerland, Austria, Rest of Western Europe]), Asia Pacific (China, India, Japan, South Korea, Vietnam, Singapore, Australia, Rest of Asia Pacific), Middle East & Africa (Middle East [UAE, Egypt, Saudi Arabia, Qatar, Rest of Middle East], Africa [Nigeria, South Africa, Rest of Africa], Latin America (Brazil, Argentina, Colombia Rest of Latin America)
Company Profiles  Greif Inc, Myers Industries Inc, Barrier Plastics Inc, Wilkinson Containers Ltd, DS Smith Plastics Ltd, Can-One Berhad, Time Technoplast Ltd, California Plastics Products, Nexus Packaging Ltd,  Carrick Packaging 
Key Drivers • Industrial Growth and Trade
• In emergencies, Jerry may have a key role to play.
Key Restraints • Limited innovation and differentiation in jerry cans can be restraining factor


Frequently Asked Questions

Ans:  The Jerry Cans Market is expected to grow at a CAGR of 4.4 %.

Ans: The Jerry Cans Market size was USD 2.83 billion in 2022 and is expected to Reach USD 3.99 billion by 2030.

Ans: Various Industrial Growth and Trade is giving growth to the market.

Ans: Limited innovation and differentiation in jerry cans can be restraining factor.

Ans: The Asia Pacific region held the largest market share and will continue to dominate the market.

TABLE OF CONTENT

1. Introduction

1.1 Market Definition

1.2 Scope

1.3 Research Assumptions

2. Research Methodology


3. Market Dynamics

3.1 Drivers

3.2 Restraints

3.3 Opportunities

3.4 Challenges

4. Impact Analysis

4.1 Impact Of Russia-Ukraine war

4.2 Impact of Ongoing Recession

4.2.1 Introduction

4.2.2 Impact on major economies

4.2.2.1 US

4.2.2.2 Canada

4.2.2.3 Germany

4.2.2.4 France

4.2.2.5 United Kingdom

4.2.2.6 China

4.2.2.7 Japan

4.2.2.8 South Korea

4.2.2.9 Rest of the World

4.3 Supply Demand Gap Analysis

5. Value Chain Analysis


6. Porter’s 5 forces model


7. PEST Analysis

8. Jerry Cans Market Segmentation, By Material

8.1 Plastic

8.2 Metal

9. Jerry Cans Market Segmentation, By Capacity

9.1 20-40 liters

9.2 40-60 liters

9.3 60-80 liters

9.4 Others

10. Jerry Cans Market Segmentation, By Shape

10.1 Round

10.2 Stackable

10.3 Square

10.4 Others

11. Jerry Cans Market Segmentation, By Manufacturing Process

11.1 Blow Molding

11.2 Compression Molding

11.3 Injection Molding

12. Jerry Cans Market Segmentation, By End Use

12.1 Food & Beverages

12.2 Pharmaceuticals

12.3 Oil & Lubricants

12.4 Chemicals

12.5 Agrochemicals

12.6 Others

13.1 Introduction

13.2 North America

13.2.1 North America Jerry Cans Market By Country

13.2.2 North America Jerry Cans Market By Material

13.2.3 North America Jerry Cans Market By Capacity

13.2.4 North America Jerry Cans Market By Shape

13.2.5 North America Jerry Cans Market By Manufacturing Process

13.2.6 North America Jerry Cans Market By End Use

13.2.7 USA

13.2.7.1 USA Jerry Cans Market By Material

13.2.7.2 USA Jerry Cans Market By Capacity

13.2.7.3 USA Jerry Cans Market By Shape

13.2.7.4 USA Jerry Cans Market By Manufacturing Process

13.2.7.5 USA Jerry Cans Market By End Use

13.2.8 Canada

13.2.8.1 Canada Jerry Cans Market By Material

13.2.8.2 Canada Jerry Cans Market By Capacity

13.2.8.3 Canada Jerry Cans Market By Shape

13.2.8.4 Canada Jerry Cans Market By Manufacturing Process

13.2.8.5 Canada Jerry Cans Market By End Use

13.2.9 Mexico

13.2.9.1 Mexico Jerry Cans Market By Material

13.2.9.2 Mexico Jerry Cans Market By Capacity

13.2.9.3 Mexico Jerry Cans Market By Shape

13.2.9.4 Mexico Jerry Cans Market By Manufacturing Process

13.2.9.5 Mexico Jerry Cans Market By End Use

13.3 Europe

13.3.1 Eastern Europe

13.3.1.1 Eastern Europe Jerry Cans Market By Country

13.3.1.2 Eastern Europe Jerry Cans Market By Material

13.3.1.3 Eastern Europe Jerry Cans Market By Capacity

13.3.1.4 Eastern Europe Jerry Cans Market By Shape

13.3.1.5 Eastern Europe Jerry Cans Market By Manufacturing Process

13.3.1.6 Eastern Europe Jerry Cans Market By End Use

13.3.1.7 Poland

13.3.1.7.1 Poland Jerry Cans Market By Material

13.3.1.7.2 Poland Jerry Cans Market By Capacity

13.3.1.7.3 Poland Jerry Cans Market By Shape

13.3.1.7.4 Poland Jerry Cans Market By Manufacturing Process

13.3.1.7.5 Poland Jerry Cans Market By End Use

13.3.1.8 Romania

13.3.1.8.1 Romania Jerry Cans Market By Material

13.3.1.8.2 Romania Jerry Cans Market By Capacity

13.3.1.8.3 Romania Jerry Cans Market By Shape

13.3.1.8.4 Romania Jerry Cans Market By Manufacturing Process

13.3.1.8.5 Romania Jerry Cans Market By End Use

13.3.1.9 Hungary

13.3.1.9.1 Hungary Jerry Cans Market By Material

13.3.1.9.2 Hungary Jerry Cans Market By Capacity

13.3.1.9.3 Hungary Jerry Cans Market By Shape

13.3.1.9.4 Hungary Jerry Cans Market By Manufacturing Process

13.3.1.9.5 Hungary Jerry Cans Market By End Use

13.3.1.10 Turkey

13.3.1.10.1 Turkey Jerry Cans Market By Material

13.3.1.10.2 Turkey Jerry Cans Market By Capacity

13.3.1.10.3 Turkey Jerry Cans Market By Shape

13.3.1.10.4 Turkey Jerry Cans Market By Manufacturing Process

13.3.1.10.5 Turkey Jerry Cans Market By End Use

13.3.1.11 Rest of Eastern Europe

13.3.1.11.1 Rest of Eastern Europe Jerry Cans Market By Material

13.3.1.11.2 Rest of Eastern Europe Jerry Cans Market By Capacity

13.3.1.11.3 Rest of Eastern Europe Jerry Cans Market By Shape

13.3.1.11.4 Rest of Eastern Europe Jerry Cans Market By Manufacturing Process

13.3.1.11.5 Rest of Eastern Europe Jerry Cans Market By End Use

13.3.2 Western Europe

13.3.2.1 Western Europe Jerry Cans Market By Country

13.3.2.2 Western Europe Jerry Cans Market By Material

13.3.2.3 Western Europe Jerry Cans Market By Capacity

13.3.2.4 Western Europe Jerry Cans Market By Shape

13.3.2.5 Western Europe Jerry Cans Market By Manufacturing Process

13.3.2.6 Western Europe Jerry Cans Market By End Use

13.3.2.7 Germany

13.3.2.7.1 Germany Jerry Cans Market By Material

13.3.2.7.2 Germany Jerry Cans Market By Capacity

13.3.2.7.3 Germany Jerry Cans Market By Shape

13.3.2.7.4 Germany Jerry Cans Market By Manufacturing Process

13.3.2.7.5 Germany Jerry Cans Market By End Use

13.3.2.8 France

13.3.2.8.1 France Jerry Cans Market By Material

13.3.2.8.2 France Jerry Cans Market By Capacity

13.3.2.8.3 France Jerry Cans Market By Shape

13.3.2.8.4 France Jerry Cans Market By Manufacturing Process

13.3.2.8.5 France Jerry Cans Market By End Use

13.3.2.9 UK

13.3.2.9.1 UK Jerry Cans Market By Material

13.3.2.9.2 UK Jerry Cans Market By Capacity

13.3.2.9.3 UK Jerry Cans Market By Shape

13.3.2.9.4 UK Jerry Cans Market By Manufacturing Process

13.3.2.9.5 UK Jerry Cans Market By End Use

13.3.2.10 Italy

13.3.2.10.1 Italy Jerry Cans Market By Material

13.3.2.10.2 Italy Jerry Cans Market By Capacity

13.3.2.10.3 Italy Jerry Cans Market By Shape  

13.3.2.10.4 Italy Jerry Cans Market By Manufacturing Process

13.3.2.10.5 Italy Jerry Cans Market By End Use

13.3.2.11 Spain

13.3.2.11.1 Spain Jerry Cans Market By Material

13.3.2.11.2 Spain Jerry Cans Market By Capacity

13.3.2.11.3 Spain Jerry Cans Market By Shape  

13.3.2.11.4 Spain Jerry Cans Market By Manufacturing Process

13.3.2.11.5 Spain Jerry Cans Market By End Use

13.3.2.12 The Netherlands

13.3.2.12.1 Netherlands Jerry Cans Market By Material

13.3.2.12.2 Netherlands Jerry Cans Market By Capacity

13.3.2.12.3 Netherlands Jerry Cans Market By Shape  

13.3.2.12.4 Netherlands Jerry Cans Market By Manufacturing Process

13.3.2.12.5 Netherlands Jerry Cans Market By End Use

13.3.2.13 Switzerland

13.3.2.13.1 Switzerland Jerry Cans Market By Material

13.3.2.13.2 Switzerland Jerry Cans Market By Capacity

13.3.2.13.3 Switzerland Jerry Cans Market By Shape 

13.3.2.13.4 Switzerland Jerry Cans Market By Manufacturing Process

13.3.2.13.5 Switzerland Jerry Cans Market By End Use

13.3.2.14 Austria

13.3.2.14.1 Austria Jerry Cans Market By Material

13.3.2.14.2 Austria Jerry Cans Market By Capacity

13.3.2.14.3 Austria Jerry Cans Market By Shape 

13.3.2.14.4 Austria Jerry Cans Market By Manufacturing Process

13.3.2.14.5 Austria Jerry Cans Market By End Use

13.3.2.15 Rest of Western Europe

13.3.2.15.1 Rest of Western Europe Jerry Cans Market By Material

13.3.2.15.2 Rest of Western Europe Jerry Cans Market By Capacity

13.3.2.15.3 Rest of Western Europe Jerry Cans Market By Shape  

13.3.2.15.4 Rest of Western Europe Jerry Cans Market By Manufacturing Process

13.3.2.15.5 Rest of Western Europe Jerry Cans Market By End Use

13.4 Asia-Pacific

13.4.1 Asia Pacific Jerry Cans Market By Country

13.4.2 Asia Pacific Jerry Cans Market By Material

13.4.3 Asia Pacific Jerry Cans Market By Capacity

13.4.4 Asia Pacific Jerry Cans Market By Shape

13.4.5 Asia Pacific Jerry Cans Market By Manufacturing Process

13.4.6 Asia Pacific Jerry Cans Market By End Use

13.4.7 China

13.4.7.1 China Jerry Cans Market By Material

13.4.7.2 China Jerry Cans Market By Capacity

13.4.7.3 China Jerry Cans Market By Shape

13.4.7.4 China Jerry Cans Market By Manufacturing Process

13.4.7.5 China Jerry Cans Market By End Use

13.4.8 India

13.4.8.1 India Jerry Cans Market By Material

13.4.8.2 India Jerry Cans Market By Capacity

13.4.8.3 India Jerry Cans Market By Shape

13.4.8.4 India Jerry Cans Market By Manufacturing Process

13.4.8.5 India Jerry Cans Market By End Use

13.4.9 Japan

13.4.9.1 Japan Jerry Cans Market By Material

13.4.9.2 Japan Jerry Cans Market By Capacity

13.4.9.3 Japan Jerry Cans Market By Shape

13.4.9.4 Japan Jerry Cans Market By Manufacturing Process

13.4.9.5 Japan Jerry Cans Market By End Use

13.4.10 South Korea

13.4.10.1 South Korea Jerry Cans Market By Material

13.4.10.2 South Korea Jerry Cans Market By Capacity

13.4.10.3 South Korea Jerry Cans Market By Shape  

13.4.10.4 South Korea Jerry Cans Market By Manufacturing Process

13.4.10.5 South Korea Jerry Cans Market By End Use

13.4.11 Vietnam

13.4.11.1 Vietnam Jerry Cans Market By Material

13.4.11.2 Vietnam Jerry Cans Market By Capacity

13.4.11.3 Vietnam Jerry Cans Market By Shape 

13.4.11.4 Vietnam Jerry Cans Market By Manufacturing Process

13.4.11.5 Vietnam Jerry Cans Market By End Use

13.4.12 Singapore

13.4.12.1 Singapore Jerry Cans Market By Material

13.4.12.2 Singapore Jerry Cans Market By Capacity

13.4.12.3 Singapore Jerry Cans Market By Shape 

13.4.12.4 Singapore Jerry Cans Market By Manufacturing Process

13.4.12.5 Singapore Jerry Cans Market By End Use

13.4.13 Australia

13.4.13.1 Australia Jerry Cans Market By Material

13.4.13.2 Australia Jerry Cans Market By Capacity

13.4.13.3 Australia Jerry Cans Market By Shape

13.4.13.4 Australia Jerry Cans Market By Manufacturing Process

13.4.13.5 Australia Jerry Cans Market By End Use

13.4.14 Rest of Asia-Pacific

13.4.14.1 APAC Jerry Cans Market By Material

13.4.14.2 APAC Jerry Cans Market By Capacity

13.4.14.3 APAC Jerry Cans Market By Shape

13.4.14.4 APAC Jerry Cans Market By Manufacturing Process

13.4.14.5 APAC Jerry Cans Market By End Use

13.5 The Middle East & Africa

13.5.1 Middle East

13.5.1.1 Middle East Jerry Cans Market By country

13.5.1.2 Middle East Jerry Cans Market By Material

13.5.1.3 Middle East Jerry Cans Market By Capacity

13.5.1.4 Middle East Jerry Cans Market By Shape

13.5.1.5 Middle East Jerry Cans Market By Manufacturing Process

13.5.1.6 Middle East Jerry Cans Market By End Use

13.5.1.7 UAE

13.5.1.7.1 UAE Jerry Cans Market By Material

13.5.1.7.2 UAE Jerry Cans Market By Capacity

13.5.1.7.3 UAE Jerry Cans Market By Shape

13.5.1.7.4 UAE Jerry Cans Market By Manufacturing Process

13.5.1.7.5 UAE Jerry Cans Market By End Use

13.5.1.8 Egypt

13.5.1.8.1 Egypt Jerry Cans Market By Material

13.5.1.8.2 Egypt Jerry Cans Market By Capacity

13.5.1.8.3 Egypt Jerry Cans Market By Shape

13.5.1.8.4 Egypt Jerry Cans Market By Manufacturing Process

13.5.1.8.5 Egypt Jerry Cans Market By End Use

13.5.1.9 Saudi Arabia

13.5.1.9.1 Saudi Arabia Jerry Cans Market By Material

13.5.1.9.2 Saudi Arabia Jerry Cans Market By Capacity

13.5.1.9.3 Saudi Arabia Jerry Cans Market By Shape

13.5.1.9.4 Saudi Arabia Jerry Cans Market By Manufacturing Process

13.5.1.9.5 Saudi Arabia Jerry Cans Market By End Use

13.5.1.10 Qatar

13.5.1.10.1 Qatar Jerry Cans Market By Material

13.5.1.10.2 Qatar Jerry Cans Market By Capacity

13.5.1.10.3 Qatar Jerry Cans Market By Shape

13.5.1.10.4 Qatar Jerry Cans Market By Manufacturing Process

13.5.1.10.5 Qatar Jerry Cans Market By End Use

13.5.1.11 Rest of Middle East

13.5.1.11.1 Rest of Middle East Jerry Cans Market By Material

13.5.1.11.2 Rest of Middle East Jerry Cans Market By Capacity

13.5.1.11.3 Rest of Middle East Jerry Cans Market By Shape

13.5.1.11.4 Rest of Middle East Jerry Cans Market By Manufacturing Process

13.5.1.11.5 Rest of Middle East Jerry Cans Market By End Use

13.5.2 Africa

13.5.2.1 Africa Jerry Cans Market By Country

13.5.2.2 Africa Jerry Cans Market By Material

13.5.2.3 Africa Jerry Cans Market By Capacity

13.5.2.4 Africa Jerry Cans Market By Shape

13.5.2.5 Africa Jerry Cans Market By Manufacturing Process

13.5.2.6 Africa Jerry Cans Market By End Use

13.5.2.7 Nigeria

13.5.2.7.1 Nigeria Jerry Cans Market By Material

13.5.2.7.2 Nigeria Jerry Cans Market By Capacity

13.5.2.7.3 Nigeria Jerry Cans Market By Shape

13.5.2.7.4 Nigeria Jerry Cans Market By Manufacturing Process

13.5.2.7.5 Nigeria Jerry Cans Market By End Use

13.5.2.8 South Africa

13.5.2.8.1 South Africa Jerry Cans Market By Material

13.5.2.8.2 South Africa Jerry Cans Market By Capacity

13.5.2.8.3 South Africa Jerry Cans Market By Shape

13.5.2.8.4 South Africa Jerry Cans Market By Manufacturing Process

13.5.2.8.5 South Africa Jerry Cans Market By End Use

13.5.2.9 Rest of Africa

13.5.2.9.1 Rest of Africa Jerry Cans Market By Material

13.5.2.9.2 Rest of Africa Jerry Cans Market By Capacity

13.5.2.9.3 Rest of Africa Jerry Cans Market By Shape 

13.5.2.9.4 Rest of Africa Jerry Cans Market By Manufacturing Process

13.5.2.9.5 Rest of Africa Jerry Cans Market By End Use

13.6 Latin America

13.6.1 Latin America Jerry Cans Market By Country

13.6.2 Latin America Jerry Cans Market By Material

13.6.3 Latin America Jerry Cans Market By Capacity

13.6.4 Latin America Jerry Cans Market By Shape

13.6.5 Latin America Jerry Cans Market By Manufacturing Process

13.6.6 Latin America Jerry Cans Market By End Use

13.6.7 Brazil

13.6.7.1 Brazil Jerry Cans Market By Material

13.6.7.2 Brazil Africa Jerry Cans Market By Capacity

13.6.7.3Brazil Jerry Cans Market By Shape

13.6.7.4 Brazil Jerry Cans Market By Manufacturing Process

13.6.7.5 Brazil Jerry Cans Market By End Use

13.6.8 Argentina

13.6.8.1 Argentina Jerry Cans Market By Material

13.6.8.2 Argentina Jerry Cans Market By Capacity

13.6.8.3 Argentina Jerry Cans Market By Shape

13.6.8.4 Argentina Jerry Cans Market By Manufacturing Process

13.6.8.5 Argentina Jerry Cans Market By End Use

13.6.9 Colombia

13.6.9.1 Colombia Jerry Cans Market By Material

13.6.9.2 Colombia Jerry Cans Market By Capacity

13.6.9.3 Colombia Jerry Cans Market By Shape

13.6.9.4 Colombia Jerry Cans Market By Manufacturing Process

13.6.9.5 Colombia Jerry Cans Market By End Use

13.6.10 Rest of Latin America

13.6.10.1 Rest of Latin America Jerry Cans Market By Material

13.6.10.2 Rest of Latin America Jerry Cans Market By Capacity

13.6.10.3 Rest of Latin America Jerry Cans Market By Shape  

13.6.10.4 Rest of Latin America Jerry Cans Market By Manufacturing Process

13.6.10.5 Rest of Latin America Jerry Cans Market By End Use

14 Company Profile

14.1 Greif Inc

14.1.1 Company Overview

14.1.2 Financials

14.1.3 Product/Services Offered

14.1.4 SWOT Analysis

14.1.5 The SNS View

14.2 Myers Industries Inc

14.2.1 Company Overview

14.2.2 Financials

14.2.3 Product/Services Offered

14.2.4 SWOT Analysis

14.2.5 The SNS View

14.3 Barrier Plastics Inc

14.3.1 Company Overview

14.3.2 Financials

14.3.3 Product/Services Offered

14.3.4 SWOT Analysis

14.3.5 The SNS View

14.4 Wilkinson Containers Ltd

14.4.1 Company Overview

14.4.2 Financials

14.4.3 Product/Services Offered

14.4.4 SWOT Analysis

14.4.5 The SNS View

14.5 DS Smith Plastics Ltd

14.5.1 Company Overview

14.5.2 Financials

14.5.3 Product/Services Offered

14.5.4 SWOT Analysis

14.5.5 The SNS View

14.6 Can-One Berhad

14.6.1 Company Overview

14.6.2 Financials

14.6.3 Product/Services Offered

14.6.4 SWOT Analysis

14.6.5 The SNS View

14.7 Time Technoplast Ltd

14.7.1 Company Overview

14.7.2 Financials

14.7.3 Product/Services Offered

14.7.4 SWOT Analysis

14.7.5 The SNS View

14.8 California Plastics Products

14.8.1 Company Overview

14.8.2 Financials

14.8.3 Product/Services Offered

14.8.4 SWOT Analysis

14.8.5 The SNS View

14.9 Nexus Packaging Ltd

14.9.1 Company Overview

14.9.2 Financials

14.9.3 Product/Services Offered

14.9.4 SWOT Analysis

14.9.5 The SNS View

14.10 Carrick Packaging

14.10.1 Company Overview

14.10.2 Financials

14.10.3 Product/Services Offered

14.10.4 SWOT Analysis

14.10.5 The SNS View

15. Competitive Landscape

15.1 Competitive Bench marking

15.2 Market Share Analysis

15.3 Recent Developments

15.3.1 Industry News

15.3.2 Company News

15.3.3 Mergers & Acquisitions

16. USE Cases and Best Practices

17. Conclusion

An accurate research report requires proper strategizing as well as implementation. There are multiple factors involved in the completion of good and accurate research report and selecting the best methodology to compete the research is the toughest part. Since the research reports we provide play a crucial role in any company’s decision-making process, therefore we at SNS Insider always believe that we should choose the best method which gives us results closer to reality. This allows us to reach at a stage wherein we can provide our clients best and accurate investment to output ratio.

Each report that we prepare takes a timeframe of 350-400 business hours for production. Starting from the selection of titles through a couple of in-depth brain storming session to the final QC process before uploading our titles on our website we dedicate around 350 working hours. The titles are selected based on their current market cap and the foreseen CAGR and growth.


The 5 steps process:

Step 1: Secondary Research:

Secondary Research or Desk Research is as the name suggests is a research process wherein, we collect data through the readily available information. In this process we use various paid and unpaid databases which our team has access to and gather data through the same. This includes examining of listed companies’ annual reports, Journals, SEC filling etc. Apart from this our team has access to various associations across the globe across different industries. Lastly, we have exchange relationships with various university as well as individual libraries.

Secondary Research

Step 2: Primary Research

When we talk about primary research, it is a type of study in which the researchers collect relevant data samples directly, rather than relying on previously collected data.  This type of research is focused on gaining content specific facts that can be sued to solve specific problems. Since the collected data is fresh and first hand therefore it makes the study more accurate and genuine.

We at SNS Insider have divided Primary Research into 2 parts.

Part 1 wherein we interview the KOLs of major players as well as the upcoming ones across various geographic regions. This allows us to have their view over the market scenario and acts as an important tool to come closer to the accurate market numbers. As many as 45 paid and unpaid primary interviews are taken from both the demand and supply side of the industry to make sure we land at an accurate judgement and analysis of the market.

This step involves the triangulation of data wherein our team analyses the interview transcripts, online survey responses and observation of on filed participants. The below mentioned chart should give a better understanding of the part 1 of the primary interview.

Primary Research

Part 2: In this part of primary research the data collected via secondary research and the part 1 of the primary research is validated with the interviews from individual consultants and subject matter experts.

Consultants are those set of people who have at least 12 years of experience and expertise within the industry whereas Subject Matter Experts are those with at least 15 years of experience behind their back within the same space. The data with the help of two main processes i.e., FGDs (Focused Group Discussions) and IDs (Individual Discussions). This gives us a 3rd party nonbiased primary view of the market scenario making it a more dependable one while collation of the data pointers.

Step 3: Data Bank Validation

Once all the information is collected via primary and secondary sources, we run that information for data validation. At our intelligence centre our research heads track a lot of information related to the market which includes the quarterly reports, the daily stock prices, and other relevant information. Our data bank server gets updated every fortnight and that is how the information which we collected using our primary and secondary information is revalidated in real time.

Data Bank Validation

Step 4: QA/QC Process

After all the data collection and validation our team does a final level of quality check and quality assurance to get rid of any unwanted or undesired mistakes. This might include but not limited to getting rid of the any typos, duplication of numbers or missing of any important information. The people involved in this process include technical content writers, research heads and graphics people. Once this process is completed the title gets uploader on our platform for our clients to read it.

Step 5: Final QC/QA Process:

This is the last process and comes when the client has ordered the study. In this process a final QA/QC is done before the study is emailed to the client. Since we believe in giving our clients a good experience of our research studies, therefore, to make sure that we do not lack at our end in any way humanly possible we do a final round of quality check and then dispatch the study to the client.

Start a Conversation

Hi! Click one of our member below to chat on Phone