Lubricant Additives Market Report Scope & Overview:
Get E-PDF Sample Report on Lubricant Additives Market - Request Sample Report
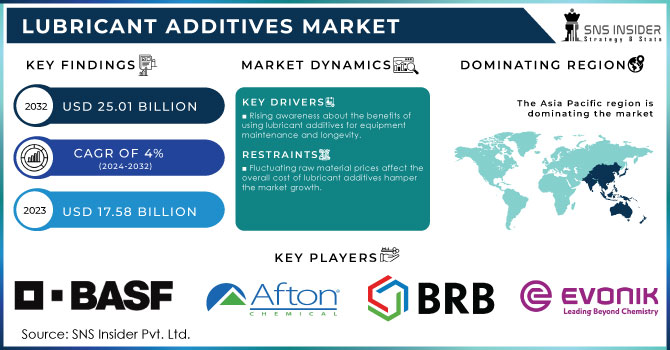
The Lubricant Additives Market Size was valued at USD 17.58 Billion in 2023. It is expected to grow to USD 25.01 Billion by 2032 and grow at a CAGR of 4% over the forecast period of 2024-2032.
The Lubricant Additives Market growth is driven by the rising need for high-performance lubricants in a wide range of applications. With the increasing complexity of machinery and equipment, lubricants alone may not suffice to meet the stringent requirements of modern industries. This has led to a surge in the demand for lubricant additives, as they offer tailored solutions to address specific challenges faced by different sectors.
One of the key drivers of the lubricant additives market is the automotive industry. As vehicles become more advanced and efficient, the demand for lubricants that can withstand extreme temperatures, reduce friction, and enhance fuel economy has skyrocketed. Lubricant additives, such as anti-wear agents, detergents, and dispersants, are essential in formulating lubricants that can meet these requirements and ensure optimal performance of engines and other automotive components.
The advancement in the automotive sector is a key driver for the global lubricating oil additives market, as modern vehicles require high-performance lubricants that have the capacity to work under brutal conditions with optimum fuel efficiency. Increased scrutiny on emission compliance and boosting engine durability are driving demand for additives, namely anti-wear agents, detergents, and dispersions. For example, in 2022, Afton Chemical Corporation introduced a newly developed series of additives to satisfy the tough fuel economy standards and emission regulations being imposed by governments all over the globe.
In 2023, the U.S. Department of Energy found that advanced lubricants could lower vehicle energy consumption by as much as 6 percent, an indication of how far lubricant technology has to go to improve vehicle efficiency. Equally, in 2020, BASF launched a new range of low-viscosity engine oils tailored for fuel-efficient lubes within the automotive industry. Such factor is anticipated to boost the market growth as lubricant additives play a crucial role in offering maximum performance efficiency of advanced automotive engines.
These enhancers help lubricants to flow better in the engine, allowing them to perform smoothly under different temperatures, which results in increased fuel efficiency. The newly released dispersant technology in 2023 by Infineum International Limited reduces the sludge and deposits around engines, resulting in cleaner combustion and fewer emissions. Not only will the development help meet regulatory compliance, it will also increase engine component life to illustrate the industry's progressing commitment to sustainability
Lubricant Additives Market Dynamics
Drivers
-
Rising demand for high-performance lubricants in various industries.
-
Growing automotive industry and the need for fuel-efficient vehicles.
-
Rising awareness about the benefits of using lubricant additives for equipment maintenance and longevity.
Increasing awareness about the use of lubricant additives for equipment maintenance and lifespan has had a considerable impact on the growth rate of the market for lubricant additives. With a greater understanding of the benefits of lubricant additives, especially in conjunction with improvements to equipment uptime and lifespan, industries are adopting more refined-quality oils. Effective lubrication may also cut energy usage in industrial equipment by up to 10%, the U.S. Department of Energy reports, and lower maintenance costs, making the economic case for lubricant additives more appealing.
With this growing awareness, manufacturers have developed additives that bring a totally new level of performance. In another example, during the early months of 2022, Chevron Oronite Company introduced a new line of additive packages specifically formulated for enhancing the operational performance of lubricants in heavy-duty applications to underline the significance of lubrication in equipment upkeep. In 2023, TotalEnergies launched its latest and most advanced antioxidant additives designed to prevent oxidative degradation often one of the primary causes behind equipment failure and extended downtime. This proactive approach to hinder maintenance issues and machine extension, by utilizing specific lubricant additives, is demonstrated through these actions in the industry that underpins sustainability within industrial practices.
Restraint
-
Fluctuating raw material prices affect the overall cost of lubricant additives hamper the market growth.
This main challenge can be further related to the cost fluctuations in lubricant additives raw materials which ultimately promote stagnant growth of manufacturers & suppliers within the industry. The cost of base oils and most chemical additives can vary as they are high-priced labile raw materials influenced by geopolitical tensions, disruptions to the supply chain, and fluctuations in crude oil prices. For example, in 2022, the global supply chain issue and the surge of energy costs have pushed up prices for raw materials used in lubricant formulations so manufacturers had no other choice than to adjust their pricing strategies in response. This volatility leads to lower profit margins and forces manufacturers to increasingly invest in leaner production processes and new sourcing models. Therefore, the lubricant additives market continues to wrestle with conundrums of being cost-effective while still delivering high-performance products, consequentially impacting affordability and supply for end-users.
Opportunities
-
Increasing focus on sustainable and bio-based lubricant additives
-
Growing demand for synthetic lubricants in various industries
Lubricant Additives Market Segmentation
By Product
The Viscosity Index Improvers segment was the dominant product in 2023, accounting for over 35% of the revenue share. Viscosity index improvers are polymers that are added to lubricating oils to minimize changes in viscosity at both low and high temperatures. These additives play a crucial role in engine oil formulations.
Recovery of manufacturing sectors in developed economies of North America and Europe such as the U.S., UK, Germany, and Italy will drive consumption over the forecast horizon. Increasing government regulations to achieve fuel economy targets is anticipated to impact further industry dynamics. Stringent regulations that are pushing countries such as the U.S., Canada, and Mexico to reduce carbon emissions have created a huge demand for anti-wear additives in the North American region.
By Application
The automotive lubricants segment held the largest share around 65.86% in 2023. Due to its exceptional oxidative stability, improved solvency & decreased volatility, lubricant additives like dispersants, viscosity index enhancers, anti-oxidants & friction modifiers are largely being used in the fuel systems of automotive vehicles for both gasoline & diesel engines. Fuel economy and temperature performance are staging required in due course, keep clean of the engine burning mixed together diesel fuel lacks than the industry has oil.
In addition, the burgeoning industrial & automotive sectors in China, India & Japan are key factors influencing demand for Lubricant Additives Growth in Asia Pacific. The government introduced several regulations in the automotive industry to enhance fuel efficiency which also accelerates the consumption of high-performance lubricant additives. In addition, the increasing disposable income of consumers has driven the production of passenger cars & heavy-duty vehicles that have further augmented demand for lubricants on account of higher volumes used.
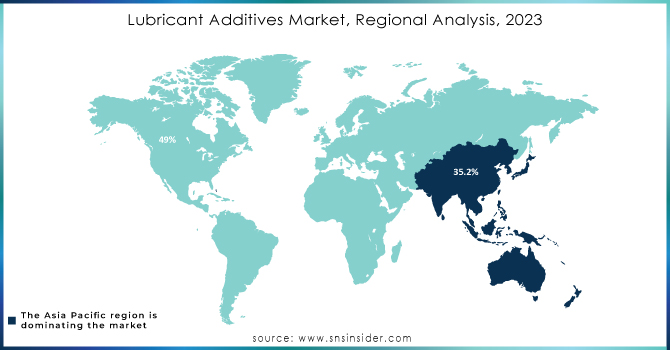
Lubricant Additives Market Regional Analysis
Asia Pacific dominated the Lubricant Additives Market with the highest revenue share of about 35.2% in 2023. This is due to factors such as the rapid growth of economies and a surge in investments across various industrial sectors. Our secondary research reveals that the automobile sector in India has been a magnet for foreign direct investment (FDI), attracting a staggering amount of USD 33.77 billion between April 2000 and September 2022. Furthermore, the 2022 report from the European Automobile Manufacturers Association highlights China's significant contribution to global vehicle production, accounting for 34% of the 66.2 million cars manufactured worldwide. Europe follows closely behind with a 23% share, while Japan and Korea collectively contribute 16%. Moreover, the China Electronic Information Industry Development predicts that China will allocate a substantial sum of USD 1.4 trillion towards new infrastructure projects between 2020 and 2025. These investments will encompass various sectors, including renewable energy and residential buildings. Consequently, the construction and automobile industries in China and India, as well as the automobile sector in Japan and Korea, are experiencing rapid development. This, in turn, has generated a surge in demand for advanced lubrication solutions within the Asia Pacific region.
North America held the significant revenue share of the Lubricant Additives Market and is expected to grow with a CAGR of about 4.3% during the forecast period. One of the key factors contributing to North America's substantial revenue share is its robust industrial sector. The region boasts a thriving manufacturing industry, which heavily relies on lubricants to ensure smooth operations and enhance the lifespan of machinery. As a result, the demand for lubricant additives, which improve the performance and efficiency of lubricants, has witnessed a significant upsurge. Additionally, the growing automotive sector in North America has contributed significantly to the demand for lubricant additives. With a rising number of vehicles on the road, the need for high-performance lubricants has surged.
Get Customized Report as Per Your Business Requirement - Request For Customized Report
Key Players
-
Afton Chemical Corp. (AFTON 2200, AFTON 3040)
-
BASF SE (BASOLUBE, Irganox)
-
BRB International (BRB 100, BRB 101)
-
Chevron Chemicals (Delo 400, Havoline)
-
Evonik Industries (VISCOPLUS, TEGO®)
-
Lubrizol Corporation (Lubrizol 5240, Lubrizol 5100)
-
Infineum International Limited (Infineum SCA 60, Infineum 191)
-
Croda International PLC (Croda Lube, Croda BioLube)
-
Dover Chemical Corporation (DOVERLUBE 31700, DOVERLUBE 30700)
-
Clariant International Ltd (Licocene, Exolit)
-
LANXESS
-
TotalEnergies (Total Fluid, Total Eco-Flow)
-
Chemtura Corporation (Aerosol 1000, Lube 222)
-
Shamrock Shipping & Trading Ltd.
-
Tianhe Chemicals Group
-
Houghton International Inc. (Houghton HTD, Houghton MP)
-
Fuchs Petrolub SE (Fuchs Titan, Fuchs Ecoclean)
-
Petro-Canada Lubricants (Duron, Varityl)
-
SABIC (SABIC S430, SABIC S270)
-
Kraton Corporation (Kraton G, Kraton D)
-
Rheinfelden Group (Rhenocoll, Rhenodix)
-
Chevrol USA (Chevrol 2000, Chevrol 1000)
Recent Development:
-
In Feb 2023, as lithium prices continue to rise, Lubrizol is dedicated to providing alternative, high-performance, and cost-effective solutions for industrial grease-thickening to grease manufacturers worldwide. To support the testing and development of calcium sulfonate greases, which have great potential in the industrial grease market, Lubrizol has established a new grease lab in Navi Mumbai, India.
-
In Nov. 2022, BRB inaugurated a new facility in Echt, Netherlands, exclusively for lube oil additives and chemicals. This state-of-the-art facility prioritizes sustainable production practices, effectively reducing its carbon footprint. The Malaysian Ambassador to the Netherlands, H.E., was present at the opening ceremony.
-
In August 2022, BASF commenced the production of fuel performance additives at its Pudong site in Shanghai, China. This new plant was established to meet the growing regional demand for fuel performance additives and to provide customers in Asia with enhanced supply security and flexibility.
-
In March 2022, Afton Chemical Corporation, a global leader in the lubricant and fuel additive market, completed the third phase of its expansion. This expansion included the addition of Gasoline Performance Additives (GPA) blending capabilities at its Singapore Chemical Additive Manufacturing Facility.
| Report Attributes | Details |
| Market Size in 2023 | US$ 17.58 Bn |
| Market Size by 2031 | US$ 24.05 Bn |
| CAGR | CAGR of 4% From 2024 to 2031 |
| Base Year | 2023 |
| Forecast Period | 2024-2031 |
| Historical Data | 2020-2022 |
| Report Scope & Coverage | Market Size, Segments Analysis, Competitive Landscape, Regional Analysis, DROC & SWOT Analysis, Forecast Outlook |
| Key Segments | • By Product (Antioxidants, Dispersants, Detergents, Anti-wear Additives, Viscosity Index Improvers, Friction Modifiers, and Others) • By Application (Automotive Lubricants and Industrial Lubricants) |
| Regional Analysis/Coverage | North America (US, Canada, Mexico), Europe (Eastern Europe [Poland, Romania, Hungary, Turkey, Rest of Eastern Europe] Western Europe] Germany, France, UK, Italy, Spain, Netherlands, Switzerland, Austria, Rest of Western Europe]), Asia Pacific (China, India, Japan, South Korea, Vietnam, Singapore, Australia, Rest of Asia Pacific), Middle East & Africa (Middle East [UAE, Egypt, Saudi Arabia, Qatar, Rest of Middle East], Africa [Nigeria, South Africa, Rest of Africa], Latin America (Brazil, Argentina, Colombia Rest of Latin America) |
| Company Profiles | Evonik Industries, LANXESS, BASF SE, Croda International, Chevron Oronite Company, Hornett Brothers & Co. Ltd., Shamrock Shipping & Trading Ltd., Chemtura Corporation, Afton Chemical Corp., Lubrizol Corp., Tianhe Chemicals Group, Infineum International, BRB International |
| Key Drivers | • Increasing demand for high-performance lubricants in various industries. • Growing automotive industry and the need for fuel-efficient vehicles. • Rising awareness about the benefits of using lubricant additives for equipment maintenance and longevity. • Technological advancements in lubricant additive formulations |
| Market Restraints | • Fluctuating raw material prices affect the overall cost of lubricant additives. • Limited availability of certain additives in the market. |
Frequently Asked Questions
Yes, you can ask for the customization as per your business requirement.
The Asia-Pacific region dominated the Lubricant Additives Market in 2023.
The Passenger Car Motor Oil in the automotive lubricant application segment dominated the Lubricant Additives Market and is expected to show dominance during the forecast period.
The projected market size for the Lubricant Additives Market is USD 24.05 billion by 2031.
The Compound Annual Growth rate for the Lubricant Additives Market over the forecast period is 4%.
Get in Touch
