SYNTHETIC LUBRICANTS MARKET REPORT SCOPE & OVERVIEW:
Get more information on Synthetic Lubricants Market - Request Sample Report
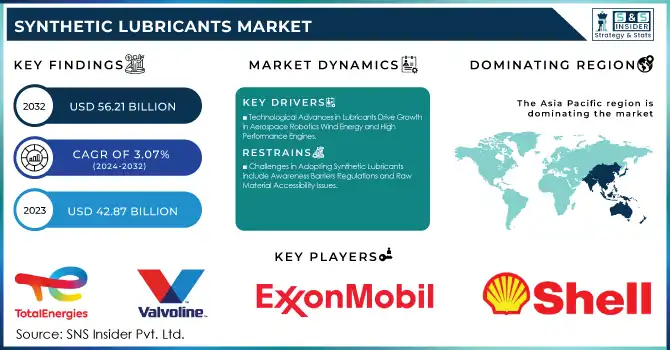
The Synthetic Lubricants Market was valued at USD 42.87 billion in 2023 and is expected to reach USD 56.21 Billion by 2032, growing at a CAGR of 3.07 % over the forecast period 2024-2032.
The global synthetic lubricants market share is primarily achieved due to the growing demand for high-performance lubricants along with enhanced efficiency, longer durability, and eco-friendly traits offered by these products. A major element in this is the increased emphasis on sustainability and carbon neutrality. Do not waste energy: Synthetic lubricants reduce waste and energy consumption compared to conventional lubricants, since they are stable at extreme temperatures and allow longer drain intervals. This makes them very enticing to sectors like automotive, aviation, and manufacturing that need to comply with strict environmental standards. Furthermore, the rise of electric vehicles (EVs) has led to the increased requirement for dedicated lubricants to fulfill distinct components of an EV such as e-transmissions and battery cooling systems. Compared to conventional oils, synthetic lubricants deliver up to 50% longer oil drain intervals and within many industrial applications, provide a 12% reduction in energy consumption. Expected to comprise 70% of new vehicle models in North America and Europe by 2024, they reduce greenhouse gas emissions by 30% or more. Global EV sales are expected to be up 35% year-on-year in 2024, supporting demand for new specialty lubricants like e-transmission fluids and battery coolants.
The other major growth factor includes the industrialization widespread and automation around the emerging economies. The demand for synthetic lubricants is attributable to the need for improved thermal stability, oxidation resistance, and longer service life, particularly for heavy machinery, robotics, and production equipment. Market growth is amplified by the energy-efficient solutions demand across power generation and rising applications in other industries such as construction and mining. In addition, sophisticated investment in research and development (R&D) for bio-based synthetic lubricants and government initiatives toward using green products will add new opportunities for growth in the coming years. These factors make a sure shot entry for synthetic lubricants into the market in the long run. Renewable generation capacity increased by 24.1 GW in 2023, and energy storage added a record 6.2 GW for the fourth year in a row. Fortescue Metals Group signed a USD 4.06 billion agreement to retrofit two-thirds of its mining fleet for zero-emissions battery technology, which includes 360 electric trucks and 55 electric excavators in the construction and mining industry. The clean energy jobs that increased in 2023 also counted 148,000 new jobs or 59% of new energy jobs from the U.S. Energy and Employment Report 2024.
Synthetic Lubricants Market Dynamics
KEY DRIVERS:
- Technological Advances in Lubricants Drive Growth in Aerospace Robotics Wind Energy and High-Performance Engines
Technological developments in lubricant formulation are one of the major factors driving the synthetic lubricants market. Advancements in chemical engineering and molecular synthesis have led to advanced synthetic lubricants with higher viscosity index, oxidation resistance, and greater thermal stability. Such properties enable lubricants to function under high temperatures and heavy-load conditions, which are critical in industries such as aerospace, marine, and high-precision manufacturing. In addition, the rising demand for tailor-made and application-oriented lubricants in industrial robotics, wind energy, and advanced automotive engines has further contributed to the increase in R&D of the market. Nanotechnology-based lubricants with superior friction and wear properties are also anticipated to change the dynamics of the market by encouraging more adoption of synthetic lubricants in high-tech industries. By 2023, synthetic lubricants were lasting 3–4 times longer than their mineral oils counterparts, the aviation sector benefitted from this extended lifespan. More than 3 million industrial robots are in operation all over the globe and increasingly need specialized industrial lubricants. Wind energy has increased in turbine capacity by 12% which calls for high-performance lubricants for gearboxes. Friction in high-performance machines was reduced by 40% with nanotechnology lubricants. Consumer Vehicles Electric vehicles (EV) need oils that can endure 30% more thermal loads than conventional gasoline and diesel vehicles. In the marine industry, 10% of fuel use was reported with synthetic oils, and in high-performance automotive engines, specialized lubricants have enabled the handling of 40% higher stress.
- Industrial Automation and Smart Manufacturing Drive Increased Demand for Synthetic Lubricants in Global Markets
Industrial automation along with smart manufacturing is one of the major drivers for the synthetic lubricants market. The growing trend of utilizing more automated systems, robotics, and Industry 4.0 machinery in factories around the globe has significantly increased the demand for high-performance lubricants that fulfill the requirements of extended service life and excellent protection against wear. Due to their continuous operation and high workload, automated machinery and smart production lines require lubricants that reduce downtime, reduce maintenance frequency, and improve usability efficiency. Used primarily to increase the length of an oil change interval and insulate machinery from damage, synthetic lubricants have become a must-have item for manufacturers looking to keep production running without interruption and offer a solution to reduce the risk of equipment breakdowns and the subsequent loss of production per hour, by eliminating one of the root cause opportunities. Moreover, the growing deployment of predictive maintenance solutions that use IoT sensors to monitor the performance of the lubricant in real-time, has further increased the demand for synthetic lubricants. More than 45% of the worldwide manufacturers adopt IoT-enabled predictive maintenance solutions saving up to 30% of downtime and increasing the life of machinery from 30%. With the introduction of synthetic lubricants, oil change intervals are coming down by 50%, thus contributing to lower maintenance costs for the operators. North American and European manufacturing accounts for about 70% of the implementation of automation in the manufacturing industry to minimize labor work and ensure consistency which, in turn, indirectly contributes to the use of synthetic lubricants to withstand the proper functioning of the machineries.
RESTRAIN:
- Challenges in Adopting Synthetic Lubricants include Awareness Barriers Regulations and Raw Material Accessibility Issues
The major factor restraining the growth of the synthetic lubricants market is the awareness and understanding levels of the benefits of synthetic lubricants in smaller industries and consumers. Several businesses stick to their conventional lubricants as they are already used to them, and there is a hesitation to switch from long-established habits. In other cases, certain industries may not be entirely well aware of the long-term performance benefits, such as increased service intervals and better efficiency, that synthetics deliver. Another problem has to do with the strict regulations covering the manufacturing and disposal of synthetic lubes. Even though these lubricants are less harmful to the environment, their production process as well as their disposal are still under strict regulation in some regions. Other factors may include a lack of accessibility of raw materials along with supply chain issues which may lead to production timelines being delayed especially in the case of bio-based synthetic lubricants which are relatively more difficult to produce. In some markets, these are an impediment to greater adoption and growth of synthetic lubricants.
Synthetic Lubricants Market Segmentation Analysis
BY TYPE
In 2023, polyalphaolefins (PAOs) held the largest share of 47.2% of the global synthetic lubricants market, owing to their extensive use in high-performance applications. PAOs exhibit remarkable properties including high thermal stability low volatility and high wear protection and are good candidates for automotive industrial and high-temperature applications. The versatility, excellent shelf-life, and resistance to extreme conditions turn this technology into a dominant one, especially in the automotive and heavy machinery sectors, where reliability is of the utmost importance. PAOs are equally a good fit for applications focused on emissions/fuel efficiency improvements in internal combustion engines to global sustainability trends.
Polyalkylene Glycols (PAGs) are projected to experience the fastest growing CAGR for the period of 2024-2032 due to their high-water solubility, which makes them an excellent choice for specialized mean needs such as refrigeration, air conditioning, and industrial processing. PAGs also better operate at extremely cold temperatures and high-load situations, both a plus for industries focused on efficiency and sustainability. However, with more industries utilizing advanced eco-friendly systems, the demand for PAG-based lubricants, especially in sectors concerned with the environment such as renewable energy and electric vehicles, is projected to increase. Moreover, the further development of PAG formulations as well as the rise of their deployment in high-precision machinery will accelerate the market growth further.
BY PRODUCT TYPE
In 2023, engine oils accounted for 29.6% of the synthetic lubricants market owing to the significant applications of synthetic lubricants in the automotive sector. Engine oils are essential to internal combustion engines as they reduce friction, limit wear, and increase engine efficiency. Increasing demand for high-performance and fuel-efficient vehicles has, in turn, spurred the adoption of advanced engine oils with fully synthetic and semi-synthetic formulations. Additionally, emissions regulations and the demand for extended oil change intervals have increased the demand for improved engine oils which provide greater stability, reduced carbon deposits, and increased performance under higher temperature and load conditions of modern engines.
Hydraulic fluids are projected to register the highest CAGR of over 5% from 2024 to 2032 as they are essential to many manufacturing and construction processes. Hydraulic fluids play an important role in machinery, they are used to keep things running and systems that rely on fluid power for movement and operation, such as construction equipment, mining machinery, and manufacturing lines. As the industrialization and automation trend continues to grow, coupled with the demand for heavy machinery in emerging economies, the demand for high-performance hydraulic fluids is growing. Synthetic hydraulic fluids offer excellent viscosity, thermal stability, and wear protection so that lubricant performance in hydraulic systems can be enhanced. Moreover, the increased development of sustainable hydraulic fluids that are eco-friendly and Biodegradable, with numerous sectors focusing on cleaner production and stricter environmental laws, is further boosting the hydraulic fluids segment.
Synthetic Lubricants Market Regional Outlook
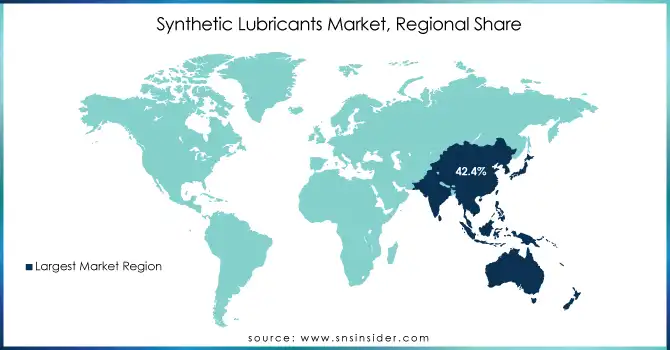
In 2023, Asia Pacific held the largest share of the synthetic lubricants market, accounting for 42.4%, owing to a strong industrial base and expanding automotive and manufacturing sectors in the region. The high-performance lubricants market is driven by countries such as China, India, and Japan. These countries have a significant share of the demand for high-quality lubricants for automotive, industrial, and electronic applications. As an illustration, the demand for advanced synthetic engine oils has been significantly boosted in China due to its rapidly expanding automotive market and the efforts by the government towards the production of energy-efficient and environment-friendly vehicles. Furthermore, the growth of the manufacturing sector in India fueled by the development of infrastructure and industrialization is expected to create further demand for specialty lubricants such as hydraulic fluids and industrial oils. The automotive sector in Japan has been undergoing a paradigm shift, driven by OEM-focused R&D for advanced technologies, such as electric, automation, and robotics resulting in enhanced adoption of high-performance synthetic lubricants, especially in precision machinery and high-tech manufacturing.
Europe is projected to have the fastest CAGR during the forecast period from 2024-2032, due to strict environmental regulations, technological developments, and an emphasis on sustainability. The increasing focus on carbon emission reduction and energy efficiency in sectors including automotive, aerospace, and industrial machinery in the region is driving the demand for synthetic lubricants with improved operating performance properties. As an example, the German automotive sector, known for brands such as BMW, Mercedes-Benz, and Volkswagen, is quickly uploading onto synthetic oils to achieve fuel economy and emission regulations. It is also driving demand for specialty lubricants for electric vehicle (EV) powertrains and battery cooling systems as the market for EVs in Europe grows with the focus of Tesla and many European automakers on EVs. For instance, the use of bio-based and biodegradable lubricants is increasingly gaining proportion in European countries which will help the dominance of the region for the synthetic lubricant market.
Get Customized Report as per your Business Requirement - Request For Customized Report
KEY PLAYERS
Some of the major players in the Synthetic Lubricants Market are:
- Shell (Shell Helix Ultra, Shell Rimula)
- ExxonMobil (Mobil 1, Mobil Super)
- BP (Castrol EDGE, Castrol GTX)
- TotalEnergies (Total Quartz, Total Rubia)
- Chevron (Chevron Havoline, Chevron Delo)
- FUCHS (FUCHS Titan, FUCHS Renolin)
- Valvoline (Valvoline Advanced Full Synthetic, Valvoline High Mileage)
- Amsoil (Amsoil Signature Series, Amsoil XL Series)
- PetroChina (PetroChina Synthetic Motor Oil, PetroChina Gear Oil)
- Sinopec (Sinopec Synthetic Motor Oil, Sinopec Gear Oil)
- JAX INC. (JAX Industrial Lubricants, JAX Food Grade Lubricants)
- Klüber Lubrication (Klüber Summit, Klüber Lubrication Greases)
- Kano Laboratories (Kroil Penetrating Oil, Kano Rust Remover)
- McLube (McLube Industrial Lubricants, McLube Mold Release Agents)
- MagLube (MagLube Industrial Lubricants, MagLube Metalworking Fluids)
- Micro Surface Corporation (Micro Surface Lubricants, Micro Surface Coatings)
- Moore & Balliew Oil Company (Moore & Balliew Industrial Oils, Moore & Balliew Hydraulic Fluids)
- Mars Supply (Mars Industrial Lubricants, Mars Food Grade Lubricants)
- Mars Company (Mars Industrial Lubricants, Mars Food Grade Lubricants)
- Mars Supply (Mars Industrial Lubricants, Mars Food Grade Lubricants)
Some of the Raw Material Suppliers for Synthetic Lubricants companies:
- Cargill
- Chevron Phillips Chemical Company
- ExxonMobil Chemical
- BASF
- Evonik Industries
- Lubrizol Corporation
- Afton Chemical Corporation
- Infineum International Limited
- Clariant International Ltd.
- Lanxess AG
RECENT TRENDS
- In April 2024, Shell launched Shell Helix HX6 5W-30 and Shell Helix SUV 5W-30, a new range of BS-VI-compliant synthetic engine oils in India.
- In November 2024, Valvoline launched its new Full Synthetic Gear Oil offering premium protection against gear wear, providing up to four times better wear protection than standard oils.
- In July 2024, AMSOIL INC. acquired Aerospace Lubricants to enhance its grease formulation and expand its industrial market presence. This strategic acquisition supports AMSOIL's growth objectives across various sectors, including aerospace and military.
| Report Attributes | Details |
|---|---|
| Market Size in 2023 | USD 42.87 Billion |
| Market Size by 2032 | USD 56.21 Billion |
| CAGR | CAGR of 3.07% From 2024 to 2032 |
| Base Year | 2023 |
| Forecast Period | 2024-2032 |
| Historical Data | 2020-2022 |
| Report Scope & Coverage | Market Size, Segments Analysis, Competitive Landscape, Regional Analysis, DROC & SWOT Analysis, Forecast Outlook |
| Key Segments | • By Type (Esters, PAOs, Group III (Hydrocracking), PAGs) • By Product Type (Gear Oils, Metalworking Fluids, Compressor Oils, Transmission Fluids, Refrigerant Oils, Hydraulic Fluids, Engine Oils, Turbine Oils) |
| Regional Analysis/Coverage | North America (US, Canada, Mexico), Europe (Eastern Europe [Poland, Romania, Hungary, Turkey, Rest of Eastern Europe] Western Europe] Germany, France, UK, Italy, Spain, Netherlands, Switzerland, Austria, Rest of Western Europe]), Asia Pacific (China, India, Japan, South Korea, Vietnam, Singapore, Australia, Rest of Asia Pacific), Middle East & Africa (Middle East [UAE, Egypt, Saudi Arabia, Qatar, Rest of Middle East], Africa [Nigeria, South Africa, Rest of Africa], Latin America (Brazil, Argentina, Colombia, Rest of Latin America) |
| Company Profiles | Shell, ExxonMobil, BP, TotalEnergies, Chevron, FUCHS, Valvoline, Amsoil, PetroChina, Sinopec, JAX INC., Klüber Lubrication, Kano Laboratories, McLube, MagLube, Micro Surface Corporation, Moore & Balliew Oil Company, Mars Supply, Mars Company, Mars Supply |
| Key Drivers | • Technological Advances in Lubricants Drive Growth in Aerospace Robotics Wind Energy and High-Performance Engines • Industrial Automation and Smart Manufacturing Drive Increased Demand for Synthetic Lubricants in Global Markets |
| Restraints | • Challenges in Adopting Synthetic Lubricants include Awareness Barriers Regulations and Raw Material Accessibility Issues |
Frequently Asked Questions
The Synthetic Lubricants Market is expected to grow at a CAGR of 3.07% during 2024-2032.
Synthetic Lubricants Market size was USD 42.87 Billion in 2023 and is expected to Reach USD 56.21 Billion by 2032.
The major growth factor of the synthetic lubricants market is the increasing demand for high-performance, environmentally-friendly lubricants in industries like automotive, manufacturing, and aerospace.
The PAOs segment dominated the Synthetic Lubricants Market in 2023.
Asia Pacific dominated the Synthetic Lubricants Market in 2023.
Get in Touch
