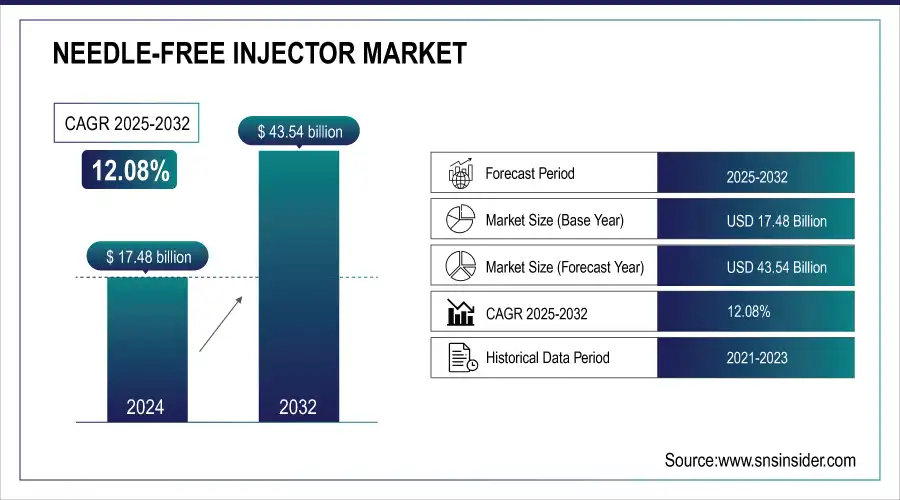
Needle-Free Injector Market Overview and Size

The Needle-Free Injector Market was valued at USD 17.48 billion in 2024 and is expected to reach USD 43.54 billion by 2032, growing at a CAGR of 12.08% from 2025-2032. 

The needle-free injectors market is set for substantial growth, driven by rising regulatory approvals, the need for self-administration, and safety advantages over traditional injections. These devices eliminate pain and infection risks while enhancing patient and healthcare provider safety. Companies like Prejex, Polybond, and collaborations such as Scancell with PharmaJet are advancing global distribution and clinical applications. Needle-free injectors also enable at-home administration, reducing hospital visits and healthcare costs. These trends highlight a shift in drug delivery technology and underscore the increasing significance of needle-free injectors in modern healthcare.

Needle-Free Injector Market Revenue Analysis

To Get More Information on Needle-Free Injector Market - Request Sample Report

Based on the American Nurses Association, it is estimated that 74% of needlestick injuries are caused by contamination and may lead to serious infections. Treating these injuries is costly, with the Centers for Disease Control and Prevention estimating that treatment expenses range between USD 500 and over USD 3,000 per incident.

The CDC also estimates that approximately 385,000 needlestick injuries are reported annually in U.S. hospitals, while the European Agency for Safety and Health at Work reports about one million needlestick injuries globally each year.

Needle-Free-Injector-Market-US

With various health funding and insurance programs in place, health expenses in the U.S. reach about 2.4 times the global average and are projected to increase by 68% over the next decade.

Advantages of Needle-Free Injectors Over Traditional Injectors

Feature Needle-Free Injectors Traditional Injectors
Pain Level Minimal to no pain Moderate to high pain
Infection Risk Lower risk of infections Higher risk due to needle exposure
Ease of Use Simple application, often one-handed Requires careful handling and technique
Waste Management No sharps waste; environmentally friendly Generates sharps waste; requires disposal
Patient Compliance Increased compliance due to comfort Lower compliance due to fear of needles

Needle-Free Injector Market Trends

  • Rising demand for painless and convenient drug delivery is driving needle-free injector adoption.

  • Increasing use in vaccines, insulin, and biologics is expanding market applications.

  • Advancements in spring-based, jet, and electronic injectors are improving precision and patient compliance.

  • Growing focus on reducing needle-stick injuries and medical waste is boosting adoption in healthcare settings.

  • Home healthcare and self-administration trends are accelerating market growth.

  • Integration with digital tracking and smart devices is enhancing dosage accuracy and monitoring.

  • Collaborations between pharmaceutical companies and medical device manufacturers are fostering innovation.

Needle-Free Injector Market Growth Drivers:

Diabetes and Cosmetic Procedures Fueling Market Growth

The escalating prevalence of diabetes globally further drives the demand for self-injection systems, including needle-free injectors. Patients now seek easier self-medication. Increased chronic diseases combined with increased use of injectables enhance this demand. The motive behind its preference is mainly because injectables include drugs with immediate onset of action and possess superior bioavailability, which is strongly needed in emergencies. With recent technological developments, the acceptance of cosmetic procedures such as skin whitening and body mark removal has significantly transformed. The previous main limitation for market growth was the high costs associated with surgery; however, with the recent introduction of innovative devices such as needle-free injectors, easier acceptance and usage are now possible.

This NFIT is composed of many systems that deliver medicine across the dermis, thereby aiding the pharma industry and mass immunization efforts in less developed countries. This NFIT eliminates the possibility of causing needlestick injury, one of the major risks because CDC believes there are approximately 385,000 needlestick injuries annually in U.S. hospitals. These are found to occur mainly when needles are in use or when they are being disposed of; there is a growing demand for safer alternatives such as needle-free injectors. The cosmetic industry is seeing growth in the adoption of needle-free injectors, which is highly stimulated by high growth in cosmetic procedures. The American Society of Plastic Surgeons (ASPS) reported that in 2023, 25.4 million cosmetic procedures were performed, which comprised 1.6 million surgical procedures and 23.8 million minimally invasive procedures, including neuromodulator injections and hyaluronic acid fillers.

Needle-Free Injector Market Restraints:

High Operating Costs and Sterilization Challenges

High operating costs remain a major challenge in the needle-free injectors market, primarily due to the complexity of manufacturing equipment and stringent sterilization requirements. The production of needle-free injectors demands advanced machinery capable of precise dosing, high-pressure delivery systems, and robust safety mechanisms, all of which incur significant capital and maintenance expenses. In addition, strict sterilization protocols must be followed to ensure patient safety, prevent contamination, and comply with regulatory standards, further increasing operational expenditures. These factors collectively elevate the cost of production and limit scalability, posing a barrier for manufacturers seeking to expand their offerings and maintain competitive pricing in a growing market.

Needle-Free Injector Market Segment Analysis

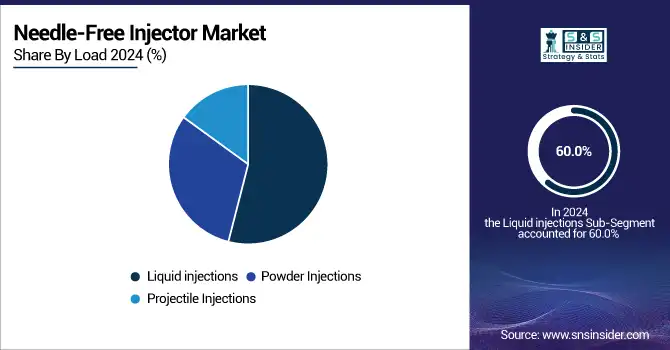
By Load Liquid Injections dominated while Powder Injections are expected to grow fastest

Liquid injections were the most dominant segment, accounting for approximately 60.0% market share in 2024. This is owing to their usage in numerous medical applications, including drug delivery and vaccination. Liquid formulations enjoy an edge over their solid counterparts primarily due to easier administration along with substantial regulation of dosage and immediate bioavailability. The growth in demand for liquid injections is facilitated by the increased prevalence of chronic diseases and the emerging need for effective vaccination strategies. The segment expected to grow the fastest soon is powder injections; this segment is estimated to increase at around 12% CAGR. This growth can be traced to the increased demand for powder formulations that enhance stability and increase shelf life in comparison to liquid-based counterparts. Injections based on powder formulations are useful for biologics and vaccines as they require a great deal of stability to remain effective.

Needle-Free-Injector-Market-By-Load

By Technology Spring-Loaded Jet Injectors dominated while Battery-Powered Jet Injectors are expected to grow fastest

Spring-loaded jet injectors held nearly 55.0% market share from 2024. Indeed, their application in vaccine and drug delivery without using needles has increased their appeal, especially in pediatric and needle-phobic populations. A dosing mechanism with no discomfort has made spring-loaded injectors sought after in clinical practice.

The fastest-growing technology segment in the market is battery-powered jet injectors, which is expected to register a 14% CAGR. The increasing adoption trend of battery-powered devices is further fueled by the advancements in technology that are likely to make the devices more user-friendly, portable, and with injection time much faster. In both clinical and home care usage, their capability to administer various formulations with adaptations according to the changing needs of patients would make them very alluring.

By Delivery Site Subcutaneous Injectors dominated while Home Care Settings are expected to grow fastest

Subcutaneous injectors dominate the market due to their ease of use, minimal pain, and suitability for self-administration of drugs. They are widely preferred for chronic disease management, including insulin and biologics, enabling patients to administer medications at home safely. Their efficiency, patient compliance, and lower risk of complications make subcutaneous injectors the leading segment in needle-free delivery systems.

By Application Drug Delivery led while Powder Injections are projected to grow fastest

Drug delivery is the dominant application segment in the needle-free injectors market. These devices facilitate precise, painless administration of therapeutic drugs, particularly for chronic conditions like diabetes and autoimmune disorders. The growing demand for self-administered treatments, coupled with the safety and convenience of needle-free systems, drives the widespread adoption of these injectors in routine medical care.

By End User Home Care Settings dominated while Hospital and Clinical Settings are expected to grow fastest

Home care settings lead the market as patients increasingly prefer self-administration of medications for convenience and cost savings. Needle-free injectors allow safe, effective at-home treatments, reducing hospital visits and enhancing patient independence. This trend is supported by the rising prevalence of chronic diseases and the growing focus on patient-centered healthcare, making home care the dominant end-user segment.

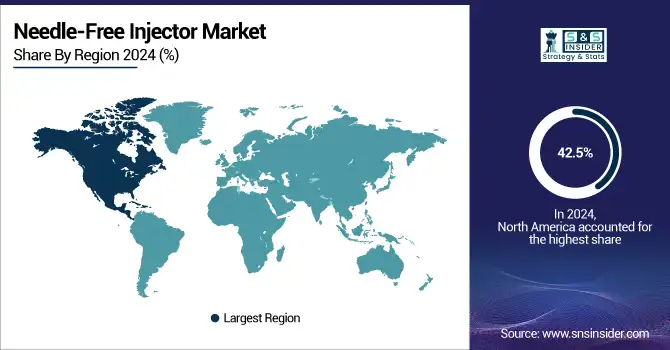
Needle-Free Injector Market Regional Analysis

North America Needle-Free Injector Market Insights

North America was the dominant region in 2023, comprising 42.5%, and is expected to rise in the forecast period mainly because of its important industry players operating from the United States, with the high prevalence of chronic and lifestyle diseases. In addition, the trend to self-administer drugs continues to gain more popularity among the U.S. and Canadian populations, which will also further accelerate regional growth.

Needle-Free-Injector-Market-By-Region

Do You Need any Customization Research on Needle-Free Injector Market - Enquire Now

Europe Needle-Free Injector Market Outlook

Europe is anticipated to acquire the second-largest revenue share, with high prospects for a massive compound annual growth rate (CAGR) in this specific segment over the forecasting years. The advancements in medical technology, surging acceptability of needle-free injectors, and high health expenditure levels in the region are some of the principal factors driving this sector.

Asia Pacific: Fastest Growing Needle-Free Injector Market

The Asia Pacific market is expected to hold the highest CAGR value of around 8.16%. Supportive government initiatives, such as encouraging the use of medical devices, growth in the geriatric population, and increasing healthcare expenditures, are factors that can be accredited to the growth in the market. The rise in elderly populations in Asian countries, who have a greater tendency to experience chronic diseases, will also greatly drive the demand for needle-free injectors in this region. Overall, the market for needle-free injectors is well placed to witness healthy growth in these major geographies due to changes in demographics, technological improvements' progress, and transformations in healthcare-based preferences.

Middle East & Africa and Latin America Needle-Free Injector Market Forecast

The Middle East & Africa and Latin America are emerging markets for needle-free injectors, driven by increasing awareness of safe injection practices and rising demand for self-administered therapies. Market growth is supported by improving healthcare infrastructure, government initiatives, and partnerships with global companies to enhance accessibility, making these regions attractive for expansion despite cost and regulatory challenges.

Needle-Free Injector Market Competitive Landscape:

PharmaJet Inc.

PharmaJet Inc. is a leading player in the needle-free injectors market, specializing in jet injection technology for drug and vaccine delivery. The company focuses on providing safe, painless, and efficient alternatives to traditional needle-based injections. PharmaJet’s devices support a wide range of applications, including immunizations and therapeutics, enhancing patient compliance and safety. Strategic collaborations and continuous innovation have strengthened its global presence and advanced needle-free delivery solutions in modern healthcare.

  • 2025: PharmaJet signed an MOU with Egypt’s UPA and EVA Pharma to integrate Tropis needle-free delivery into Egypt’s routine immunization. The partnership aims to cut costs by 38%, localize manufacturing, and improve access for immunization campaigns.

  • 2025: PharmaJet will present partner data at the World Vaccine Congress showing that needle-free delivery enhances immune response in DNA cancer vaccine trials, demonstrating potential tumor reduction in hard-to-treat populations.

  • 2025: PharmaJet partnered with Immuno Cure to use Tropis for administering an experimental HIV therapeutic DNA vaccine (ICVAX) in clinical trials, aiming to improve immunogenicity and enhance the patient experience.

Portal Instruments

Portal Instruments is an emerging player in the needle-free injectors market, focusing on innovative, user-friendly, and sustainable drug delivery solutions. The company specializes in electro-mechanical needle-free injectors that enable precise, painless administration of injectable therapies. By combining advanced technology with patient-centric design, Portal Instruments aims to improve treatment adherence, reduce medical waste, and expand the accessibility of needle-free delivery for a wide range of medications.

  • In 2025, Portal Instruments unveiled the PRIME Nexus reusable needle-free electro-mechanical injector, offering 1 mL and 2.25 mL capacity at the Pre-Filled Syringe Conference, positioning it as a sustainable solution for the growing injectable therapies market.

Crossject

Crossject is a key player in the needle-free injectors market, specializing in the development of Zeneo® auto-injectors that deliver reliable, precise, and painless drug administration. The company focuses on enhancing safety, patient compliance, and ease of use, particularly for emergency and self-administration scenarios. Crossject’s innovative technology ensures consistent delivery depth and minimizes risks associated with traditional needle injections, strengthening its position in global needle-free delivery solutions.

  • In 2025, Crossject’s Zeneo needle-free auto-injector consistently matched 30 mm intramuscular injection depth and exceeded standard needle lengths, reinforcing its reliability for emergency use without misuse or injury risks.

  • In 2024, Crossject and the U.S. Department of Defense renewed their research agreement (CRADA) to advance Zeneo®, developing and evaluating upgraded needle-free injectors for military personnel and first responders.

Key Players in the Needle-Free Injector Technology

  • PharmaJet Inc.

  • Crossject

  • Portal Instruments

  • NuGen Medical Devices

  • Antares Pharma, Inc.

  • PenJet Corporation

  • Medical International Technology Inc.

  • Ferring Pharmaceuticals

  • Pfizer Inc.

  • CSL Limited (Seqirus UK Limited)

  • IntegriMedical

  • ARS Pharma

  • Zogenix

  • QS Medical Technology Co., Ltd.

  • Halozyme, Inc.

  • Caretek Medical

  • Guangzhou Medsinglong Medical Equipment Company Ltd.

  • D'Antonio Consultants International, Inc.

  • AcuShot Needle Free

  • InjexUK

Needle-Free Injector Market Report Scope:

Report Attributes Details
Market Size in 2024 USD 17.48 Billion
Market Size by 2032 USD 43.54 Billion
CAGR CAGR of 12.08% From 2025 to 2032
Base Year 2024
Forecast Period 2025-2032
Historical Data 2021-2022
Report Scope & Coverage Market Size, Segments Analysis, Competitive  Landscape, Regional Analysis, DROC & SWOT Analysis, Forecast Outlook
Key Segments • By Load (Liquid Injections, Powder Injections, Projectile Injections)
• By Technology (Spring-loaded jet injectors, Battery-powered jet injectors, Gas-powered jet injectors)
• By Delivery Site (Intra-dermal injectors, Intramuscular injectors, Subcutaneous injectors)
• By Application (Drug Delivery, Vaccines, Cosmetic, Others)
• By End User (Home Care Settings, Long Term Care Centers)
Regional Analysis/Coverage North America (US, Canada, Mexico), Europe (Eastern Europe [Poland, Romania, Hungary, Turkey, Rest of Eastern Europe] Western Europe] Germany, France, UK, Italy, Spain, Netherlands, Switzerland, Austria, Rest of Western Europe]), Asia-Pacific (China, India, Japan, South Korea, Vietnam, Singapore, Australia, Rest of Asia-Pacific), Middle East & Africa (Middle East [UAE, Egypt, Saudi Arabia, Qatar, Rest of Middle East], Africa [Nigeria, South Africa, Rest of Africa], Latin America (Brazil, Argentina, Colombia, Rest of Latin America)
Company Profiles PharmaJet Inc., Crossject, Portal Instruments, NuGen Medical Devices, Antares Pharma, Inc., PenJet Corporation, Medical International Technology Inc., Ferring Pharmaceuticals, Pfizer Inc., CSL Limited (Seqirus UK Limited), IntegriMedical, ARS Pharma, Zogenix, QS Medical Technology Co., Ltd., Halozyme, Inc., Caretek Medical, Guangzhou Medsinglong Medical Equipment Company Ltd., D'Antonio Consultants International, Inc., AcuShot Needle Free, InjexUK

Table Of Contents

1. Introduction

1.1 Market Definition & Scope

 1.2 Research Assumptions & Abbreviations

 1.3 Research Methodology

2. Executive Summary

2.1 Market Snapshot

 2.2 Market Absolute $ Opportunity Assessment & Y-o-Y Analysis, 2021–2032

 2.3 Market Size & Forecast, By Segmentation, 2021–2032

  2.3.1 Market Size By Load

  2.3.2 Market Size By Application

  2.3.3 Market Size By Technology

  2.3.4 Market Size By Delivery Site

  2.3.5 Market Size By End User

 2.4 Market Share & Bps Analysis By Region, 2024

 2.5 Industry Growth Scenarios – Conservative, Likely & Optimistic

 2.6 Industry CxO’s Perspective

3. Market Overview

3.1 Market Dynamics

  3.1.1 Drivers

  3.1.2 Restraints

  3.1.3 Opportunities

  3.1.4 Key Market Trends

 3.2 Industry PESTLE Analysis

 3.3 Key Industry Forces (Porter’s) Impacting Market Growth

 3.4 Industry Supply Chain Analysis

  3.4.1 Raw Material Suppliers

  3.4.2 Manufacturers

  3.4.3 Distributors/Suppliers

  3.4.4 Customers/End-Users

 3.5 Industry Life Cycle Assessment

 3.6 Parent Market Overview

 3.7 Market Risk Assessment

4. Statistical Insights & Trends Reporting

4.1 Pricing & Cost Analysis

  4.1.1 Average Cost per Needle-Free Injector Device (Single-Use, Multi-Use, Electronic)

  4.1.2 Regional Pricing Variations

  4.1.3 Cost per Patient or Dose Administration

  4.1.4 Pricing Trends with Advanced Features

  4.1.5 Insurance Coverage and Out-of-Pocket Expense Analysis

4.2 Device Usage & Administration Metrics

  4.2.1 % Adoption in Hospitals, Clinics, and Home Care Settings

  4.2.2 Average Number of Injections per Device per Month

  4.2.3 Patient Demographics (Age, Gender, Chronic vs. Acute Disease)

  4.2.4 Compliance & Adherence Rate (%)

  4.2.5 Training Time Required for Patients and Healthcare Providers

4.3 Clinical & Performance Metrics

  4.3.1 Pain Reduction Scores Compared to Traditional Needles

  4.3.2 Accuracy & Dose Delivery Rate (%)

  4.3.3 Adverse Event Rate (%) (Skin Reactions, Bruising, Injection Failure)

  4.3.4 Patient Satisfaction & Quality-of-Life Scores

  4.3.5 Comparative Performance: Jet vs. Spring-Powered vs. Electronic Injectors

4.4 Technology & Innovation Metrics

  4.4.1 % Devices Integrated with Smart Monitoring & Connectivity Features

  4.4.2 Adoption Rate of Reusable vs. Disposable Injectors

  4.4.3 R&D Investment Trends in Drug Compatibility and Pain-Free Delivery

  4.4.4 Patent Filing Trends in Needle-Free Injection Technologies

  4.4.5 Innovation Adoption Rate in Emerging Markets

4.5 Regulatory & Compliance Metrics

  4.5.1 % Devices Approved by FDA, EMA, and Other Authorities

  4.5.2 Time to Regulatory Approval by Region

  4.5.3 Compliance with Medical Device Safety & Quality Standards (%)

  4.5.4 Post-Market Surveillance and Adverse Event Reporting

  4.5.5 Guidelines for Sterility, Dose Accuracy, and Patient Safety

5. Needle-Free Injector Market Segmental Analysis & Forecast, By Load, 2021 – 2032, Value (USD Billion)

5.1 Introduction

 5.2 Liquid Injections

  5.2.1 Key Trends

  5.2.2 Market Size & Forecast, 2021 – 2032

 5.3 Powder Injections

  5.3.1 Key Trends

  5.3.2 Market Size & Forecast, 2021 – 2032

 5.4 Projectile Injections

  5.4.1 Key Trends

  5.4.2 Market Size & Forecast, 2021 – 2032

6. Needle-Free Injector Market Segmental Analysis & Forecast, By Application, 2021 – 2032, Value (USD Billion)

    6.1 Introduction

 6.2 Drug Delivery

  6.2.1 Key Trends

  6.2.2 Market Size & Forecast, 2021 – 2032

 6.3 Vaccines

  6.3.1 Key Trends

  6.3.2 Market Size & Forecast, 2021 – 2032

 6.4 Cosmetic

  6.4.1 Key Trends

  6.4.2 Market Size & Forecast, 2021 – 2032

 6.5 Others

  6.5.1 Key Trends

  6.5.2 Market Size & Forecast, 2021 – 2032

7. Needle-Free Injector Market Segmental Analysis & Forecast, By Technology, 2021 – 2032, Value (USD Billion)

    7.1 Introduction

 7.2 Spring-loaded jet injectors

  7.2.1 Key Trends

  7.2.2 Market Size & Forecast, 2021 – 2032

 7.3 Battery-powered jet injectors

  7.3.1 Key Trends

  7.3.2 Market Size & Forecast, 2021 – 2032

 7.4 Gas-powered jet injectors

  7.4.1 Key Trends

  7.4.2 Market Size & Forecast, 2021 – 2032

8. Needle-Free Injector Market Segmental Analysis & Forecast, By End User, 2021 – 2032, Value (USD Billion)

    8.1 Introduction

 8.2 Home Care Settings

  8.2.1 Key Trends

  8.2.2 Market Size & Forecast, 2021 – 2032

 8.3 Long Term Care Centers

  8.3.1 Key Trends

  8.3.2 Market Size & Forecast, 2021 – 2032

9. Needle-Free Injector Market Segmental Analysis & Forecast, By Deployment, 2021 – 2032, Value (USD Billion)

    9.1 Introduction 

  9.2 Intra-dermal injectors

   9.2.1 Key Trends 

   9.2.2 Market Size & Forecast, 2021 – 2032 

  9.3 Intramuscular injectors

   9.3.1 Key Trends 

   9.3.2 Market Size & Forecast, 2021 – 2032 

  9.4 Subcutaneous injectors

   9.4.1 Key Trends 

   9.4.2 Market Size & Forecast, 2021 – 2032 

10. Needle-Free Injector Market Segmental Analysis & Forecast By Region, 2021 – 2032, Value (USD Billion)

 10.1 Introduction

 10.2 North America

  10.2.1 Key Trends

  10.2.2 Needle-Free Injector Market Size & Forecast, By Load, 2021 – 2032

  10.2.3 Needle-Free Injector Market Size & Forecast, By Application, 2021 – 2032

  10.2.4 Needle-Free Injector Market Size & Forecast, By Technology, 2021 – 2032

  10.2.5 Needle-Free Injector Market Size & Forecast, By End User, 2021 – 2032

  10.2.6 Needle-Free Injector Market Size & Forecast, By Deployment, 2021 – 2032

  10.2.7 Needle-Free Injector Market Size & Forecast, By Country, 2021 – 2032

   10.2.7.1 USA

    10.2.7.1.1 Needle-Free Injector Market Size & Forecast, By Load, 2021 – 2032

    10.2.7.1.2 Needle-Free Injector Market Size & Forecast, By Application, 2021 – 2032

    10.2.7.1.3 Needle-Free Injector Market Size & Forecast, By Technology, 2021 – 2032

    10.2.7.1.4 Needle-Free Injector Market Size & Forecast, By End User, 2021 – 2032

    10.2.7.1.5 Needle-Free Injector Market Size & Forecast, By Deployment, 2021 – 2032

   10.2.7.2 Canada

    10.2.7.2.1 Needle-Free Injector Market Size & Forecast, By Load, 2021 – 2032

    10.2.7.2.2 Needle-Free Injector Market Size & Forecast, By Application, 2021 – 2032

    10.2.7.2.3 Needle-Free Injector Market Size & Forecast, By Technology, 2021 – 2032

    10.2.7.2.4 Needle-Free Injector Market Size & Forecast, By End User, 2021 – 2032

    10.2.7.2.5 Needle-Free Injector Market Size & Forecast, By Deployment, 2021 – 2032

10.3 Europe

 10.3.1 Key Trends

 10.3.2 Needle-Free Injector Market Size & Forecast, By Load, 2021 – 2032

 10.3.3 Needle-Free Injector Market Size & Forecast, By Application, 2021 – 2032

 10.3.4 Needle-Free Injector Market Size & Forecast, By Technology, 2021 – 2032

 10.3.5 Needle-Free Injector Market Size & Forecast, By End User, 2021 – 2032

 10.3.6 Needle-Free Injector Market Size & Forecast, By Deployment, 2021 – 2032

 10.3.7 Needle-Free Injector Market Size & Forecast, By Country, 2021 – 2032

  10.3.7.1 Germany

   10.3.7.1.1 Needle-Free Injector Market Size & Forecast, By Load, 2021 – 2032

   10.3.7.1.2 Needle-Free Injector Market Size & Forecast, By Application, 2021 – 2032

   10.3.7.1.3 Needle-Free Injector Market Size & Forecast, By Technology, 2021 – 2032

   10.3.7.1.4 Needle-Free Injector Market Size & Forecast, By End User, 2021 – 2032

   10.3.7.1.5 Needle-Free Injector Market Size & Forecast, By Deployment, 2021 – 2032

  10.3.7.2 UK

   10.3.7.2.1 Needle-Free Injector Market Size & Forecast, By Load, 2021 – 2032

   10.3.7.2.2 Needle-Free Injector Market Size & Forecast, By Application, 2021 – 2032

   10.3.7.2.3 Needle-Free Injector Market Size & Forecast, By Technology, 2021 – 2032

   10.3.7.2.4 Needle-Free Injector Market Size & Forecast, By End User, 2021 – 2032

   10.3.7.2.5 Needle-Free Injector Market Size & Forecast, By Deployment, 2021 – 2032

  10.3.7.3 France

   10.3.7.3.1 Needle-Free Injector Market Size & Forecast, By Load, 2021 – 2032

   10.3.7.3.2 Needle-Free Injector Market Size & Forecast, By Application, 2021 – 2032

   10.3.7.3.3 Needle-Free Injector Market Size & Forecast, By Technology, 2021 – 2032

   10.3.7.3.4 Needle-Free Injector Market Size & Forecast, By End User, 2021 – 2032

   10.3.7.3.5 Needle-Free Injector Market Size & Forecast, By Deployment, 2021 – 2032

  10.3.7.4 Italy

   10.3.7.4.1 Needle-Free Injector Market Size & Forecast, By Load, 2021 – 2032

   10.3.7.4.2 Needle-Free Injector Market Size & Forecast, By Application, 2021 – 2032

   10.3.7.4.3 Needle-Free Injector Market Size & Forecast, By Technology, 2021 – 2032

   10.3.7.4.4 Needle-Free Injector Market Size & Forecast, By End User, 2021 – 2032

   10.3.7.4.5 Needle-Free Injector Market Size & Forecast, By Deployment, 2021 – 2032

  10.3.7.5 Spain

   10.3.7.5.1 Needle-Free Injector Market Size & Forecast, By Load, 2021 – 2032

   10.3.7.5.2 Needle-Free Injector Market Size & Forecast, By Application, 2021 – 2032

   10.3.7.5.3 Needle-Free Injector Market Size & Forecast, By Technology, 2021 – 2032

   10.3.7.5.4 Needle-Free Injector Market Size & Forecast, By End User, 2021 – 2032

   10.3.7.5.5 Needle-Free Injector Market Size & Forecast, By Deployment, 2021 – 2032

  10.3.7.6 Russia

   10.3.7.6.1 Needle-Free Injector Market Size & Forecast, By Load, 2021 – 2032

   10.3.7.6.2 Needle-Free Injector Market Size & Forecast, By Application, 2021 – 2032

   10.3.7.6.3 Needle-Free Injector Market Size & Forecast, By Technology, 2021 – 2032

   10.3.7.6.4 Needle-Free Injector Market Size & Forecast, By End User, 2021 – 2032

   10.3.7.6.5 Needle-Free Injector Market Size & Forecast, By Deployment, 2021 – 2032

  10.3.7.7 Poland

   10.3.7.7.1 Needle-Free Injector Market Size & Forecast, By Load, 2021 – 2032

   10.3.7.7.2 Needle-Free Injector Market Size & Forecast, By Application, 2021 – 2032

   10.3.7.7.3 Needle-Free Injector Market Size & Forecast, By Technology, 2021 – 2032

   10.3.7.7.4 Needle-Free Injector Market Size & Forecast, By End User, 2021 – 2032

   10.3.7.7.5 Needle-Free Injector Market Size & Forecast, By Deployment, 2021 – 2032

  10.3.7.8 Rest of Europe

   10.3.7.8.1 Needle-Free Injector Market Size & Forecast, By Load, 2021 – 2032

   10.3.7.8.2 Needle-Free Injector Market Size & Forecast, By Application, 2021 – 2032

   10.3.7.8.3 Needle-Free Injector Market Size & Forecast, By Technology, 2021 – 2032

   10.3.7.8.4 Needle-Free Injector Market Size & Forecast, By End User, 2021 – 2032

   10.3.7.8.5 Needle-Free Injector Market Size & Forecast, By Deployment, 2021 – 2032

10.4 Asia-Pacific

 10.4.1 Key Trends

 10.4.2 Needle-Free Injector Market Size & Forecast, By Load, 2021 – 2032

 10.4.3 Needle-Free Injector Market Size & Forecast, By Application, 2021 – 2032

 10.4.4 Needle-Free Injector Market Size & Forecast, By Technology, 2021 – 2032

 10.4.5 Needle-Free Injector Market Size & Forecast, By End User, 2021 – 2032

 10.4.6 Needle-Free Injector Market Size & Forecast, By Deployment, 2021 – 2032

 10.4.7 Needle-Free Injector Market Size & Forecast, By Country, 2021 – 2032

  10.4.7.1 China

   10.4.7.1.1 Needle-Free Injector Market Size & Forecast, By Load, 2021 – 2032

   10.4.7.1.2 Needle-Free Injector Market Size & Forecast, By Application, 2021 – 2032

   10.4.7.1.3 Needle-Free Injector Market Size & Forecast, By Technology, 2021 – 2032

   10.4.7.1.4 Needle-Free Injector Market Size & Forecast, By End User, 2021 – 2032

   10.4.7.1.5 Needle-Free Injector Market Size & Forecast, By Deployment, 2021 – 2032

  10.4.7.2 India

   10.4.7.2.1 Needle-Free Injector Market Size & Forecast, By Load, 2021 – 2032

   10.4.7.2.2 Needle-Free Injector Market Size & Forecast, By Application, 2021 – 2032

   10.4.7.2.3 Needle-Free Injector Market Size & Forecast, By Technology, 2021 – 2032

   10.4.7.2.4 Needle-Free Injector Market Size & Forecast, By End User, 2021 – 2032

   10.4.7.2.5 Needle-Free Injector Market Size & Forecast, By Deployment, 2021 – 2032

  10.4.7.3 Japan

   10.4.7.3.1 Needle-Free Injector Market Size & Forecast, By Load, 2021 – 2032

   10.4.7.3.2 Needle-Free Injector Market Size & Forecast, By Application, 2021 – 2032

   10.4.7.3.3 Needle-Free Injector Market Size & Forecast, By Technology, 2021 – 2032

   10.4.7.3.4 Needle-Free Injector Market Size & Forecast, By End User, 2021 – 2032

   10.4.7.3.5 Needle-Free Injector Market Size & Forecast, By Deployment, 2021 – 2032

  10.4.7.4 South Korea

   10.4.7.4.1 Needle-Free Injector Market Size & Forecast, By Load, 2021 – 2032

   10.4.7.4.2 Needle-Free Injector Market Size & Forecast, By Application, 2021 – 2032

   10.4.7.4.3 Needle-Free Injector Market Size & Forecast, By Technology, 2021 – 2032

   10.4.7.4.4 Needle-Free Injector Market Size & Forecast, By End User, 2021 – 2032

   10.4.7.4.5 Needle-Free Injector Market Size & Forecast, By Deployment, 2021 – 2032

  10.4.7.5 Australia

   10.4.7.5.1 Needle-Free Injector Market Size & Forecast, By Load, 2021 – 2032

   10.4.7.5.2 Needle-Free Injector Market Size & Forecast, By Application, 2021 – 2032

   10.4.7.5.3 Needle-Free Injector Market Size & Forecast, By Technology, 2021 – 2032

   10.4.7.5.4 Needle-Free Injector Market Size & Forecast, By End User, 2021 – 2032

   10.4.7.5.5 Needle-Free Injector Market Size & Forecast, By Deployment, 2021 – 2032

  10.4.7.6 ASEAN Countries

   10.4.7.6.1 Needle-Free Injector Market Size & Forecast, By Load, 2021 – 2032

   10.4.7.6.2 Needle-Free Injector Market Size & Forecast, By Application, 2021 – 2032

   10.4.7.6.3 Needle-Free Injector Market Size & Forecast, By Technology, 2021 – 2032

   10.4.7.6.4 Needle-Free Injector Market Size & Forecast, By End User, 2021 – 2032

   10.4.7.6.5 Needle-Free Injector Market Size & Forecast, By Deployment, 2021 – 2032

  10.4.7.7 Rest of Asia-Pacific

   10.4.7.7.1 Needle-Free Injector Market Size & Forecast, By Load, 2021 – 2032

   10.4.7.7.2 Needle-Free Injector Market Size & Forecast, By Application, 2021 – 2032

   10.4.7.7.3 Needle-Free Injector Market Size & Forecast, By Technology, 2021 – 2032

   10.4.7.7.4 Needle-Free Injector Market Size & Forecast, By End User, 2021 – 2032

   10.4.7.7.5 Needle-Free Injector Market Size & Forecast, By Deployment, 2021 – 2032

10.5 Latin America

 10.5.1 Key Trends

 10.5.2 Needle-Free Injector Market Size & Forecast, By Load, 2021 – 2032

 10.5.3 Needle-Free Injector Market Size & Forecast, By Application, 2021 – 2032

 10.5.4 Needle-Free Injector Market Size & Forecast, By Technology, 2021 – 2032

 10.5.5 Needle-Free Injector Market Size & Forecast, By End User, 2021 – 2032

 10.5.6 Needle-Free Injector Market Size & Forecast, By Deployment, 2021 – 2032

 10.5.7 Needle-Free Injector Market Size & Forecast, By Country, 2021 – 2032

  10.5.7.1 Brazil

   10.5.7.1.1 Needle-Free Injector Market Size & Forecast, By Load, 2021 – 2032

   10.5.7.1.2 Needle-Free Injector Market Size & Forecast, By Application, 2021 – 2032

   10.5.7.1.3 Needle-Free Injector Market Size & Forecast, By Technology, 2021 – 2032

   10.5.7.1.4 Needle-Free Injector Market Size & Forecast, By End User, 2021 – 2032

   10.5.7.1.5 Needle-Free Injector Market Size & Forecast, By Deployment, 2021 – 2032

  10.5.7.2 Argentina

   10.5.7.2.1 Needle-Free Injector Market Size & Forecast, By Load, 2021 – 2032

   10.5.7.2.2 Needle-Free Injector Market Size & Forecast, By Application, 2021 – 2032

   10.5.7.2.3 Needle-Free Injector Market Size & Forecast, By Technology, 2021 – 2032

   10.5.7.2.4 Needle-Free Injector Market Size & Forecast, By End User, 2021 – 2032

   10.5.7.2.5 Needle-Free Injector Market Size & Forecast, By Deployment, 2021 – 2032

  10.5.7.3 Mexico

   10.5.7.3.1 Needle-Free Injector Market Size & Forecast, By Load, 2021 – 2032

   10.5.7.3.2 Needle-Free Injector Market Size & Forecast, By Application, 2021 – 2032

   10.5.7.3.3 Needle-Free Injector Market Size & Forecast, By Technology, 2021 – 2032

   10.5.7.3.4 Needle-Free Injector Market Size & Forecast, By End User, 2021 – 2032

   10.5.7.3.5 Needle-Free Injector Market Size & Forecast, By Deployment, 2021 – 2032

  10.5.7.4 Colombia

   10.5.7.4.1 Needle-Free Injector Market Size & Forecast, By Load, 2021 – 2032

   10.5.7.4.2 Needle-Free Injector Market Size & Forecast, By Application, 2021 – 2032

   10.5.7.4.3 Needle-Free Injector Market Size & Forecast, By Technology, 2021 – 2032

   10.5.7.4.4 Needle-Free Injector Market Size & Forecast, By End User, 2021 – 2032

   10.5.7.4.5 Needle-Free Injector Market Size & Forecast, By Deployment, 2021 – 2032

  10.5.7.5 Rest of Latin America

   10.5.7.5.1 Needle-Free Injector Market Size & Forecast, By Load, 2021 – 2032

   10.5.7.5.2 Needle-Free Injector Market Size & Forecast, By Application, 2021 – 2032

   10.5.7.5.3 Needle-Free Injector Market Size & Forecast, By Technology, 2021 – 2032

   10.5.7.5.4 Needle-Free Injector Market Size & Forecast, By End User, 2021 – 2032

   10.5.7.5.5 Needle-Free Injector Market Size & Forecast, By Deployment, 2021 – 2032

10.6 Middle East & Africa

 10.6.1 Key Trends

 10.6.2 Needle-Free Injector Market Size & Forecast, By Load, 2021 – 2032

 10.6.3 Needle-Free Injector Market Size & Forecast, By Application, 2021 – 2032

 10.6.4 Needle-Free Injector Market Size & Forecast, By Technology, 2021 – 2032

 10.6.5 Needle-Free Injector Market Size & Forecast, By End User, 2021 – 2032

 10.6.6 Needle-Free Injector Market Size & Forecast, By Deployment, 2021 – 2032

 10.6.7 Needle-Free Injector Market Size & Forecast, By Country, 2021 – 2032

  10.6.7.1 UAE

   10.6.7.1.1 Needle-Free Injector Market Size & Forecast, By Load, 2021 – 2032

   10.6.7.1.2 Needle-Free Injector Market Size & Forecast, By Application, 2021 – 2032

   10.6.7.1.3 Needle-Free Injector Market Size & Forecast, By Technology, 2021 – 2032

   10.6.7.1.4 Needle-Free Injector Market Size & Forecast, By End User, 2021 – 2032

   10.6.7.1.5 Needle-Free Injector Market Size & Forecast, By Deployment, 2021 – 2032

  10.6.7.2 Saudi Arabia

   10.6.7.2.1 Needle-Free Injector Market Size & Forecast, By Load, 2021 – 2032

   10.6.7.2.2 Needle-Free Injector Market Size & Forecast, By Application, 2021 – 2032

   10.6.7.2.3 Needle-Free Injector Market Size & Forecast, By Technology, 2021 – 2032

   10.6.7.2.4 Needle-Free Injector Market Size & Forecast, By End User, 2021 – 2032

   10.6.7.2.5 Needle-Free Injector Market Size & Forecast, By Deployment, 2021 – 2032

  10.6.7.3 Qatar

   10.6.7.3.1 Needle-Free Injector Market Size & Forecast, By Load, 2021 – 2032

   10.6.7.3.2 Needle-Free Injector Market Size & Forecast, By Application, 2021 – 2032

   10.6.7.3.3 Needle-Free Injector Market Size & Forecast, By Technology, 2021 – 2032

   10.6.7.3.4 Needle-Free Injector Market Size & Forecast, By End User, 2021 – 2032

   10.6.7.3.5 Needle-Free Injector Market Size & Forecast, By Deployment, 2021 – 2032

  10.6.7.4 Egypt

   10.6.7.4.1 Needle-Free Injector Market Size & Forecast, By Load, 2021 – 2032

   10.6.7.4.2 Needle-Free Injector Market Size & Forecast, By Application, 2021 – 2032

   10.6.7.4.3 Needle-Free Injector Market Size & Forecast, By Technology, 2021 – 2032

   10.6.7.4.4 Needle-Free Injector Market Size & Forecast, By End User, 2021 – 2032

   10.6.7.4.5 Needle-Free Injector Market Size & Forecast, By Deployment, 2021 – 2032

  10.6.7.5 South Africa

   10.6.7.5.1 Needle-Free Injector Market Size & Forecast, By Load, 2021 – 2032

   10.6.7.5.2 Needle-Free Injector Market Size & Forecast, By Application, 2021 – 2032

   10.6.7.5.3 Needle-Free Injector Market Size & Forecast, By Technology, 2021 – 2032

   10.6.7.5.4 Needle-Free Injector Market Size & Forecast, By End User, 2021 – 2032

   10.6.7.5.5 Needle-Free Injector Market Size & Forecast, By Deployment, 2021 – 2032

  10.6.7.6 Rest of Middle East & Africa

   10.6.7.6.1 Needle-Free Injector Market Size & Forecast, By Load, 2021 – 2032

   10.6.7.6.2 Needle-Free Injector Market Size & Forecast, By Application, 2021 – 2032

   10.6.7.6.3 Needle-Free Injector Market Size & Forecast, By Technology, 2021 – 2032

   10.6.7.6.4 Needle-Free Injector Market Size & Forecast, By End User, 2021 – 2032

   10.6.7.6.5 Needle-Free Injector Market Size & Forecast, By Deployment, 2021 – 2032

11. Competitive Landscape

 11.1 Key Players' Positioning

 11.2 Competitive Developments

  11.2.1 Key Strategies Adopted (%), By Key Players, 2024

  11.2.2 Year-Wise Strategies & Development, 2021 – 2025

  11.2.3 Number Of Strategies Adopted By Key Players, 2024

 11.3 Market Share Analysis, 2024

 11.4 Product/Service & Application Benchmarking

  11.4.1 Product/Service Specifications & Features By Key Players

  11.4.2 Product/Service Heatmap By Key Players

  11.4.3 Application Heatmap By Key Players

 11.5 Industry Start-Up & Innovation Landscape

11.6 Key Company Profiles

11.6.1 PharmaJet Inc.

  11.6.1.1 Company Overview & Snapshot

  11.6.1.2 Product/Service Portfolio

  11.6.1.3 Key Company Financials

  11.6.1.4 SWOT Analysis

 11.6.2 Crossject

  11.6.2.1 Company Overview & Snapshot

  11.6.2.2 Product/Service Portfolio

  11.6.2.3 Key Company Financials

  11.6.2.4 SWOT Analysis

 11.6.3 Portal Instruments

  11.6.3.1 Company Overview & Snapshot

  11.6.3.2 Product/Service Portfolio

  11.6.3.3 Key Company Financials

  11.6.3.4 SWOT Analysis

 11.6.4 NuGen Medical Devices

  11.6.4.1 Company Overview & Snapshot

  11.6.4.2 Product/Service Portfolio

  11.6.4.3 Key Company Financials

  11.6.4.4 SWOT Analysis

 11.6.5 Antares Pharma, Inc.

  11.6.5.1 Company Overview & Snapshot

  11.6.5.2 Product/Service Portfolio

  11.6.5.3 Key Company Financials

  11.6.5.4 SWOT Analysis

 11.6.6 PenJet Corporation

  11.6.6.1 Company Overview & Snapshot

  11.6.6.2 Product/Service Portfolio

  11.6.6.3 Key Company Financials

  11.6.6.4 SWOT Analysis

 11.6.7 Medical International Technology Inc.

  11.6.7.1 Company Overview & Snapshot

  11.6.7.2 Product/Service Portfolio

  11.6.7.3 Key Company Financials

  11.6.7.4 SWOT Analysis

 11.6.8 Ferring Pharmaceuticals

  11.6.8.1 Company Overview & Snapshot

  11.6.8.2 Product/Service Portfolio

  11.6.8.3 Key Company Financials

  11.6.8.4 SWOT Analysis

 11.6.9 Pfizer Inc.

  11.6.9.1 Company Overview & Snapshot

  11.6.9.2 Product/Service Portfolio

  11.6.9.3 Key Company Financials

  11.6.9.4 SWOT Analysis

11.6.10 CSL Limited (Seqirus UK Limited)

  11.6.10.1 Company Overview & Snapshot

  11.6.10.2 Product/Service Portfolio

  11.6.10.3 Key Company Financials

  11.6.10.4 SWOT Analysis

 11.6.11 IntegriMedical

  11.6.11.1 Company Overview & Snapshot

  11.6.11.2 Product/Service Portfolio

  11.6.11.3 Key Company Financials

  11.6.11.4 SWOT Analysis

 11.6.12 ARS Pharma

  11.6.12.1 Company Overview & Snapshot

  11.6.12.2 Product/Service Portfolio

  11.6.12.3 Key Company Financials

  11.6.12.4 SWOT Analysis

 11.6.13 Zogenix

  11.6.13.1 Company Overview & Snapshot

  11.6.13.2 Product/Service Portfolio

  11.6.13.3 Key Company Financials

  11.6.13.4 SWOT Analysis

 11.6.14 QS Medical Technology Co., Ltd.

  11.6.14.1 Company Overview & Snapshot

  11.6.14.2 Product/Service Portfolio

  11.6.14.3 Key Company Financials

  11.6.14.4 SWOT Analysis

 11.6.15 Halozyme, Inc.

  11.6.15.1 Company Overview & Snapshot

  11.6.15.2 Product/Service Portfolio

  11.6.15.3 Key Company Financials

  11.6.15.4 SWOT Analysis

 11.6.16 Caretek Medical

  11.6.16.1 Company Overview & Snapshot

  11.6.16.2 Product/Service Portfolio

  11.6.16.3 Key Company Financials

  11.6.16.4 SWOT Analysis

 11.6.17 Guangzhou Medsinglong Medical Equipment Company Ltd.

  11.6.17.1 Company Overview & Snapshot

  11.6.17.2 Product/Service Portfolio

  11.6.17.3 Key Company Financials

  11.6.17.4 SWOT Analysis

 11.6.18 D'Antonio Consultants International, Inc.

  11.6.18.1 Company Overview & Snapshot

  11.6.18.2 Product/Service Portfolio

  11.6.18.3 Key Company Financials

  11.6.18.4 SWOT Analysis

 11.6.19 AcuShot Needle Free

  11.6.19.1 Company Overview & Snapshot

  11.6.19.2 Product/Service Portfolio

  11.6.19.3 Key Company Financials

  11.6.19.4 SWOT Analysis

 11.6.20 InjexUK

  11.6.20.1 Company Overview & Snapshot

  11.6.20.2 Product/Service Portfolio

  11.6.20.3 Key Company Financials

  11.6.20.4 SWOT Analysis

12. Analyst Recommendations

 12.1 SNS Insider Opportunity Map

 12.2 Industry Low-Hanging Fruit Assessment

 12.3 Market Entry & Growth Strategy

 12.4 Analyst Viewpoint & Suggestions On Market Growth

13. Assumptions

14. Disclaimer

15. Appendix

 15.1 List Of Tables

 15.2 List Of Figures

Key Market Segments

By Load

  • Liquid Injections

  • Powder Injections

  • Projectile Injections

By Technology

  • Spring-loaded jet injectors

  • Battery-powered jet injectors

  • Gas-powered jet injectors

By Delivery Site

  • Intra-dermal injectors

  • Intramuscular injectors

  • Subcutaneous injectors

By Application

  • Drug Delivery

  • Vaccines

  • Cosmetic

  • Others

By End User

  • Home Care Settings

  • Long Term Care Centers

Request for Segment Customization as per your Business Requirement: Segment Customization Request

Regional Coverage:

North America

  • US

  • Canada

  • Mexico

Europe

  • Eastern Europe

    • Poland

    • Romania

    • Hungary

    • Turkey

    • Rest of Eastern Europe

  • Western Europe

    • Germany

    • France

    • UK

    • Italy

    • Spain

    • Netherlands

    • Switzerland

    • Austria

    • Rest of Western Europe

Asia Pacific

  • China

  • India

  • Japan

  • South Korea

  • Vietnam

  • Singapore

  • Australia

  • Rest of Asia Pacific

Middle East & Africa

Middle East

  • UAE

  • Egypt

  • Saudi Arabia

  • Qatar

  • Rest of the Middle East

Africa

  • Nigeria

  • South Africa

  • Rest of Africa

Latin America

  • Brazil

  • Argentina

  • Colombia

  • Rest of Latin America

Request for Country Level Research Report: Country Level Customization Request

Available Customization

With the given market data, SNS Insider offers customization as per the company’s specific needs. The following customization options are available for the report:

  • Product Analysis

  • Criss-Cross segment analysis (e.g. Product X Application)

  • Product Matrix which gives a detailed comparison of the product portfolio of each company

  • Geographic Analysis

  • Additional countries in any of the regions

  • Company Information

  • Detailed analysis and profiling of additional market players (Up to five)

An accurate research report requires proper strategizing as well as implementation. There are multiple factors involved in the completion of good and accurate research report and selecting the best methodology to compete the research is the toughest part. Since the research reports we provide play a crucial role in any company’s decision-making process, therefore we at SNS Insider always believe that we should choose the best method which gives us results closer to reality. This allows us to reach at a stage wherein we can provide our clients best and accurate investment to output ratio.

Each report that we prepare takes a timeframe of 350-400 business hours for production. Starting from the selection of titles through a couple of in-depth brain storming session to the final QC process before uploading our titles on our website we dedicate around 350 working hours. The titles are selected based on their current market cap and the foreseen CAGR and growth.


The 5 steps process:

Step 1: Secondary Research:

Secondary Research or Desk Research is as the name suggests is a research process wherein, we collect data through the readily available information. In this process we use various paid and unpaid databases which our team has access to and gather data through the same. This includes examining of listed companies’ annual reports, Journals, SEC filling etc. Apart from this our team has access to various associations across the globe across different industries. Lastly, we have exchange relationships with various university as well as individual libraries.

Secondary Research

Step 2: Primary Research

When we talk about primary research, it is a type of study in which the researchers collect relevant data samples directly, rather than relying on previously collected data.  This type of research is focused on gaining content specific facts that can be sued to solve specific problems. Since the collected data is fresh and first hand therefore it makes the study more accurate and genuine.

We at SNS Insider have divided Primary Research into 2 parts.

Part 1 wherein we interview the KOLs of major players as well as the upcoming ones across various geographic regions. This allows us to have their view over the market scenario and acts as an important tool to come closer to the accurate market numbers. As many as 45 paid and unpaid primary interviews are taken from both the demand and supply side of the industry to make sure we land at an accurate judgement and analysis of the market.

This step involves the triangulation of data wherein our team analyses the interview transcripts, online survey responses and observation of on filed participants. The below mentioned chart should give a better understanding of the part 1 of the primary interview.

Primary Research

Part 2: In this part of primary research the data collected via secondary research and the part 1 of the primary research is validated with the interviews from individual consultants and subject matter experts.

Consultants are those set of people who have at least 12 years of experience and expertise within the industry whereas Subject Matter Experts are those with at least 15 years of experience behind their back within the same space. The data with the help of two main processes i.e., FGDs (Focused Group Discussions) and IDs (Individual Discussions). This gives us a 3rd party nonbiased primary view of the market scenario making it a more dependable one while collation of the data pointers.

Step 3: Data Bank Validation

Once all the information is collected via primary and secondary sources, we run that information for data validation. At our intelligence centre our research heads track a lot of information related to the market which includes the quarterly reports, the daily stock prices, and other relevant information. Our data bank server gets updated every fortnight and that is how the information which we collected using our primary and secondary information is revalidated in real time.

Data Bank Validation

Step 4: QA/QC Process

After all the data collection and validation our team does a final level of quality check and quality assurance to get rid of any unwanted or undesired mistakes. This might include but not limited to getting rid of the any typos, duplication of numbers or missing of any important information. The people involved in this process include technical content writers, research heads and graphics people. Once this process is completed the title gets uploader on our platform for our clients to read it.

Step 5: Final QC/QA Process:

This is the last process and comes when the client has ordered the study. In this process a final QA/QC is done before the study is emailed to the client. Since we believe in giving our clients a good experience of our research studies, therefore, to make sure that we do not lack at our end in any way humanly possible we do a final round of quality check and then dispatch the study to the client.