Non-Alcoholic RTD Beverages Market Report Scope & Overview:
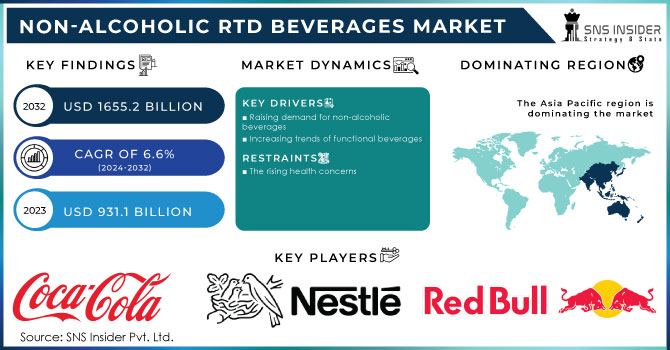
The Non-Alcoholic RTD Beverages Market size was USD 931.1 billion in 2023 and is expected to Reach USD 1655.2 billion by 2032 and grow at a CAGR of 6.6 % over the forecast period of 2024-2032.
Get More Information on Non-Alcoholic RTD Beverages Market - Request Sample Report
Non-alcoholic ready-to-drink (RTD) beverages are alcohol-free beverages. Water, sugar, flavorings, and other components are commonly used to make them. Tea, coffee, juice, soda, and sports drinks are among the non-alcoholic RTD beverages available.
Based on type they are segmented as Fermented and Non-Fermented Beverages. The non-fermented beverages segment holds the dominant share of the market. Consumers' increased health consciousness, as they seek healthier beverage options. An increased need for convenience, as people seek RTD beverages that are easier to consume. The growing popularity of functional beverages, which provide health benefits other than hydration. The advent of novel non-fermented beverages like kombucha and functional water.
Based on the Distribution Channel the market is categorized as Supermarkets/Hypermarkets, Convenience Stores, Online Stores, and other channels. supermarkets/Hypermarkets dominate the market due to easy availability and convenience options for consumers. Such channels adopt several strategies, such as capitalization and investments, to increase buyer's comfort by offering them an easy shopping experience.
The online distribution channel and convenience stores segment is expected to high CAGR in the forecasting period. New platforms such as Walmart, Amazon, and other e-commerce platforms drive the demand due to convenience in shopping methods.
MARKET DYNAMICS
KEY DRIVERS
-
Raising demand for non-alcoholic beverages
-
Increasing trends of functional beverages
Consumers currently seek foods with extra nutrients that are also nutritious. Consumer preferences are shifting toward healthier beverages and proper nutritional consumption, such as water with added minerals and vitamins. According to the International Food Information Council, 62% of Americans reported getting food and nutrition information from social media in 2023, up from 55% in 2022. Furthermore, beverage manufacturers have been releasing new and innovative types of functional bottled waters, which have fueled the expansion of the non-alcoholic RTD beverages industry.
RESTRAIN
-
The rising health concerns
Consumers are increasingly asking for lower-sugar, lower-calorie, and artificial-ingredient-free beverages. Non-alcoholic RTD beverages are frequently heavy in sugar and calories, which can lead to weight gain. The International Food Information Council claims in 2023, 87% of Americans reported that health concerns influenced their eating choices, up from 80% in 2022. Artificial additives are frequently employed to improve the taste, color, and shelf life of non-alcoholic RTD beverages. Some artificial additives, however, have been linked to health issues such as cancer and allergies.
OPPORTUNITY
-
Consumer inclination toward an active lifestyle
Adopting an active lifestyle continues to become more popular among customers. Obesity, diabetes, and cardiovascular disease are all on the rise as a result of unhealthy food and beverages. Natural and organic beverages have gained in popularity due to constituents such as bacteria, minerals, amino acids, and vitamins, as well as the absence of artificial sweeteners. Furthermore, demand for organic products has increased since it reduces the use of artificial substances such as artificial sweeteners, chemicals, and others.
CHALLENGES
-
Stringent regulations
Some countries may have restrictions on the sale or import of these beverages due to stringent rules. These may also result in a bad public perception of non-alcoholic RTD beverages. This is because rigorous regulations may induce customers to regard certain beverages as harmful or unsafe. The use of certain additives in non-alcoholic RTD beverages is strictly regulated in the European Union. Manufacturers may find it challenging to produce new products or reformulate old ones as a result of this.
IMPACT OF RUSSIA UKRAINE WAR
The war between Russia and Ukraine has negatively impacted non-alcoholic RTD Beverages. According to the Yale School of Management, over 750 companies have officially acknowledged that they have voluntarily reduced their operations in Russia, while others remain. At least 253 organizations are making a clean escape, leaving no operational footprint behind. Coca-Cola, Mars, Nestlé, and Unilever are just a few of the major corporations that have suspended advertising, sales, and investments in Russia. Some companies, including Carlsberg and Diageo, acted mere days after the invasion and banned exports, while others waited weeks.
IMPACT OF ONGOING RECESSION
The recession has impacted the non-alcoholic and alcoholic RTD Beverages market globally. The yearly rate of inflation for food and beverages was 19.2%, according to the Office of National Statistics (ONS). Beer, wine, and spirits prices rose as well, but not as dramatically as non-alcoholic beverages. The disruption in supply and scarcity of raw materials used in the beverages industry has led to an increase in price and downfall of businesses. and Consumers may shift their demand toward lower-priced non-alcoholic RTD beverages. The recession has made consumers shift to essential drinks such as functional beverages with added nutrients.
MARKET SEGMENTATION
by Type
-
Fermented Beverage
-
Dairy-based Beverages
-
other
-
-
Non- Fermented Beverage
-
Sports and Energy drinks
-
Functional Water
-
Carbonated Soft drinks
-
Fruit and Vegetable juices
-
Dairy Beverages
-
other
-
By Distribution Channel
-
Supermarkets/Hypermarkets
-
Convenience Stores
-
Online Stores
-
Other
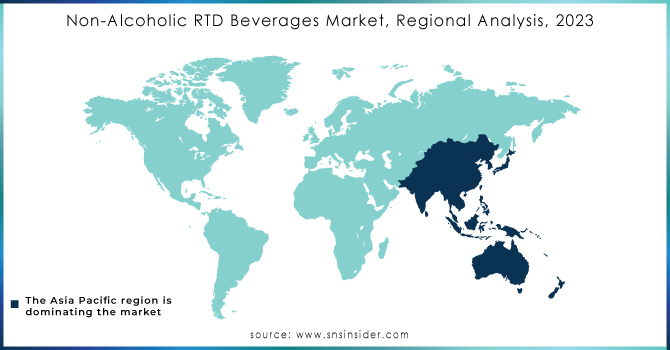
REGIONAL ANALYSIS
Asia Pacific holds the major share of non-alcoholic RTD Beverages. Owing to the demand for non-alcoholic beverages. Rapid change in urbanization, rising population, and growing spending capacity on beverages are driving the demand. The region has having growing demand for fortified and functional non-alcoholic beverages.
North America is expected to have significant growth in this product market. Non-alcoholic ready-to-drink (RTD) goods in the United States are expected to rise by 18% in volume during the forecasted period, owing to the popularity of pre-mixed cocktails. To decrease the dangers of alcohol-related risks, the dietary rules for the Americas forbade adults of legal drinking age from drinking in their regular routine. Furthermore, increased demand for no-sugar and low in calories carbonated drinks prompted producers to experiment with new flavors for zero-calorie drinks in order to attract more customers.
The growing popularity of vegan diets, the growing demand for convenient and healthful beverages, the growing awareness of the health benefits of non-alcoholic beverages, and the expanding popularity of sports and energy drinks in the European region.
Latin America, the Middle East and African regional markets are emerging markets for Non-Alcoholic RTD Beverages. In these regions, market penetration for such products is lower than in others. Various regional and national firms are constantly working to increase their business by increasing their market reach into untapped locations.
Need any customization research on Non-Alcoholic RTD Beverages Market - Enquiry Now
REGIONAL COVERAGE
North America
-
US
-
Canada
-
Mexico
Europe
-
Eastern Europe
-
Poland
-
Romania
-
Hungary
-
Turkey
-
Rest of Eastern Europe
-
-
Western Europe
-
Germany
-
France
-
UK
-
Italy
-
Spain
-
Netherlands
-
Switzerland
-
Austria
-
Rest of Western Europe
-
Asia Pacific
-
China
-
India
-
Japan
-
South Korea
-
Vietnam
-
Singapore
-
Australia
-
Rest of Asia Pacific
Middle East & Africa
-
Middle East
-
UAE
-
Egypt
-
Saudi Arabia
-
Qatar
-
Rest of Middle East
-
-
Africa
-
Nigeria
-
South Africa
-
Rest of Africa
-
Latin America
-
Brazil
-
Argentina
-
Colombia
-
Rest of Latin America
KEY PLAYERS
PepsiCo Inc., Nestle S.A., The Coca-Cola Company, Red Bull GmbH, Suntory Holdings Limited, Danone S.A., Keurig Dr Pepper Inc., Asahi Group Holdings Ltd., Del Monte Foods, Monster Beverages Corp, and other key players are mentioned in the final report.
RECENT DEVELOPMENTS
In 2023 Nestlé plans to build a factory in the United States to address the increasing demand for RTD beverages. The funds will be used to add two additional manufacturing facilities and generate 60 new jobs.
In 2022 Del Monte Foods, Inc., an America-based food company, collaborated with Old Tom Gin, a Scotland-based producer, to establish a line of energy drinks. The new line has actual fruit juice and no added sugar, and it comes in a variety of tastes.
In 2022 Nestlé has revealed intentions to launch cultured whey-based RTD beverages. The product provides consumers with a dairy substitute that is sustainably supplied.
| Report Attributes | Details |
| Market Size in 2023 | US$ 931.1 Billion |
| Market Size by 2032 | US$ 1655.2 Billion |
| CAGR | CAGR of 6.6 % From 2024 to 2032 |
| Base Year | 2023 |
| Forecast Period | 2024-2032 |
| Historical Data | 2020-2022 |
| Report Scope & Coverage | Market Size, Segments Analysis, Competitive Landscape, Regional Analysis, DROC & SWOT Analysis, Forecast Outlook |
| Key Segments | • By Type (Fermented Beverage and Non-Fermented Beverage) • By Distribution Channel (Supermarkets/Hypermarkets, Convenience Stores, Online Stores, and Other) |
| Regional Analysis/Coverage | North America (US, Canada, Mexico), Europe (Eastern Europe [Poland, Romania, Hungary, Turkey, Rest of Eastern Europe] Western Europe] Germany, France, UK, Italy, Spain, Netherlands, Switzerland, Austria, Rest of Western Europe]), Asia Pacific (China, India, Japan, South Korea, Vietnam, Singapore, Australia, Rest of Asia Pacific), Middle East & Africa (Middle East [UAE, Egypt, Saudi Arabia, Qatar, Rest of Middle East], Africa [Nigeria, South Africa, Rest of Africa], Latin America (Brazil, Argentina, Colombia Rest of Latin America) |
| Company Profiles | PepsiCo Inc., Nestle S.A., The Coca-Cola Company, Red Bull GmbH, Suntory Holdings Limited, Danone S.A., Keurig Dr Pepper Inc., Asahi Group Holdings Ltd., Del Monte Foods, Monster Beverages Corp |
| Key Drivers | • Raising demand for non-alcoholic beverages • Increasing trends of functional beverages |
| Market Opportunity | • Consumer inclination toward an active lifestyle |
Frequently Asked Questions
Ans: Asia Pacific is dominate the market in 2023.
Ans: USD 1655.2 billion is expected to grow by 2032.
Ans: Non-Alcoholic RTD Beverages Market size was valued at USD 701.56 billion in 2022
Ans: Drivers are Raising demand for non-alcoholic beverages and increasing trends of functional beverages
Ans: Non-Alcoholic RTD Beverages Market is anticipated to expand by 6.6 % from 2024 to 2032.
Get in Touch
