Non-Carbonated Soft Drinks Market Report Scope & Overview:
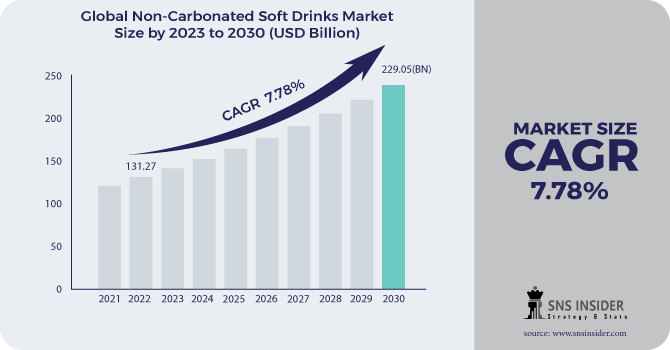
Non-Carbonated Soft Drinks Market Size was valued at USD 131.27 billion in 2022 and is expected to reach USD 229.05 billion by 2030, and grow at a CAGR of 7.78% over the forecast period 2023-2030.
Non-carbonated sodas are sodas without carbon dioxide and shimmering taste and they incorporate fruit juice, natural product drinks, ice tea, espresso with sugar, and game beverages. Non-carbonated sodas don't go through the carbonation interaction and have no shining flavor. The sugar used to improve the customary sodas is either sucrose or high fructose corn syrup. Normal sodas have roughly a similar measure of sugar as a glass of pineapple or squeezed orange, 7-14g/100ml. Diet soda pops use aspartame, saccharine, acesulfame K, or sucralose as their sugar soda pop is marginally acidic to give lovely poignancy to the item and save it. The most well-known acidulated in soda pops are citrus extract and phosphoric acid.
Quite possibly the main patterns in the non-carbonated soda pop market are connected with the flooding interest for solid and feasible items. Purchasers' inclinations have moved to additional regular items with a clean name, including aged drinks, teas, lower sugar refreshments and invigorated drinks with medical advantage claims. Truth be told, individuals are progressively embracing the non-carbonated drinks, however, the utilization of beverages with high sugar content is preferably periodically over consistently, as they are seen more as an extravagance. Likewise, the quantity of individuals who are focusing on naming is expanding. In this way, organizations likewise need to zero in on straightforwardness and effortlessness concerning data, to acquire clients' trust.
Market Dynamics:
Driving Factors:
-
Residents are more well-being cognizant and zeroed in on working on their resistant framework to keep up with wellness.
-
Drinks are fluid food that can be drunk for hydration or as a wellspring of energy.
Restraining Factors:
-
Upset supply chains, limited creation, and diminished requests across the globe.
Opportunities:
-
The rising interest for low-sugar soda pops from buyers.
-
The ceaseless advancement of creative items and alluring bundling builds the interest for non-carbonated soda pops in arising economies.
Challenges:
-
The rising customer wellbeing mindfulness.
Impact of Covid-19:
The lockdown declared during the COVID 19 pandemic by states of different nations had limited or residents like to remain at home as a prudent step. Different shows, games, and other public occasions were dropped across the globe by measures emerging from COVID-19 limitations. Besides, the market encountered a deficit in the deals of non-carbonated soda pops items attributable to upset supply chains, limited creation, and decreased request across the globe. However, residents are more well-being cognizant and zeroed in on working on their safe framework to keep up with wellness, this will set out open doors for the business players.
Market Estimations:
By Distribution channel:
Hypermarkets and stores' circulation channels contributed the biggest piece of the pie. Stores and hypermarkets are a sort of coordinated channel which are more client-situated by selling an assortment of shopper merchandise items straightforwardly to the clients. Online dissemination channel is estimated to develop. A few makers of these items are offering items on their sites as well as on the web-based business stages and have projected the market development in the estimated period.
By Product Type:
RTD section added to the biggest income share. RTD incorporates tea and espresso which contributes most to the market income as it is thought to be a substitution for carbonated drinks. Numerous sellers sent off new inventive kinds of RTD hence this fragment is supposed to offer seriously during the figure time frame. The shimmering and seasoned water portion is a figure to extend. Expanding interest for low carbs and low sugar beverages will drive purchasers to favor shimmering and enhanced water over some other beverages. Creative flavors like cocoa, citrus, and numerous different organic products are expanding ubiquity among buyers.
Key Market Segments:
By Distribution Channel:
-
Hypermarkets and Supermarkets
-
Convenience Store
-
Online
-
Others
By Product:
-
RTD
-
Sparkling & Flavored Water
.png)
Regional Analysis:
-
North America
-
USA
-
Canada
-
Mexico
-
-
Europe
-
Germany
-
UK
-
France
-
Italy
-
Spain
-
The Netherlands
-
Rest of Europe
-
-
Asia-Pacific
-
Japan
-
south Korea
-
China
-
India
-
Australia
-
Rest of Asia-Pacific
-
-
The Middle East & Africa
-
Israel
-
UAE
-
South Africa
-
Rest of Middle East & Africa
-
-
Latin America
-
Brazil
-
Argentina
-
Rest of Latin America
-
The Asia Pacific added to the biggest portion of the overall industry. Nations like China and India are emphatically adding to the market income. The ideal ecological circumstances are great for establishing tea and espresso around here. Moreover, factors, for example, immense creation of tea and espresso, a rising number of food handling units, and colossal utilization by a developing populace, are supposed to add to showcase income. Center East and Africa is a figure to develop. Ascending higher utilization of the item by the customers and lavish administrations given by the cafés and inns will drive the local interest.
Key Players:
Companies covered in these markets are Nestlé, Pepsico, Inc., The Coca-Cola Company, Keurig Dr Pepper Inc (KDP), Red Bull GmbH, Unilever PLC, Monster Energy Company, AriZona Beverages USA LLC, Hint Inc., Spindrift Beverage Co., Inc.
Pepsico, Inc-Company Financial Analysis
| Report Attributes | Details |
|---|---|
| Market Size in 2022 | US$ 131.27 Billion |
| Market Size by 2030 | US$ 229.05 Billion |
| CAGR | CAGR 7.78% From 2023 to 2030 |
| Base Year | 2021 |
| Forecast Period | 2023-2030 |
| Historical Data | 2020-2021 |
| Report Scope & Coverage | Market Size, Segments Analysis, Competitive Landscape, Regional Analysis, DROC & SWOT Analysis, Forecast Outlook |
| Key Segments | • by Product (RTD, Sparkling & Flavored Water) • by Distribution Channel (Hypermarkets and Supermarkets, Convenience stores, Online, Others) |
| Regional Analysis/Coverage | North America (USA, Canada, Mexico), Europe (Germany, UK, France, Italy, Spain, Netherlands, Rest of Europe), Asia-Pacific (Japan, South Korea, China, India, Australia, Rest of Asia-Pacific), The Middle East & Africa (Israel, +D11UAE, South Africa, Rest of Middle East & Africa), Latin America (Brazil, Argentina, Rest of Latin America) |
| Company Profiles | Nestlé, Pepsico, Inc., The Coca-Cola Company, Keurig Dr Pepper Inc (KDP), Red Bull GmbH, Unilever PLC, Monster Energy Company, AriZona Beverages USA LLC, Hint Inc., Spindrift Beverage Co., Inc. |
| Key Drivers | •Residents are more well-being cognizant and zeroed in on working on their resistant framework to keep up with wellness. •Drinks are fluid food that can be drunk for hydration or as a wellspring of energy. |
| Market Restraints | •Upset supply chains, limited creation, and diminished requests across the globe. |
Frequently Asked Questions
The Global Non-Carbonated Soft Drinks Market Size was valued at USD 121.8 billion in 2021
Manufacturers, Research Institutes, university libraries, suppliers, and distributors of the product.
Distribution Channel and Product segments are covered in the Rice Market.
Residents are more well-being cognizant and zeroed in on working on their resistant framework to keep up with wellness and the rising interest for low-sugar soda pops from buyers are the elements driving and resulting in opportunities for the Non-Carbonated Soft Drinks market.
Hypermarkets and Supermarkets segment is projected to make a foothold in the worldwide Non-Carbonated Soft Drinks market.
Get in Touch
