Optical Lens Market Report Scope and Overview:
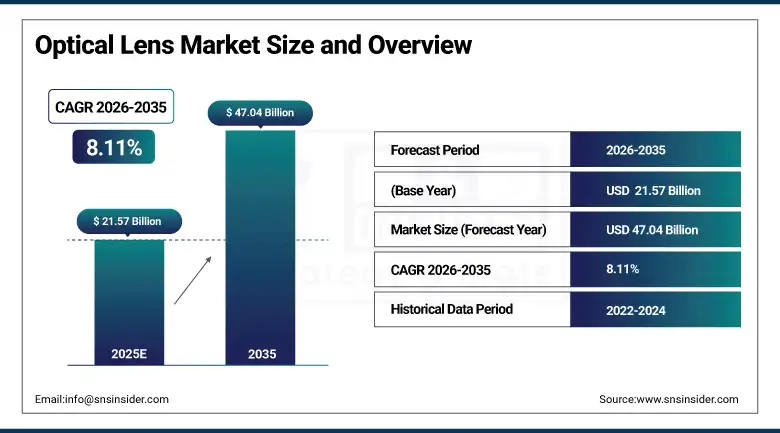
The Optical Lens Market Size was valued at USD 21.57 Billion in 2025E and is expected to reach USD 47.04 Billion by 2035 and growing at a CAGR of 8.11% over the forecast period 2026-2035.
Factors, such as increasing demand for optical lens in smartphones, AR/VR devices and medical imaging will drive the optical lens market trends. Market growth across industry is driven by the technological advancements in precision optics, miniaturization, and increased adoption in automotive safety systems.
Rapid increase in the demand for the optical lens market, which can be attributed to the need for high-resolution imaging in smart devices has spurred the growth of the optical lens market over the forecast timeline as well. The rise of AR/VR headsets for gaming, training, and industrial use is also driving strides in lens innovation. At the same time, trends, such as miniaturization, better lens coatings, and lighter materials, will increasingly be boosting performance, leading to optical lenses becoming a necessity in a variety of rapidly developing end-use segments.
Carl Zeiss sold 15,000 units of their latest surgical microscope lenses globally in Q1 2024 alone, up 18% from the previous year
Optical Lens Market Size and Growth Projection:
-
Market Size (2025E): USD 21.57 Billion
-
Market Size (2035): USD 47.04 Billion
-
CAGR: 8.11% (2026–2035)
-
Base Year: 2025E
-
Forecast Period: 2026–2035
-
Historical Data: 2022–2024
To Get more information On Optical Lens Market - Request Free Sample Report
Optical Lens Market Trends Highlights:
-
Rising adoption of smartphones, digital cameras, and increased screen time is driving strong demand for high-quality compact and corrective optical lenses globally.
-
Expanding applications in healthcare such as endoscopes, surgical microscopes, and diagnostic imaging continue to support steady market growth.
-
Advancements in automotive technologies, including ADAS, LiDAR, and autonomous vehicles, are accelerating demand for precision optical lenses.
-
Manufacturing growth is restrained by material limitations and complex technologies required for lightweight, miniaturized, and high-precision lens designs.
-
Rapid growth of AR/VR devices, smart glasses, and wearable technologies presents significant opportunities for ultra-lightweight, high-accuracy lens innovation.
-
Emerging markets in Asia-Pacific and Latin America, along with rising consumer spending on electronics and eye health, are creating new revenue avenues for market players.
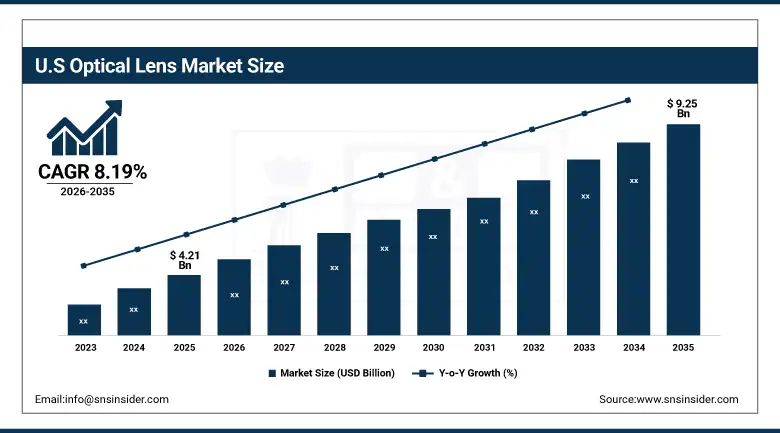
U.S. Optical Lens Market Size Outlook
The U.S. Optical Lens Market size is estimated to be valued at USD 4.21 billion in 2025E and is projected to grow at a CAGR of 8.19%, reaching USD 9.25 billion by 2035. Increase in vision impairments and digital eye strain, high growth in AR/VR headset adoption, installation of ADAS in vehicles and rising consumer demand for modern and aesthetic smart lenses with blue-light/ anti-reflective coatings are driving the U.S. optical lens market.
Optical Lens Market Drivers:
-
Rising Digital Device Use and Automotive Advances Fuel Global Optical Lens Market Growth
The fast-growing demand for smartphones and digital cameras globally, scales up the application of quality compact lenses, which drives the global optical lens market. Moreover, the increasing screen time is projected to positively leverage the increasing incidences of vision-related problems, creating significant demand for corrective fixed spectacles or lenses. It is still an important part of the medical field, where optical lenses provide an important role in endoscopes, surgical microscopes, and diagnostic equipment. Recent developments in the automotive sector, particularly in the field of autonomous and semi-autonomous vehicles are boosting the demand for precision lenses used in an automotive LiDAR and driver assistance systems.
-
The global smartphone market rebounded in 2024, with shipments reaching 1.22 billion units, marking a 7% year-on-year increase. This growth was driven by new device launches and recovery in emerging markets
Optical Lens Market Restraints:
-
Material Limits and Complex Technologies Challenge Optical Lens Market Growth and Manufacturing Innovation
Technological complexities along with material limitation is expected to hinder the growth of the optical lens market. The improved features including lighter designs, better coatings, and miniaturization require innovative manufacturing processes and new materials to make these ultra-high precision lenses, which slows down the production scalability. Moreover, such lenses are also expected to be a part of upcoming technologies, such as AR/VR headsets, and they must work in concert with other hardware, which puts design and engineering challenges.
Optical Lens Market Opportunities:
-
Emerging AR VR and Wearable Tech Drive Demand for Ultra Lightweight Accurate Optical Lenses Globally
Ultra-high accuracy and lightweight lenses, essential to these applications, offer a large growth opportunity in emerging technologies such as AR/VR headsets and smart glasses. As smaller sizes and wearable devices become more common, there are opportunities for new lens developments. In addition, the growing number of middle-class households in the Asia-Pacific and Latin America regions and the growing expenditure on personal health and consumer electronics provide new avenues for players in the market to penetrate and offer affordable, high performance lens solutions.
-
Global shipments of smart glasses experienced a remarkable 210% year-over-year increase in 2024, driven by strong demand for Ray-Ban Meta smart glasses. Meta alone captured over 60% of the market share in 2024.
Optical Lens Market Segment Analysis:
By Type
In 2025E, the Converging lenses segment led the market for optical lenses, with a major share of 67.5% and was predicted to increase. The reason behind their widespread adoption is their wide range of applications in mobile phones, cameras, medical devices, and automotive sectors. Converging lenses capture and focus light more readily, often providing better imaging performance and increased optical quality. End-use segments stick to their stronghold due to their established manufacturing processes and reliability, which makes them the preference in most cases.
The fastest growth of Diverging lens over 2026-2035 is driven by increasing applications in four emerging technologies. One of the significant growth indicators is the increasing utilization of advanced augmented reality (AR) and virtual reality (VR) devices that tend to use diverging lenses to redirect light paths and improve user experience. Diverging lenses are becoming more compact and lightweight due to innovations in optical design and materials, which are paving the way for new applications for wearable technology, automotive LiDAR systems and other precision optical instruments.
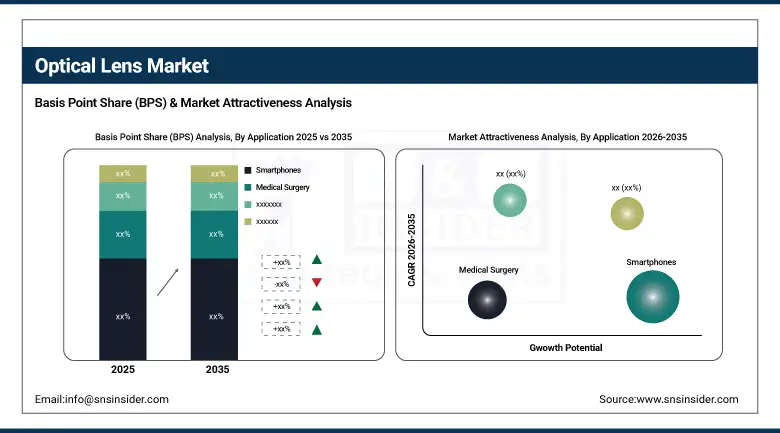
By Application
The largest share of optical lenses belonged to smartphones, representing 34.7% in 2025E, due to the ongoing pursuit of higher quality camera modules and increased imaging and optical performance. With smartphone manufacturers making every effort to enhance photo and video experience, the presence of optical lenses has also become crucial. With the advent of multi-camera setups, and features including optical zoom and low-light photography, sophisticated lenses will continue to have an important place in the larger ecosystem. Such robust demand keeps smartphones the number one application segment for optical lenses.
The AR/VR/headsets or mount display segment is anticipated to witness the highest CAGR during the forecast period over 2026-2035. The explosive growth is driven by the growing adoption of AR and VR technologies in gaming, training, healthcare, and industrial applications. Lightweight, small, and high-precision lenses, developed for near-eye applications and designed for the latest AR/VR systems are opening new possibilities for the innovative AR/VR systems. The market is expected to substantially grow due to high demand for optical lenses, because of the growing immersion experiences becoming common.
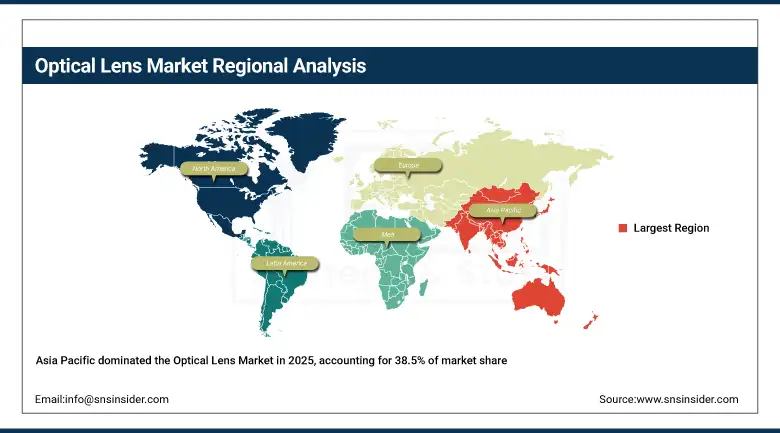
Optical Lens Market Regional Analysis:
Asia-Pacific Optical Lens Market Trends:
In 2025E, the Asia Pacific account for 38.5% of the optical lens market share while the region is estimated to grow at the highest CAGR over 2026-2035. The growth in this region is driven by rising consumer electronics, disposable incomes, and the optical devices among individuals are some of the reasons for its high growth. The increasing demand for smartphones, AR/VR devices, and auto technologies, which need fast lenses, are contributing to the growth of the market.
Get Customized Report as per Your Business Requirement - Enquiry Now
Furthermore, the increasing awareness regarding eye care and technological advancements in the field are driving the demand for diagnostic and corrective lenses. Having many manufacturing hubs and technology innovators in the area also contributes to speeding up product development and adoption. Some of the high growth factors include Investments in R&D to develop lightweight, high-performance lenses customized for next gen devices, such as wearable, AR/VR, and autonomous vehicles. Additionally, a burgeoning middle class with increasing spending on healthcare and electronics presents the perfect opportunity for market players to improve the availability of inexpensive, innovative optical lens solutions.
The Asia Pacific optical lenses market is a significantly dominated market by China, owing to its larger manufacturing facilities and faster urbanization along with strong electronics industry and increasing consumer demand for smartphone, AR/VR devices and automotive technologies.
North America Optical Lens Market Trends:
The growth in optical lens market in North America is fueled by the significant demand for high-quality imaging in consumer electronics, automotive LIDAR systems, and healthcare applications. This area also enjoys some heavy investments in research and development and avails of innovations in light-weight, high-precision lenses suitable for AR/VR headsets and medical apparatuses. This, combined with increased adoption of autonomous and semi-autonomous vehicles, drives demand for unique optical components. Moreover, increasing awareness regarding vision health coupled with rising adoption of optical lenses in surgical and diagnostic devices is expected to further drive market growth. The existing supply chain and the presence of key industry players keeps the market growth consistent.
The U.S. optical lens market in North America accounts for the highest market share owing to the established ecosystem for advanced technology, strong R&D infrastructure, high consumer consumption of electronics and leading position in innovations for automotive and medical devices.
Europe Optical Lens Market Trends:
The increasing need for optical components in automotive, health, and consumer electronics end-use industries for high-quality imaging is driving the optical lens market in Europe. The rising private investments in precision manufacturing and innovation help in advance lens for AR or VR devices and in medical usage. Regulatory standards keep a strict check on the quality of the product which in return creates the market trust. Also, growth is steady with the increased awareness for eye care, and also the growing acceptance of optical lenses in diagnostic and surgical machinery. Market players can also look forward to new opportunities as the region's emphasis on sustainability along with eco-friendly materials.
Latin America Middle East & Africa Optical Lens Market Trends:
Growth in the optical lens market in Latin America and Middle East & Africa (MEA) is driven by increasing smartphone adoption, increasing healthcare investments, increasing automotive sector. Improved access to advanced medical technology is fueling demand for precision lenses due to the increasing digitalization of the healthcare industry. Although lacking in adequate infrastructure, these areas provide opportunity for growth led by growing middle-class populations and government initiatives that enable technology adoption. This concentration on low cost, high-throughput optical solutions subsequently drive rapid market adoption across both regions.
Optical Lens Market Competitive Landscape:
EssilorLuxottica – Established in 2018, EssilorLuxottica is a global leader in ophthalmic optics and eyewear, specializing in lenses, frames, and sunglasses. The company focuses on vision care innovation, combining Essilor’s lens expertise with Luxottica’s iconic brands, including Ray-Ban and Oakley, serving millions of consumers worldwide.
-
In January 2024, EssilorLuxottica made its debut at CES 2024 in Las Vegas, showcasing innovative smart and hearing-aided eyewear. The event highlighted their cutting-edge Nuance Audio and Ray-Ban Meta smart glasses.
Carl Zeiss AG – Established in 1846, Carl Zeiss is a German multinational renowned for precision optics and optoelectronics. The company specializes in camera lenses, microscopes, medical devices, and industrial metrology solutions, delivering high-quality optical innovations across healthcare, consumer imaging, and industrial applications worldwide.
-
In January 2024, ZEISS launched Light 2 lenses, enhancing comfort and accessibility for progressive and digital lens users. This new design improves visual ease for everyday wear.
Optical Lens Companies are:
-
EssilorLuxottica
-
Carl Zeiss
-
Nikon Corporation
-
Canon Inc.
-
Sony Corporation
-
Schneider Kreuznach
-
Leica Camera AG
-
Fujifilm Holdings Corporation
-
Seiko Optical Products
-
Rodenstock GmbH
-
Pentax (Ricoh Imaging Company)
-
Tamron Co., Ltd.
-
Sigma Corporation
-
Samsung Electro-Mechanics
-
Kowa Company, Ltd.
-
Tokina Co., Ltd.
-
Samyang Optics Co., Ltd.
-
Optex Co., Ltd.
| Report Attributes | Details |
|---|---|
| Market Size in 2025E | USD 21.57 Billion |
| Market Size by 2035 | USD 47.04 Billion |
| CAGR | CAGR of 8.11% From 2026 to 2035 |
| Base Year | 2025E |
| Forecast Period | 2026-2035 |
| Historical Data | 2022-2024 |
| Report Scope & Coverage | Market Size, Segments Analysis, Competitive Landscape, Regional Analysis, DROC & SWOT Analysis, Forecast Outlook |
| Key Segments | • By Type (Converging, Diverging) • By Application (AR/VR/Headsets or Mounted Display, Camera, Automotive, Smartphones, Medical Surgery, Others (Education/Research, Gaming)), |
| Regional Analysis/Coverage | North America (US, Canada), Europe (Germany, UK, France, Italy, Spain, Russia, Poland, Rest of Europe), Asia Pacific (China, India, Japan, South Korea, Australia, ASEAN Countries, Rest of Asia Pacific), Middle East & Africa (UAE, Saudi Arabia, Qatar, South Africa, Rest of Middle East & Africa), Latin America (Brazil, Argentina, Mexico, Colombia, Rest of Latin America). |
| Company Profiles | EssilorLuxottica, Carl Zeiss, HOYA Corporation, Nikon Corporation, Canon Inc., Sony Corporation, Schneider Kreuznach, Leica Camera AG, Fujifilm Holdings Corporation, Olympus Corporation, Seiko Optical Products, Rodenstock GmbH, Pentax (Ricoh Imaging Company), Tamron Co., Ltd., Sigma Corporation, Samsung Electro-Mechanics, Kowa Company, Ltd., Tokina Co., Ltd., Samyang Optics Co., Ltd., Optex Co., Ltd. |
Get in Touch
