Particle Counter Market Size & Overview:
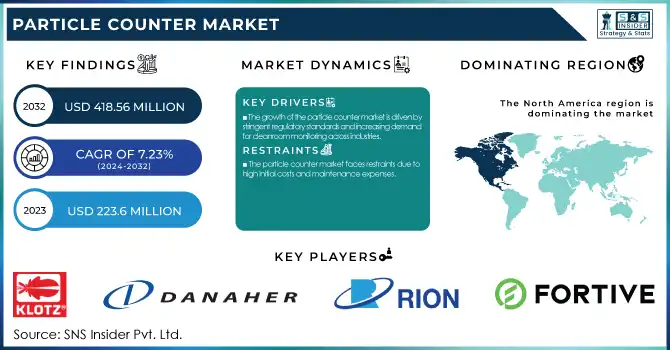
The Particle Counter Market Size was valued at USD 223.6 million in 2023 and is expected to reach USD 418.56 million by 2032 and grow at a CAGR of 7.23% over the forecast period 2024-2032. This report identifies the rising incidence and prevalence of air and water pollutants, fueling the need for sophisticated monitoring solutions. The research examines particle counter sales and adoption patterns by region, driven by increasing awareness of air quality, industrial safety legislation, and the growth of healthcare and cleanroom monitoring spending. Further, it explores emerging technologies and innovations in particle counters, such as developments in real-time monitoring and automation, with the changing regulatory and compliance scenario that influences market growth. The report also discusses investment and R&D trends, highlighting the role of ongoing technological advancements and industry-led research in boosting market potential.
Get more information on Particle Counter Market - Request Sample Report
Particle Counter Market Dynamics
Drivers
-
The growth of the particle counter market is driven by stringent regulatory standards and increasing demand for cleanroom monitoring across industries.
Regulatory authorities like the FDA (21 CFR Part 11), ISO 14644-1, and EU GMP Annex 1 require contamination control in pharmaceutical, biotechnology, and semiconductor applications, which have driven the usage of particle counters. The increased incidence of airborne and liquid contamination has also influenced the demand for real-time monitoring in healthcare, food, and beverage industries. Also, the growing awareness of air pollution and environmental monitoring has increased demand for airborne particle counters in air quality assessment industries. The expansion of the semiconductor industry, which is fueled by nanotechnology and microelectronics developments, has also fueled the demand for accurate contamination monitoring. Furthermore, technological developments like IoT-based particle counters that offer real-time data analysis and remote monitoring are driving adoption across industries. The COVID-19 pandemic hastened investments in hospital infection control, and also increased the need for air quality monitoring solutions. Other industries like aerospace and defense are also introducing particle counters for precise contamination measurement to ensure operational safety and compliance with regulations. The growing emphasis on quality assurance in manufacturing and research facilities continues to propel the market forward.
Restraints
-
The particle counter market faces restraints due to high initial costs and maintenance expenses.
High-end particle counters using laser-based detection and real-time monitoring are costly, and it is challenging for SMEs to adopt them. Calibration and maintenance needs also contribute to operational expenses, requiring industries to have substantial budgets for maintenance. Limited awareness and technical skills in developing regions further limit market penetration. In industry sectors like food & beverage and industrial manufacturing, companies tend to value cost over precision monitoring, curtailing mass uptake. In addition, diversity in regulatory requirements across regions adds complexity to manufacturers, who need to comply with a number of certification procedures prior to accessing new markets. The increased use of alternative contamination monitoring techniques like microbiological testing and gravimetric analysis also puts a cap on the use of particle counters in some applications. Further, industries with lesser risk of contamination, like general industrial production, also fail to invest in sophisticated particle monitoring equipment. The lag in uptake within developing economies, resulting from cost considerations and reduced regulation enforcement, is another market restraint that prevents the expansion. These together are acting as restrains and impeding the general use of sophisticated particle counter technology.
Opportunities
-
The growing emphasis on air and water quality monitoring presents significant opportunities for the particle counter market.
With an increasing level of global air pollution, governments worldwide are imposing increasingly stricter regulations that trigger demand for airborne particle counters. Efforts like the WHO Global Air Quality Guidelines and air monitoring programs run by governments within the U.S. (EPA's AirNow) and Europe (European Environment Agency) are raising expenditures in real-time monitoring of pollutants. Also, the fast development of the pharmaceutical and biotech industries is a good opportunity, as firms increase cleanroom space to comply with strict regulatory requirements. The semiconductor industry's need for ultra-clean environments is another opportunity, as contamination control is essential for nanotechnology and microelectronics manufacturing. The increasing use of automation and AI-based monitoring is making smart particle counters possible that are integrated with cloud platforms for remote access and predictive maintenance. The growing emphasis on aerospace industry contamination monitoring and space research is also broadening the scope of particle counters' applications. In addition, emerging markets like India and Southeast Asia, which have developing economies with burgeoning pharmaceutical and semiconductor industries, offer untapped market potential for growth. The convergence of IoT, AI, and smart sensors in particle counters will drive the next wave of industry development, enhancing efficiency and data-driven decision-making.
Challenges
-
One of the primary challenges in the particle counter market is data accuracy and reliability in dynamic environments.
Variables like humidity, temperature variations, and airflow changes can affect particle measurement readings, causing them to be inconsistent. This issue is particularly significant in high-precision sectors like pharmaceuticals, aerospace, and semiconductor production, where even slight variations can cause compliance failures. Another significant challenge is the potential for sensor contamination and instrument failure with long-term use, necessitating regular calibration and maintenance. Also, measurement method standardization across industries is still an obstacle, with different industries applying different threshold levels and contamination detection parameters, posing challenges to universal acceptance. Cybersecurity attacks in IoT-based particle counters are also becoming a challenge, as real-time monitoring systems are becoming more and more integrated with cloud-based data management platforms, exposing them to hacking and data breaches. A second challenge is slow uptake of next-generation monitoring technology in price-sensitive markets, with companies reluctant to move from low-cost or manual particle counters to high-end automatic particle counters. Finally, supply chain disruptions to the semiconductor and electronics industries disrupt the supply of critical components to produce particle counters, causing delay in product shipment and raising the cost.
Particle Counter Market Segmentation Insights
By Product
Airborne particle counters captured the highest market share in 2023, representing 55% of the overall market. This was fueled by the increasing need for cleanroom monitoring in sectors like pharmaceuticals, semiconductors, and healthcare. Strict regulatory requirements, including ISO 14644-1 for cleanrooms and FDA regulations for pharmaceutical production, also spurred the use of airborne particle counters. Moreover, growing air pollution and indoor air quality monitoring concerns helped drive their extensive use.
Liquid particle counters were the segment that grew at the fastest rate during the forecast period, with considerable growth in the Particle Counter market. Increasing demand for accurate contamination monitoring in injectable drugs, water treatment, and semiconductor manufacture was the driver. Stringency in USP <788> regulation for injectable solutions was a key factor behind the growing use of liquid particle counters. Their capability to detect trace amounts of microscopic contaminants in high-purity liquids has made them a major growth driver in the industry.
By Application
Cleanroom monitoring was the most dominant application segment in 2023, accounting for almost 60% of the overall market share. The segment's dominance was due to the stringent regulatory environment in pharmaceutical production, biotechnology, and semiconductor manufacturing, where contamination control is paramount. The growth of cleanroom facilities in these industries, coupled with increasing investments in sophisticated air quality monitoring systems, played a key role in the segment's market dominance.
Liquid contamination monitoring was the most rapidly growing application in the forecast year, led by growing interest in water and fluid purity in key industries like pharmaceuticals, food & beverage, and microelectronics. Implementation of strict standards for quality control, especially in injectable medicines and beverage manufacturing, resulted in greater usage of liquid particle counters. Increased investment in water treatment facilities and ultrapure water monitoring also spurred growth in this segment.
By Modality
Portable particle counters dominated the market in 2023 with a 48% share, due to their convenience, simplicity, and widespread usage across cleanrooms, environmental monitoring, and industrial contamination surveys. Their capability to offer real-time data and adherence to regulatory standards made them the most sought-after solution for industries demanding on-site monitoring. Increased demand for handheld monitoring equipment in healthcare and pharmaceutical industries further entrenched their market share.
Remote particle counters were the highest-growing modality during the forecast period, with growth spurred by the growing demand for continuous and automated monitoring tools in controlled environments. Pharmaceutical, semiconductor manufacturing, and aerospace industries preferred these products because they can supply real-time information without any intervention. Integration of IoT and cloud-based monitoring solutions also fueled the demand for remote particle counters to ensure compliance with regulations and optimal operations.
Particle Counter Market Regional Analysis
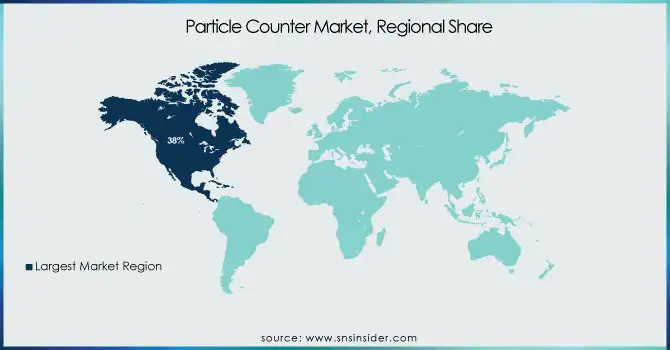
North America led the market for particle counters in 2023, accounting for nearly 38% of the overall market share. The region's dominance was fueled by strict regulatory needs in pharmaceuticals, biotechnology, and semiconductor sectors, especially in the U.S., where institutions like the FDA and EPA require precise contamination monitoring. The presence of prominent industry players, growing cleanroom technology adoption, and growing investment in air quality monitoring also helped contribute to the dominance of North America.
Europe was the second-largest market, which was fueled by regulatory compliance for environmental and industrial pollution control, especially in Germany, France, and the U.K. The pharmaceutical industry's compliance with EU GMP standards also played a key role in driving the demand for particle counters. Asia-Pacific was the fastest-growing region, with a projected growth rate of over the forecast period, driven by aggressive industrialization, increasing adoption of cleanrooms in semiconductor and healthcare industries, and strict pollution control laws. These nations, including China, Japan, and South Korea, saw a rapid demand growth, especially for liquid particle counters, which were the global fastest-growing product category as they gained wider applications in pharmaceutical water purity monitoring and ultrapure water usage in semiconductor manufacturing.
Get Customized Report as per Your Business Requirement - Enquiry Now
List of Key Players and Their Particle Counter Products
-
Markus Klotz GmbH – KO-15, KO-200, Klotz KO-4
-
Danaher (Beckman Coulter, Inc.) – HIAC 9703+, HIAC PODS, MET ONE 3400+
-
RION Co., Ltd. – KC-52, KC-31, KR-12A
-
Fortive Corporation (Fluke Corporation and Setra Systems) – Fluke 985, Setra Systems 8000 Series
-
Lighthouse Worldwide Solutions – Apex Z3, Apex P3, Handheld 3016
-
Spectris Plc – Airy Technology P311, Particles Plus 8306
-
TSI Inc. – AeroTrak 9306, AeroTrak 9110, Chemtrak 8200
-
PAMAS Partikelmess – PAMAS S40, PAMAS SBSS, PAMAS 4132
-
Met One Instruments, Inc. – GT-526S, 804 Handheld, BT-637
-
PCE Deutschland GmbH – PCE-PCO 2, PCE-PCO 1, PCE-MPC 10
-
Ventureduyne Ltd. – Lighthouse Apex, Airnet II
-
Particle Plus, Inc. – Particles Plus 8301, 8506, 9501
-
Kanomax USA, Inc. – Model 3889, Model 3905, Model 3910
-
Veralto Corporation – HIAC 9703+, MET ONE 3400
-
Horiba Ltd. – LA-350, LA-960V2
-
Greywolf Sensing Solutions – GreyWolf PC-4000, PC-5000
Recent Developments
In Feb 2025, Trescal acquired FMS, strengthening its contamination control capabilities in the UK and Ireland. This follows previous acquisitions, including Cleanroom Management International (2021) and five firms in 2023, further expanding Trescal’s expertise in environmental monitoring and cleanroom solutions.
| Report Attributes | Details |
| Market Size in 2023 | USD 223.6 million |
| Market Size by 2032 | USD 418.56 million |
| CAGR | CAGR of 7.23% From 2024 to 2032 |
| Base Year | 2023 |
| Forecast Period | 2024-2032 |
| Historical Data | 2020-2022 |
| Report Scope & Coverage | Market Size, Segments Analysis, Competitive Landscape, Regional Analysis, DROC & SWOT Analysis, Forecast Outlook |
| Key Segments | • By Product [Airborne Particle Counters, Liquid Particle Counters, Others] • By Application [Cleanroom Monitoring, Contamination Monitoring of Liquids, Aerosol Monitoring and Research] • By Modality [Benchtop, Portable, Remote] |
| Regional Analysis/Coverage | North America (US, Canada, Mexico), Europe (Eastern Europe [Poland, Romania, Hungary, Turkey, Rest of Eastern Europe] Western Europe] Germany, France, UK, Italy, Spain, Netherlands, Switzerland, Austria, Rest of Western Europe]), Asia Pacific (China, India, Japan, South Korea, Vietnam, Singapore, Australia, Rest of Asia Pacific), Middle East & Africa (Middle East [UAE, Egypt, Saudi Arabia, Qatar, Rest of Middle East], Africa [Nigeria, South Africa, Rest of Africa], Latin America (Brazil, Argentina, Colombia, Rest of Latin America) |
| Company Profiles | Markus Klotz GmbH, Danaher (Beckman Coulter, Inc.), RION Co., Ltd., Fortive Corporation (Fluke Corporation and Setra Systems), Lighthouse Worldwide Solutions, Spectris Plc, TSI Inc., PAMAS Partikelmess, Met One Instruments, Inc., PCE Deutschland GmbH, Ventureduyne Ltd., Particle Plus, Inc., Kanomax USA, Inc., Veralto Corporation, Horiba Ltd., Greywolf Sensing Solutions. |
Frequently Asked Questions
The Particle Counter Market is expected to reach US$ 418.56 Mn by 2032.
Top-down, bottom-up, Quantitative, Qualitative Research, Descriptive, Analytical, Applied, Fundamental Research.
The challenges faced by Particle Counter market is Particle counters have some technical constraints.
The by technology Type is divided into three sub segments :
- Airborne Particle Counters
- Liquid Particle Counters
- Others
The Particle Counter Market is to grow at a CAGR of 7.23% over the forecast period 2024-2032.
Get in Touch
