Cleanroom Technologies Market Report Scope & Overview:
Get more information on Cleanroom Technologies Market - Request Sample Report
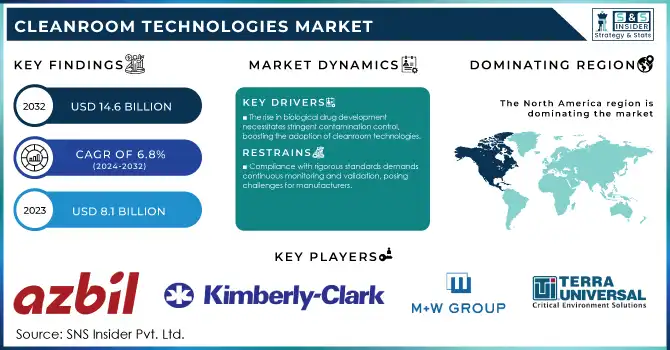
The Cleanroom Technologies Market Size was valued at USD 8.1 billion in 2023 and is expected to reach USD 14.6 billion by 2032 and grow at a CAGR of 6.8% over the forecast period 2024-2032.
The growth of the Cleanroom Technologies Market is expected to be driven by stringent regulations and rising demand for contamination control across critical industries. Governments worldwide are enhancing their focus on product safety and quality, especially in sectors like pharmaceuticals and biotechnology. As an example, Current Good Manufacturing Practice (CGMP) guidelines have been issued by the U.S. Food and Drug Administration (FDA) in the year 2023 revealing the need for advanced cleanroom solutions to fulfill production standards. Likewise, the European Medicines Agency (EMA) revised Annex 1 of its standards with a fresh perspective on the contribution of cleanroom environments to sterile drug manufacture. In addition, the World Health Organization (WHO) records a 30% increase in compliance inspections in 2023, a result of worldwide attempts to comply with rigorous safety standards with more industries like electronics responding to rising pressure for cleaner manufacturing environments as technology and miniaturization expand the need, this focus has also grown increasingly applicable in these areas. All these rules and technological innovations together boost the use of cleanroom technologies in various industries.
The global cleanroom technologies market is essential to provide contamination-free environments across a wide range of industries such as healthcare, pharmaceuticals, biotechnology, and electronics. This is due to the fast growth of these industries and the need for contamination-free production environments with more emphasis on ensuring quality production. The market is also propelled by government initiatives like the ‘Make in India’ campaign in India and the push for increasing pharmaceutical manufacturing in China. For example, The Indian Ministry of Health reported a 15% increase in the investments made towards advanced manufacturing facilities, like cleanrooms, in 2023 alone. Likewise, the Chinese government's initiatives encouraging high-end electronics manufacturing helped spur a 20% increase in cleanroom added last year. This major trend highlights the importance of cleanroom technologies needed to comply with regulatory standards as well as quantifiable production quality metrics.
Market Dynamics
Drivers
-
The rise in biological drug development necessitates stringent contamination control, boosting the adoption of cleanroom technologies.
-
Innovations such as modular cleanrooms offer flexibility and cost-effectiveness, enhancing their appeal across various industries.
-
Increased research and development investments in pharmaceuticals require controlled environments, driving the demand for cleanroom solutions.
Growing demand for biologics and biopharmaceuticals is one of the major factors that is anticipated to drive the growth of the cleanroom technologies market. Biologics, including a wide range of products such as vaccines, blood components, and gene therapies, need production environments milled down with acute control to ensure product viability and patient health. This requirement has resulted in a greater uptake of cleanroom technologies in the biopharma industry.
The biopharmaceutical industry has seen explosive growth recently, including a significant increase in the number of biologics under development. The global biopharmaceutical pipeline, for example, has grown substantially, with hundreds of biological candidates now in clinical development worldwide, across multiple phases of clinical study. This expansion highlights the dedication of the industry to focus on novel therapies and further drives demand for enhanced cleanroom solutions to ensure strict contamination control in the manufacturing process. One such trend is that of monoclonal antibodies they are becoming applicable for the treatment of some diseases like cancers and autoimmune diseases. Due to the highly sensitive production of the antibodies, the manufacturing needs aseptically to take place, which requires cleanrooms with HEPA filters and special airflow systems. Moreover, The COVID-19 pandemic has expedited the discovery, development, and manufacture of vaccines and therapeutic biologics, which will further propel the demand for cleanroom technologies.
Restraints:
-
Establishing and maintaining cleanrooms involve significant expenses, including specialized HVAC systems and energy consumption, which can deter adoption.
-
Compliance with rigorous standards demands continuous monitoring and validation, posing challenges for manufacturers.
The high cost of ownership of cleanrooms is one of the most prominent restraints in the cleanroom technologies market. Cleanroom set-up demands a significant up-front investment as it requires specific infrastructure including high-efficiency particulate air (HEPA) filters, complex HVAC equipment, and strict environmental controls. Well, even after installation, operating expenses are still high as power-hungry systems are needed to keep air cleanliness, temperature, and humidity in check. Meeting stringent cleanliness standards in large facilities is energy-intensive with these systems, especially for extensive facilities.
To add to the cost, maintenance costs are piling up. Testing, validating, and confirming that protocols are followed regularly is not only expensive and time-consuming it also requires certain equipment and experienced workers. It also poses a cost hurdle, especially for small and medium enterprises (SMEs), restricting their way through cleaning room technologies. Consequently, a lot of businesses may use alternatives or postpone upgrades which can restrain the global market growth.
Cleanroom Technologies Market Segmentation Analysis
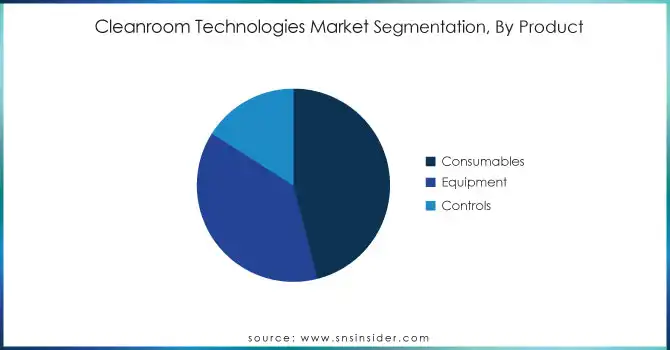
By Product
The consumables segment in the market held the largest share 46% in 2023. The dominance of them may be explained by the high turnover and regulatory demands of single-use devices in cleanroom settings. According to the U.S. Centers for Disease Control and Prevention (CDC), healthcare-associated infections (HAIs) continue to rise, increasing by 25% in 2023, creating an urgent demand for robust contamination control solutions. As a result, a high order of cleanroom consumables including gloves, wipes, disinfectants, etc. are required. The U.S. Environmental Protection Agency (EPA) has also tightened regulations on cleanroom disinfectants, resulting in a 15% increase in the registration of new, more effective cleaning agents in 2023. In addition, In 2022, the number of personal protective equipment (PPE) used in pharmaceutical manufacturing facilities increased by 20%, as per a report from the National Institute for Occupational Safety and Health (NIOSH), thereby, affecting the demand for cleanroom garments and gloves. In 2023, according to the National Institutes of Health (NIH), there was a 12% rise in research and development spending in the biotechnology sector which requires cleanroom consumables and growing applications of cleanroom consumables in biotechnology. The expansion of these R&D activities has greatly increased the requirement for superior disposable cleanrooms and related products. Additionally, the U.S. Department of Defense's increased investment in biosecurity measures, with a 30% budget increase for cleanroom-related projects in 2023, has further fueled the consumables market.
By Type
Modular cleanrooms accounted significant share in 2023. The main reason behind this significance is their flexibility, low cost, and easy solution. In 2023, the U.S. Department of Health and Human Services stated modular cleanroom solutions were adopted by healthcare facilities at a rate of 35% as quick deployment of sterile environments is necessary for PPE storage and patient isolation during public health disasters. NYSF also saw a 28% increase in the number of grants approved for research projects that included modular cleanrooms, especially in the fields of nanotechnology and materials science. In 2023, the U.S. Food and Drug Administration (FDA) reported a 20% decrease in contamination-related recalls of pharmaceutical products manufactured in modular cleanrooms compared to traditional cleanrooms and has acknowledged the overall effectiveness of modular cleanrooms. In addition, Modular cleanrooms will use 15–20% less energy than traditional cleanrooms according to the US Department of Energy's Advanced Manufacturing Office which is favorable from the perspective of the government supporting energy-efficient manufacturing. According to the U.S. Small Business Administration, there was a 40% increase this year in small and medium-sized enterprises utilizing modular cleanroom solutions, proving their accessibility and scalability across many businesses.
By End Use
In 2023, the pharmaceutical industry accounted for the largest market share. This dominance is mainly due to the stringent regulatory requirements and the need for contamination control in drug manufacturing. New drug approvals rose 15% in 2023, according to the U.S. Food and Drug Administration (FDA), requiring more cleanroom space in pharmaceutical plants. The Centers for Disease Control and Prevention (CDC) emphasized the importance of cleanroom technology in vaccine production, noting a 30% increase in vaccine manufacturing capacity in the U.S. in 2023. According to the National Institutes of Health (NIH), funding for pharmaceutical research projects requiring cleanroom environments has increased by 25%, with the most significant funding growth observed in projects focused on biologics, gene therapies, and related areas. The Occupational Safety and Health Administration (OSHA) also changed stricter guidelines in 2023 regarding the manufacturing environments drugs are produced, and this caused a 20% increase in cleanroom technology upgrades in this sector. Pharmaceutical output was up 18% in 2023, according to data from the U.S. Department of Commerce, with outcomes enabled by cleanroom technology that helped the industry to attain international quality standards.
Regional Analysis
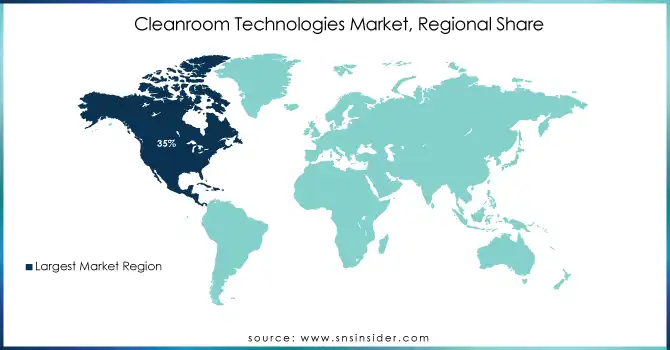
In 2023, Cleanroom Technologies Market was dominated by North America, which captured around 35% of the market. The factors behind this leading position are the region's healthcare infrastructure, spending on research and development, and the high standards that drive a very strict regulatory environment. In 2023, inspections of pharmaceutical manufacturing facilities increased by 20% according to the U.S. Food and Drug Administration (FDA), which is augmenting the adoption of advanced cleanroom technologies. The National Institutes of Health (NIH) allocated $2.5 billion to research infrastructure upgrades, including cleanroom facilities, a 15% increase from a previous year.
On the other hand, Asia-Pacific is expected to exhibit the highest growth rate (CAGR) during the forecast period. Factors such as the growth of the pharmaceutical and electronics industries, rising government investments in healthcare infrastructure, and increasing adoption of cleanroom technologies in emerging economies are needed to drive this rapid growth. For instance, China's National Medical Products Administration reported a 30% increase in the number of GMP-certified pharmaceutical manufacturing facilities in 2023, many of which incorporated state-of-the-art cleanroom technologies. The Indian Department of Pharmaceuticals announced a $1.3 billion plan to develop three bulk drug parks with state-of-the-art cleanroom facilities to meet the domestic demand for active pharmaceutical ingredients that are imported. Demand for high-grade cleanroom solutions continued, supported by the 25% increase in semiconductor manufacturing capacity reported by the Japanese Ministry of Economy, Trade and Industry in 2023.
Need any customization research on Cleanroom Technologies Market - Enquiry Now
Recent developments
-
In March 2024, ABN Cleanroom Technology launches ABN Labs, taking cleanroom technology to the next level - Improving Controlled Environment Science
-
Labconco announced the Nexus Horizontal Clean Bench, the first laminar flow hood containing onboard intelligence within itself, in July 2023.
Key Players
Key Service Providers/Manufacturers
-
Azbil Corporation (Cleanroom Differential Pressure Gauge, Cleanroom Humidity Sensor)
-
Kimberly-Clark Corporation (Kimtech Nitrile Gloves, WypAll Cleanroom Wipes)
-
M+W Group (Modular Cleanroom Systems, Laminar Flow Cabinets)
-
Terra Universal, Inc. (BioSafe Cleanroom Tables, Cleanroom Pass-Through Chambers)
-
Camfil AB (Absolute Filters, CamContain HEPA Modules)
-
Exyte Group (Cleanroom Turnkey Solutions, Barrier Isolation Systems)
-
Taikisha Ltd. (Cleanroom Air Handling Units, HVAC Systems)
-
Ansell Limited (TouchNTuff Gloves, Gammex Surgical Gloves)
-
Illinois Tool Works, Inc. (ITW) (Cleanroom Adhesive Tapes, Static Control Products)
-
DuPont de Nemours, Inc. (Tyvek Coveralls, Nomex Cleanroom Garments)
Key Users:
-
Pfizer Inc.
-
Novartis AG
-
Sanofi S.A.
-
Johnson & Johnson
-
Merck & Co., Inc.
-
Roche Holding AG
-
AstraZeneca plc
-
Samsung Biologics
-
Lonza Group AG
-
Thermo Fisher Scientific, Inc.
| Report Attributes | Details |
|---|---|
| Market Size in 2023 | USD 8.1 Billion |
| Market Size by 2032 | USD 14.6 Billion |
| CAGR | CAGR of 6.8% From 2024 to 2032 |
| Base Year | 2023 |
| Forecast Period | 2024-2032 |
| Historical Data | 2020-2022 |
| Report Scope & Coverage | Market Size, Segments Analysis, Competitive Landscape, Regional Analysis, DROC & SWOT Analysis, Forecast Outlook |
| Key Segments | • By Product (Consumables {Safety Consumables, Cleaning Consumables [Wipes, Disinfectants, Vacuum systems, Other cleaning consumables]}, Equipment, Controls) • By Type (Standard Cleanrooms, Modular Cleanrooms {Hardwall Cleanrooms, Softwall Cleanrooms}, Mobile Cleanrooms) • By End User (Pharmaceutical Industry, Biotechnology Industry, Medical Device Manufacturers, Hospitals, Others) |
| Regional Analysis/Coverage | North America (US, Canada, Mexico), Europe (Eastern Europe [Poland, Romania, Hungary, Turkey, Rest of Eastern Europe] Western Europe] Germany, France, UK, Italy, Spain, Netherlands, Switzerland, Austria, Rest of Western Europe]), Asia Pacific (China, India, Japan, South Korea, Vietnam, Singapore, Australia, Rest of Asia Pacific), Middle East & Africa (Middle East [UAE, Egypt, Saudi Arabia, Qatar, Rest of Middle East], Africa [Nigeria, South Africa, Rest of Africa], Latin America (Brazil, Argentina, Colombia, Rest of Latin America) |
| Company Profiles | Azbil Corporation, Kimberly-Clark Corporation, M+W Group, Terra Universal, Inc., Camfil AB, Exyte Group, Taikisha Ltd., Ansell Limited, Illinois Tool Works, Inc. (ITW), DuPont de Nemours, Inc. |
| Key Drivers | • The rise in biological drug development necessitates stringent contamination control, boosting the adoption of cleanroom technologies. • Innovations such as modular cleanrooms offer flexibility and cost-effectiveness, enhancing their appeal across various industries. |
| Restraints | • Establishing and maintaining cleanrooms involve significant expenses, including specialized HVAC systems and energy consumption, which can deter adoption. • Compliance with rigorous standards demands continuous monitoring and validation, posing challenges for manufacturers. |
Get in Touch
