image

Photovoltaic Solar Connectors Market Size, share & Segmentation By Light Source(LED, High-intensity Discharge (HID) Lighting, Fluorescent Lighting), By Product Type(High/Low Bay Lighting, Flood/Area Lighting), By End User Application(Oil and Gas, Mining, Pharmaceutical, Manufacturing, Warehouse, Other End-user Applications), and Region | Global Forecast 2025-2032

Date: June 2025 Report Code: SNS/SEMI/7578 Page 250

Photovoltaic Solar Connectors Market: Accelerating Towards a Smarter, Safer Solar Future:

The Powering the Future with Intelligent and Resilient Solar Connectors

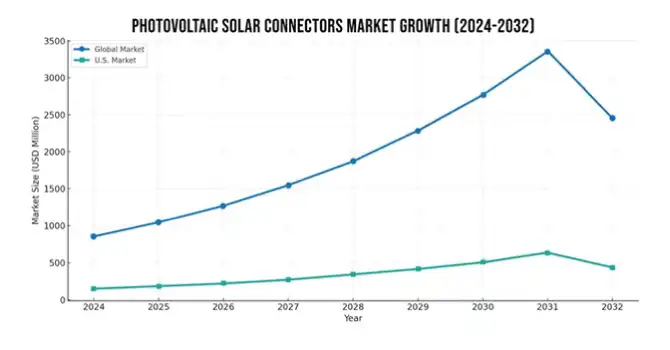
The global photovoltaic solar connectors market, valued at USD 849.26 million in 2024, is projected to reach USD 2,459.16 million by 2032 at a CAGR of 14.22%, fueled by rising solar deployments and demand for efficient, intelligent, and safety-critical MC4 connectors. As grid integration deepens, connectors are evolving from passive links to essential digital enablers of solar infrastructure.

Powering Forward with Innovation, Compliance & Renewable Urgency

Massive solar deployment and global policy incentives like the IRA and EU Green Deal are boosting demand for scalable, locally made connectors. Innovations in materials and EPC-led compliance are driving safer, high-performance connector adoption worldwide.

Wired for the Future Solar Connector Market Shifts toward Intelligence, Power, and Sustainability

  • AI-Enabled Smart Connectors are revolutionizing PV systems with real-time monitoring, predictive diagnostics, and digital twin integration.
  • Next-Gen Compatibility is rising as ≥600W modules drive demand for high-load connectors, with Staubli leading new product rollouts.
  • Recycling Programs in Motion since April 2023 in the U.S. are boosting sustainability by reclaiming old connectors and cables.
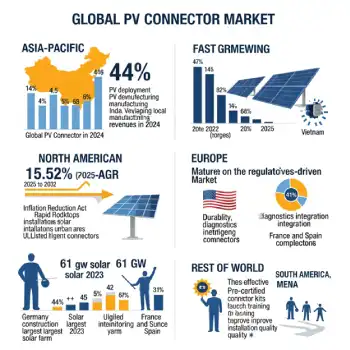
  • Manufacturing Momentum in Asia is growing, with India and Vietnam scaling local production to reduce global supply dependence.

Fault Lines in the Solar Backbone Threaten Industry Momentum

CHALLENGE

STAT/FACT

MARKET IMPACT

System Failures

83% projects had connector issues; 3% led to shutdowns

Drives demand for certified, factory-installed connectors and real-time monitoring tools.

Economic Loss

USD 558,450 revenue loss due to connector fire (June 2025)

Pushes EPCs and developers toward premium components and stricter quality control.

Supply Chain Dependency

Heavy reliance on Chinese manufacturing

Fuels local production push under IRA and diversification strategies.

Labor Shortage

Poor crimping and mismatched connectors (Solar Power World 2024)

Spurs training initiatives and demand for smart, plug-and-play solutions.

Legislative Risk

SEIA warns of USD 286B investment loss, 330,000 job risk if incentives are cut

Market uncertainty; highlights critical role of policy in supporting connector demand and stability.


Harnessing the Sun: Connecting the Photovoltaic World

Photovoltaic and Solar Connectors Market Size, Share, Analysis, Trends 2032

Reshaping the U.S. Photovoltaic Connector Landscape with Policy Power and Innovation

The U.S. Photovoltaic Solar Connectors Market, valued at USD 147.55 million in 2024, is expected to reach USD 433.37 million by 2032 at a CAGR of 14.41%, driven by strong policy support, growing safety awareness, and rapid rooftop solar adoption. The market is evolving into a highly regulated, innovation-focused segment within the global solar ecosystem.

Policy Momentum and Urban Growth Driving U.S. Solar Connector Demand

  • The Inflation Reduction Act is accelerating domestic production of UL-certified connectors, while urban rooftop and community solar programs are driving demand for compact, high-efficiency solutions.
  • EPC firms are enforcing strict safety compliance, and developers are shifting toward connectors with robust safety ratings and integrated diagnostics following major system failures.

Smart Cities and Solar Synergy Powering the Next Wave of U.S. Connector Innovation

The integration of EV chargers, home batteries, and smart monitors is boosting demand for intelligent PV connectors. Urban rooftop solar is expanding due to tax incentives and net metering. Meanwhile, utilities are deploying IoT-enabled connectors to support remote monitoring and predictive maintenance across smart grid infrastructure.

Cost Pressures and Legacy Infrastructure Restraining the U.S. Photovoltaic Solar Connectors Market

In the U.S., legacy procurement habits often favor budget options that don't meet UL standards, accelerating system degradation. Aging solar farms also present compatibility issues, requiring complete rewiring or custom adapters during upgrades.

Critical Fault Lines Undermining Photovoltaic Solar Connectors Reliability in the U.S. Market

A U.S. project reported a 58% revenue loss in June 2025 due to a fire traced back to connector failure. Skilled labor shortages continue to result in poor crimping and mismatched connectors, compromising overall system performance. Additionally, the absence of unified federal standards has led to fragmented adoption and compliance practices across various states.
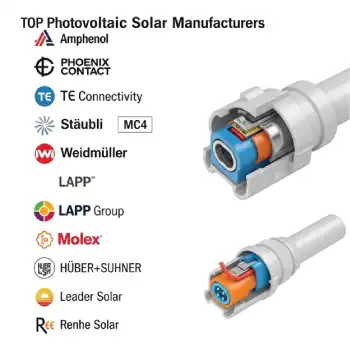
Key Players:


Recent Developments:

  • In  March 2025, Amphenol Industrial Operations launched the H4 PRO Connector and Saguaro Junction Box on 18th March 2025, offering 1500V-rated, low-resistance, and highly scalable solar connectivity solutions optimized for EPC and utility-scale PV installations.
  • In Feb 2025, TE Connectivity, announced its acquisition of Richards Manufacturing for USD 2.3 billion, strengthening its position in North America's energy market by expanding its utility grid solutions and underground distribution portfolio.

Photovoltaic Solar Connectors Market Report Scope:

Report Attributes Details
Market Size in 2024 USD 849.26 Million
Market Size by 2032 USD 2459.16 Billion
CAGR CAGR of 14.22% From 2024 to 2032
Base Year 2024
Forecast Period 2025-2032
Historical Data 2021-2023
Report Scope & Coverage Market Size, Segments Analysis, Competitive Landscape, Regional Analysis, DROC & SWOT Analysis, Forecast Outlook
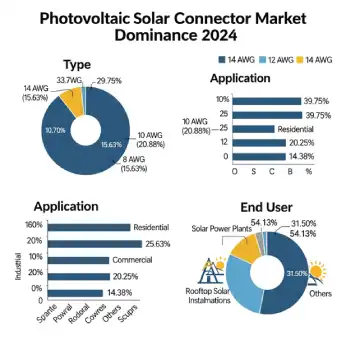
Key Segments • By Type(14 AWG, 12 AWG, 10 AWG, 8 AWG)
• By Application(Industrial, Residential, Commercial, Others)
• By End User(Solar Power Plants, Rooftop Solar Installations, Others)
Regional Analysis/Coverage North America (US, Canada, Mexico), Europe (Germany, France, UK, Italy, Spain, Poland, Turkey, Rest of Europe), Asia Pacific (China, India, Japan, South Korea, Singapore, Australia, Taiwan,  Rest of Asia Pacific), Middle East & Africa (UAE, Saudi Arabia, Qatar, South Africa, Rest of Middle East & Africa), Latin America (Brazil, Argentina, Rest of Latin America)
Company Profiles Amphenol, Phoenix Contact, TE Connectivity, Stäubli (MC4), Weidmüller, LAPP Group, Molex, HUBER+SUHNER, Leader Solar, Renhe Solar and others 

Frequently Asked Questions

Ans:  The Photovoltaic Solar Connectors Market is expected to grow at a CAGR of 14.22% during 2025-2032.

Ans: Photovoltaic Solar Connectors Market size was valued at USD 849.26 Million in 2024 and is projected to reach USD 2459.16 Million by 2032

Ans: Rising solar energy adoption, government incentives, and the need for efficient, reliable power transmission in solar installations.

Ans: The “14 AWG” segment dominated the Photovoltaic Solar Connectors Market.

Ans: Asia-Pacific dominated the Photovoltaic Solar Connectors Market in 2024.

Table of Contents

1. Introduction

1.1 Market Definition

1.2 Scope (Inclusion and Exclusions)

1.3 Research Assumptions

2. Executive Summary

2.1 Market Overview

2.2 Regional Synopsis

2.3 Competitive Summary

3. Research Methodology

3.1 Top-Down Approach

3.2 Bottom-up Approach

3.3. Data Validation

3.4 Primary Interviews

4. Market Dynamics Impact Analysis

4.1 Market Driving Factors Analysis

4.1.1 Drivers

4.1.2 Restraints

4.1.3 Opportunities

4.1.4 Challenges

4.2 PESTLE Analysis

4.3 Porter’s Five Forces Model

5. Statistical Insights and Trends Reporting

5.1 Manufacturing & Supply Chain Insights

5.2 Sustainability & Compliance

5.3 Regulatory & Sustainability Metrics

5.4 Integration & Ecosystem Compatibility

6. Competitive Landscape

6.1 List of Major Companies, By Region

6.2 Market Share Analysis, By Region

6.3 Product Benchmarking

6.3.1 Product specifications and features

6.3.2 Pricing

6.4 Strategic Initiatives

6.4.1 Marketing and promotional activities

6.4.2 Distribution and Supply Chain Strategies

6.4.3 Expansion plans and new Product launches

6.4.4 Strategic partnerships and collaborations

6.5 Technological Advancements

6.6 Market Positioning and Branding

7. Photovoltaic Solar Connectors Market Segmentation By Service Type

7.1 Chapter Overview

7.2 14 AWG

7.2.1 14 AWG Market Trends Analysis (2021-2032)

7.2.2 14 AWG Market Size Estimates and Forecasts to 2032 (USD Million)

7.3 12 AWG

     7.3.1 12 AWG Market Trends Analysis (2021-2032)

           7.3.2 12 AWG Market Size Estimates and Forecasts to 2032 (USD Million)

7.4 10 AWG

     7.4.1 10 AWG Market Trends Analysis (2021-2032)

           7.4.2 10 AWG Market Size Estimates and Forecasts to 2032 (USD Million)

7.5 8 AWG

     7.5.1 8 AWG Market Trends Analysis (2021-2032)

           7.5.2 8 AWG Market Size Estimates and Forecasts to 2032 (USD Million)

8. Photovoltaic Solar Connectors Market Segmentation By Enterprise Size

8.1 Chapter Overview

8.2 Industrial

     8.2.1 Industrial Market Trend Analysis (2021-2032)

           8.2.2 Industrial Market Size Estimates and Forecasts to 2032 (USD Million)

8.3 Residential

      8.3.1 Residential Market Trends Analysis (2021-2032)

           8.3.2 Residential Market Size Estimates and Forecasts to 2032 (USD Million)

8.4 Commercial

      8.4.1 Commercial Market Trends Analysis (2021-2032)

           8.4.2 Commercial Market Size Estimates and Forecasts to 2032 (USD Million)

8.5 Others

      8.5.1 Others Market Trends Analysis (2021-2032)

           8.5.2 Others Market Size Estimates and Forecasts to 2032 (USD Million)

9. Photovoltaic Solar Connectors Market Segmentation By End User

9.1 Chapter Overview

9.2 Solar Power Plants

        9.2.1 Solar Power Plants Market Trends Analysis (2021-2032)

9.2.2 Solar Power Plants Market Size Estimates and Forecasts to 2032 (USD Million)

9.3 Rooftop Solar Installations

        9.3.1 Rooftop Solar Installations Market Trends Analysis (2021-2032)

9.3.2 Rooftop Solar Installations Market Size Estimates and Forecasts to 2032 (USD Million)

9.4 Others

        9.4.1 Others Market Trends Analysis (2021-2032)

9.4.2 Others Market Size Estimates and Forecasts to 2032 (USD Million)

10. Regional Analysis

10.1 Chapter Overview

10.2 North America

10.2.1 Trends Analysis

10.2.2 North America Photovoltaic Solar Connectors Market Estimates and Forecasts, by Country (2021-2032) (USD Million)

10.2.3 North America Photovoltaic Solar Connectors Market Estimates and Forecasts, By Service Type (2021-2032) (USD Million) 

10.2.4 North America Photovoltaic Solar Connectors Market Estimates and Forecasts, By Enterprise Size (2021-2032) (USD Million)

10.2.5 North America Photovoltaic Solar Connectors Market Estimates and Forecasts, By End User (2021-2032) (USD Million)

10.2.6 USA

10.2.6.1 USA Photovoltaic Solar Connectors Market Estimates and Forecasts, By Service Type (2021-2032) (USD Million)

10.2.6.2 USA Photovoltaic Solar Connectors Market Estimates and Forecasts, By Enterprise Size (2021-2032) (USD Million)

10.2.6.3 USA Photovoltaic Solar Connectors Market Estimates and Forecasts, By End User (2021-2032) (USD Million)

10.2.7 Canada

10.2.7.1 Canada Photovoltaic Solar Connectors Market Estimates and Forecasts, By Service Type (2021-2032) (USD Million)

10.2.7.2 Canada Photovoltaic Solar Connectors Market Estimates and Forecasts, By Enterprise Size (2021-2032) (USD Million)

10.2.7.3 Canada Photovoltaic Solar Connectors Market Estimates and Forecasts, By End User (2021-2032) (USD Million)

10.2.8 Mexico

10.2.8.1 Mexico Photovoltaic Solar Connectors Market Estimates and Forecasts, By Service Type (2021-2032) (USD Million)

10.2.8.2 Mexico Photovoltaic Solar Connectors Market Estimates and Forecasts, By Enterprise Size (2021-2032) (USD Million)

10.2.8.3 Mexico Photovoltaic Solar Connectors Market Estimates and Forecasts, By End User (2021-2032) (USD Million)

10.3 Europe

10.3.1 Trends Analysis

10.3.2 Europe Photovoltaic Solar Connectors Market Estimates and Forecasts, by Country (2021-2032) (USD Million)

10.3.3 Europe Photovoltaic Solar Connectors Market Estimates and Forecasts, By Service Type (2021-2032) (USD Million) 

10.3.4 Europe Photovoltaic Solar Connectors Market Estimates and Forecasts, By Enterprise Size (2021-2032) (USD Million)

10.3.5 Europe Photovoltaic Solar Connectors Market Estimates and Forecasts, By End User(2021-2032) (USD Million)

10.3.6 Germany

10.3.1.6.1 Germany Photovoltaic Solar Connectors Market Estimates and Forecasts, By Service Type (2021-2032) (USD Million)

10.3.1.6.2 Germany Photovoltaic Solar Connectors Market Estimates and Forecasts, By Enterprise Size (2021-2032) (USD Million)

10.3.1.6.3 Germany Photovoltaic Solar Connectors Market Estimates and Forecasts, By End User (2021-2032) (USD Million)

10.3.7 France

10.3.7.1 France Photovoltaic Solar Connectors Market Estimates and Forecasts, By Service Type (2021-2032) (USD Million)

10.3.7.2 France a Photovoltaic Solar Connectors Market Estimates and Forecasts, By Enterprise Size (2021-2032) (USD Million)

10.3.7.3 France Photovoltaic Solar Connectors Market Estimates and Forecasts, By End User (2021-2032) (USD Million)

10.3.8 UK

10.3.8.1 UK Photovoltaic Solar Connectors Market Estimates and Forecasts, By Service Type (2021-2032) (USD Million)

10.3.8.2 UK Photovoltaic Solar Connectors Market Estimates and Forecasts, By Enterprise Size (2021-2032) (USD Million)

10.3.8.3 UK Photovoltaic Solar Connectors Market Estimates and Forecasts, By End User (2021-2032) (USD Million)

10.3.9 Italy

10.3.9.1 Italy Photovoltaic Solar Connectors Market Estimates and Forecasts, By Service Type (2021-2032) (USD Million)

10.3.9.2 Italy Photovoltaic Solar Connectors Market Estimates and Forecasts, By Enterprise Size (2021-2032) (USD Million)

10.3.9.3 Italy Photovoltaic Solar Connectors Market Estimates and Forecasts, By End User (2021-2032) (USD Million)

10.3.10 Spain

10.3.10.1 Spain Photovoltaic Solar Connectors Market Estimates and Forecasts, By Service Type (2021-2032) (USD Million)

10.3.10.2 Spain Photovoltaic Solar Connectors Market Estimates and Forecasts, By Enterprise Size (2021-2032) (USD Million)

10.3.10.3 Spain Photovoltaic Solar Connectors Market Estimates and Forecasts, By End User (2021-2032) (USD Million)

10.3.12 Poland

10.3.12.1 Poland Photovoltaic Solar Connectors Market Estimates and Forecasts, by Country (2021-2032) (USD Million)

10.3.12.1 Poland Photovoltaic Solar Connectors Market Estimates and Forecasts, By Service Type (2021-2032) (USD Million) 

10.3.12.3 Poland Photovoltaic Solar Connectors Market Estimates and Forecasts, By Enterprise Size (2021-2032) (USD Million)

10.3.12.3 Poland Photovoltaic Solar Connectors Market Estimates and Forecasts, By End User (2021-2032) (USD Million)

10.3.13 Turkey

10.3.13.1 Turkey Photovoltaic Solar Connectors Market Estimates and Forecasts, By Service Type (2021-2032) (USD Million)

10.3.13.2 Turkey Photovoltaic Solar Connectors Market Estimates and Forecasts, By Enterprise Size (2021-2032) (USD Million)

10.3.13.3 Turkey Photovoltaic Solar Connectors Market Estimates and Forecasts, By End User (2021-2032) (USD Million)

10.3.14 Rest of Europe

10.3.14.1 Rest of Europe Photovoltaic Solar Connectors Market Estimates and Forecasts, By Service Type (2021-2032) (USD Million)

10.3.14.2 Rest of Europe Photovoltaic Solar Connectors Market Estimates and Forecasts, By Enterprise Size (2021-2032) (USD Million)

10.3.14.3 Rest of Europe Photovoltaic Solar Connectors Market Estimates and Forecasts, By End User(2021-2032) (USD Million)

10.4 Asia-Pacific

10.4.1 Trends Analysis

  10.4.2 Asia-Pacific Photovoltaic Solar Connectors Market Estimates and Forecasts, by Country (2021-2032) (USD Million)

 10.4.3 Asia-Pacific Photovoltaic Solar Connectors Market Estimates and Forecasts, By Service Type (2021-2032) (USD Million) 

 10.4.4 Asia-Pacific Photovoltaic Solar Connectors Market Estimates and Forecasts, By Enterprise Size (2021-2032) (USD Million)

 10.4.5 Asia-Pacific Photovoltaic Solar Connectors Market Estimates and Forecasts, By End User (2021-2032) (USD Million)

10.4.6 China

10.4.6.1 China Photovoltaic Solar Connectors Market Estimates and Forecasts, By Service Type (2021-2032) (USD Million)

10.4.6.2 China Photovoltaic Solar Connectors Market Estimates and Forecasts, By Enterprise Size (2021-2032) (USD Million)

10.4.6.3 China Photovoltaic Solar Connectors Market Estimates and Forecasts, By End User (2021-2032) (USD Million)

10.4.7 India

10.4.7.1 India Photovoltaic Solar Connectors Market Estimates and Forecasts, By Service Type (2021-2032) (USD Million)

10.4.7.2 India Photovoltaic Solar Connectors Market Estimates and Forecasts, By Enterprise Size (2021-2032) (USD Million)

10.4.7.3 India Photovoltaic Solar Connectors Market Estimates and Forecasts, By End User (2021-2032) (USD Million)

10.4.8 Japan

10.4.8.1 Japan Photovoltaic Solar Connectors Market Estimates and Forecasts, By Service Type (2021-2032) (USD Million)

10.4.8.2 Japan Photovoltaic Solar Connectors Market Estimates and Forecasts, By Enterprise Size (2021-2032) (USD Million)

10.4.8.3 Japan Photovoltaic Solar Connectors Market Estimates and Forecasts, By End User (2021-2032) (USD Million)

10.4.9 South Korea

10.4.9.1 South Korea Photovoltaic Solar Connectors Market Estimates and Forecasts, By Service Type (2021-2032) (USD Million)

10.4.9.2 South Korea Photovoltaic Solar Connectors Market Estimates and Forecasts, By Enterprise Size (2021-2032) (USD Million)

10.4.9.3 South Korea Photovoltaic Solar Connectors Market Estimates and Forecasts, By End User (2021-2032) (USD Million)

10.4.10 Singapore

10.4.10.1 Singapore Photovoltaic Solar Connectors Market Estimates and Forecasts, By Service Type (2021-2032) (USD Million)

10.4.10.2 Singapore Photovoltaic Solar Connectors Market Estimates and Forecasts, By Enterprise Size (2021-2032) (USD Million)

10.4.10.3 Singapore Photovoltaic Solar Connectors Market Estimates and Forecasts, By End User (2021-2032) (USD Million)

10.4.11 Australia

10.4.11.1 Australia Photovoltaic Solar Connectors Market Estimates and Forecasts, By Service Type (2021-2032) (USD Million)

10.4.11.2 Australia Photovoltaic Solar Connectors Market Estimates and Forecasts, By Enterprise Size (2021-2032) (USD Million)

10.4.11.3 Australia Photovoltaic Solar Connectors Market Estimates and Forecasts, By End User (2021-2032) (USD Million)

10.4.12 Taiwan

10.4.12.1 Taiwan Photovoltaic Solar Connectors Market Estimates and Forecasts, By Service Type (2021-2032) (USD Million)

10.4.12.2 Taiwan Photovoltaic Solar Connectors Market Estimates and Forecasts, By Enterprise Size (2021-2032) (USD Million)

10.4.12.3 Taiwan Photovoltaic Solar Connectors Market Estimates and Forecasts, By End User (2021-2032) (USD Million)


10.4.13Rest of Asia-Pacific

10.4.13.1 Rest of Asia-Pacific Photovoltaic Solar Connectors Market Estimates and Forecasts, By Service Type (2021-2032) (USD Million)

10.4.13.2 Rest of Asia-Pacific Photovoltaic Solar Connectors Market Estimates and Forecasts, By Enterprise Size (2021-2032) (USD Million)

10.4.13.3 Rest of Asia-Pacific Photovoltaic Solar Connectors Market Estimates and Forecasts, By End User (2021-2032) (USD Million)

10.5 Middle East and Africa

10.5.1 Trends Analysis

10.5.2 Middle East and Africa East Photovoltaic Solar Connectors Market Estimates and Forecasts, by Country (2021-2032) (USD Million)

10.5.3Middle East and Africa Photovoltaic Solar Connectors Market Estimates and Forecasts, By Service Type (2021-2032) (USD Million) 

10.5.4 Middle East and Africa Photovoltaic Solar Connectors Market Estimates and Forecasts, By Enterprise Size (2021-2032) (USD Million)

10.5.5 Middle East and Africa Photovoltaic Solar Connectors Market Estimates and Forecasts, By End User (2021-2032) (USD Million)

10.5.6 UAE

10.5.6.1 UAE Photovoltaic Solar Connectors Market Estimates and Forecasts, By Service Type (2021-2032) (USD Million)

10.5.6.2 UAE Photovoltaic Solar Connectors Market Estimates and Forecasts, By Enterprise Size (2021-2032) (USD Million)

10.5.6.3 UAE Photovoltaic Solar Connectors Market Estimates and Forecasts, By End User (2021-2032) (USD Million)

10.5.7 Saudi Arabia

10.5.7.1 Saudi Arabia Photovoltaic Solar Connectors Market Estimates and Forecasts, By Service Type (2021-2032) (USD Million)

10.5.7.2 Saudi Arabia Photovoltaic Solar Connectors Market Estimates and Forecasts, By Enterprise Size (2021-2032) (USD Million)

10.5.7.3 Saudi Arabia Photovoltaic Solar Connectors Market Estimates and Forecasts, By End User (2021-2032) (USD Million)

10.5.8 Qatar

10.5.8.1 Qatar Photovoltaic Solar Connectors Market Estimates and Forecasts, By Service Type (2021-2032) (USD Million)

10.5.8.2 Qatar Photovoltaic Solar Connectors Market Estimates and Forecasts, By Enterprise Size (2021-2032) (USD Million)

10.5.8.3 Qatar Photovoltaic Solar Connectors Market Estimates and Forecasts, By End User (2021-2032) (USD Million)

10.5.9 South Africa

10.5.9 1 South Africa Photovoltaic Solar Connectors Market Estimates and Forecasts, By Service Type (2021-2032) (USD Million)

10.5.9 2 South Africa Photovoltaic Solar Connectors Market Estimates and Forecasts By Enterprise Size (2021-2032) (USD Million)

10.5.9 3 South Africa Photovoltaic Solar Connectors Market Estimates and Forecasts, By End User (2021-2032) (USD Million)

10.5.10 Rest of Middle East & Africa

10.5.10.1 Rest of Middle East & Africa Photovoltaic Solar Connectors Market Estimates and Forecasts, By Service Type (2021-2032) (USD Million)

10.5.10.2 Rest of Middle East & Africa Photovoltaic Solar Connectors Market Estimates and Forecasts, By Enterprise Size (2021-2032) (USD Million)

10.5.10.3 Rest of Middle East & Africa Photovoltaic Solar Connectors Market Estimates and Forecasts, By End User (2021-2032) (USD Million)

10.6 Latin America

10.6.1 Trends Analysis

10.6.2 Latin America Photovoltaic Solar Connectors Market Estimates and Forecasts, by Country (2021-2032) (USD Million)

10.6.3 Latin America Photovoltaic Solar Connectors Market Estimates and Forecasts, By Service Type (2021-2032) (USD Million) 

10.6.4 Latin America Photovoltaic Solar Connectors Market Estimates and Forecasts, By Enterprise Size (2021-2032) (USD Million)

10.6.5 Latin America Photovoltaic Solar Connectors Market Estimates and Forecasts, By End User (2021-2032) (USD Million)

10.6.6 Brazil

10.6.6.1 Brazil Photovoltaic Solar Connectors Market Estimates and Forecasts, By Service Type (2021-2032) (USD Million)

10.6.6.2 Brazil Photovoltaic Solar Connectors Market Estimates and Forecasts, By Enterprise Size (2021-2032) (USD Million)

10.6.6.3 Brazil Photovoltaic Solar Connectors Market Estimates and Forecasts, By End User (2021-2032) (USD Million)

10.6.7 Argentina

10.6.7.1 Argentina Photovoltaic Solar Connectors Market Estimates and Forecasts, By Service Type (2021-2032) (USD Million)

10.6.7.2 Argentina Photovoltaic Solar Connectors Market Estimates and Forecasts, By Enterprise Size (2021-2032) (USD Million)

10.6.7.3 Argentina Photovoltaic Solar Connectors Market Estimates and Forecasts, By End User (2021-2032) (USD Million)

10.6.8 Rest of Latin America

10.6.8.1 Rest of Latin America Photovoltaic Solar Connectors Market Estimates and Forecasts, By Service Type (2021-2032) (USD Million)

10.6.8.2 Rest of Latin America Photovoltaic Solar Connectors Market Estimates and Forecasts, By Enterprise Size (2021-2032) (USD Million)

10.6.8.3 Rest of Latin America Photovoltaic Solar Connectors Market Estimates and Forecasts, By End User (2021-2032) (USD Million)

12. Company Profiles

12.1 Amphenol

          12.1.1 Company Overview

12.1.2 Financial

12.1.3 Products/ Services Offered

12.1.4 SWOT Analysis

12.2 Phoenix Contact

           12.2.1 Company Overview

12.2.2 Financial

12.2.3 Products/ Services Offered

12.2.4 SWOT Analysis

12.3 TE Connectivity

          12.3.1 Company Overview

12.3.2 Financial

12.3.3 Products/ Services Offered

12.3.4 SWOT Analysis

12.4 Stäubli (MC4)

          12.4.1 Company Overview

12.4.2 Financial

12.4.3 Products/ Services Offered

12.4.4 SWOT Analysis

12.5 Weidmüller

          12.5.1 Company Overview

12.5.2 Financial

12.5.3 Products/ Services Offered

12.5.4 SWOT Analysis

12.6 LAPP Group

            12.6.1 Company Overview

12.6.2 Financial

12.6.3 Products/ Services Offered

12.6.4 SWOT Analysis

12.7 Molex

          12.7.1 Company Overview

12.7.2 Financial

12.7.3 Products/ Services Offered

12.7.4 SWOT Analysis

12.8 HUBER+SUHNER

12.8.1 Company Overview

12.8.2 Financial

12.8.3 Products/ Services Offered

12.8.4 SWOT Analysis

12.9 Leader Solar

12.9.1 Company Overview

12.9.2 Financial

12.9.3 Products/ Services Offered

12.9.4 SWOT Analysis

12.10 Renhe Solar

12.10.1 Company Overview

12.10.2 Financial

12.10.3 Products/ Services Offered

12.10.4 SWOT Analysis

12. Use Cases and Best Practices

13. Conclusion

An accurate research report requires proper strategizing as well as implementation. There are multiple factors involved in the completion of good and accurate research report and selecting the best methodology to compete the research is the toughest part. Since the research reports we provide play a crucial role in any company’s decision-making process, therefore we at SNS Insider always believe that we should choose the best method which gives us results closer to reality. This allows us to reach at a stage wherein we can provide our clients best and accurate investment to output ratio.

Each report that we prepare takes a timeframe of 350-400 business hours for production. Starting from the selection of titles through a couple of in-depth brain storming session to the final QC process before uploading our titles on our website we dedicate around 350 working hours. The titles are selected based on their current market cap and the foreseen CAGR and growth.


The 5 steps process:

Step 1: Secondary Research:

Secondary Research or Desk Research is as the name suggests is a research process wherein, we collect data through the readily available information. In this process we use various paid and unpaid databases which our team has access to and gather data through the same. This includes examining of listed companies’ annual reports, Journals, SEC filling etc. Apart from this our team has access to various associations across the globe across different industries. Lastly, we have exchange relationships with various university as well as individual libraries.

Secondary Research

Step 2: Primary Research

When we talk about primary research, it is a type of study in which the researchers collect relevant data samples directly, rather than relying on previously collected data.  This type of research is focused on gaining content specific facts that can be sued to solve specific problems. Since the collected data is fresh and first hand therefore it makes the study more accurate and genuine.

We at SNS Insider have divided Primary Research into 2 parts.

Part 1 wherein we interview the KOLs of major players as well as the upcoming ones across various geographic regions. This allows us to have their view over the market scenario and acts as an important tool to come closer to the accurate market numbers. As many as 45 paid and unpaid primary interviews are taken from both the demand and supply side of the industry to make sure we land at an accurate judgement and analysis of the market.

This step involves the triangulation of data wherein our team analyses the interview transcripts, online survey responses and observation of on filed participants. The below mentioned chart should give a better understanding of the part 1 of the primary interview.

Primary Research

Part 2: In this part of primary research the data collected via secondary research and the part 1 of the primary research is validated with the interviews from individual consultants and subject matter experts.

Consultants are those set of people who have at least 12 years of experience and expertise within the industry whereas Subject Matter Experts are those with at least 15 years of experience behind their back within the same space. The data with the help of two main processes i.e., FGDs (Focused Group Discussions) and IDs (Individual Discussions). This gives us a 3rd party nonbiased primary view of the market scenario making it a more dependable one while collation of the data pointers.

Step 3: Data Bank Validation

Once all the information is collected via primary and secondary sources, we run that information for data validation. At our intelligence centre our research heads track a lot of information related to the market which includes the quarterly reports, the daily stock prices, and other relevant information. Our data bank server gets updated every fortnight and that is how the information which we collected using our primary and secondary information is revalidated in real time.

Data Bank Validation

Step 4: QA/QC Process

After all the data collection and validation our team does a final level of quality check and quality assurance to get rid of any unwanted or undesired mistakes. This might include but not limited to getting rid of the any typos, duplication of numbers or missing of any important information. The people involved in this process include technical content writers, research heads and graphics people. Once this process is completed the title gets uploader on our platform for our clients to read it.

Step 5: Final QC/QA Process:

This is the last process and comes when the client has ordered the study. In this process a final QA/QC is done before the study is emailed to the client. Since we believe in giving our clients a good experience of our research studies, therefore, to make sure that we do not lack at our end in any way humanly possible we do a final round of quality check and then dispatch the study to the client.

Key Segments:

By Type

  • 14 AWG

  • 12 AWG

  • 10 AWG

  • 8 AWG

By Application

  • Industrial

  • Residential

  • Commercial

  • Others

By End User

  • Solar Power Plants

  • Rooftop Solar Installations

  • Others


Request for Segment Customization as per your Business Requirement: Segment Customization Request

Regional Coverage: 

North America

  • US

  • Canada

  • Mexico

Europe

  • Germany

  • France

  • UK

  • Italy

  • Spain

  • Poland

  • Turkey

  • Rest of Europe

Asia Pacific

  • China

  • India

  • Japan

  • South Korea

  • Singapore

  • Australia

  • Taiwan

  • Rest of Asia Pacific

Middle East & Africa

  • UAE

  • Saudi Arabia

  • Qatar

  • South Africa

  • Rest of Middle East & Africa

Latin America

  • Brazil

  • Argentina

  • Rest of Latin America

Request for Country Level Research Report: Country Level Customization Request

Available Customization 

With the given market data, SNS Insider offers customization as per the company’s specific needs. The following customization options are available for the report: 

  • Detailed Volume Analysis 

  • Criss-Cross segment analysis (e.g. Product X Application) 

  • Competitive Product Benchmarking 

  • Geographic Analysis 

  • Additional countries in any of the regions 

  • Customized Data Representation 

  • Detailed analysis and profiling of additional market players


Explore Key Insights 


  • Analyzes market trends, forecasts, and regional dynamics
  • Covers core offerings, innovations, and industry use cases
  • Profiles major players, value chains, and strategic developments
  • Highlights innovation trends, regulatory impacts, and growth opportunities
Request an Analyst Call