image

Smart Connected Assets and Operations Market Report Scope & Overview:

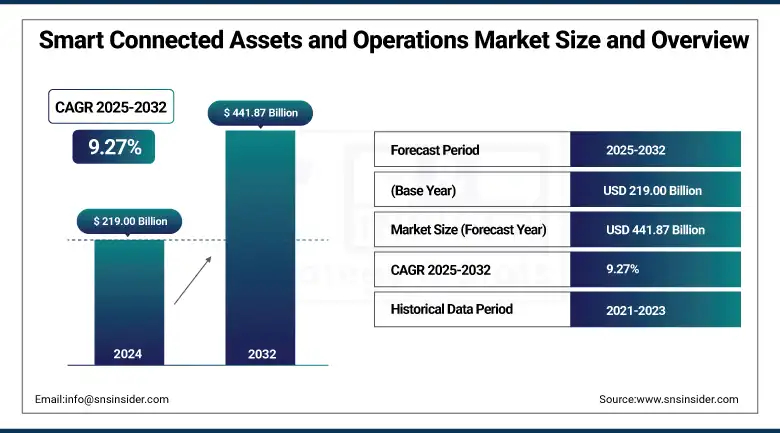
Smart Connected Assets and Operations Market was valued at USD 219.00 billion in 2024 and is expected to reach USD 441.87 billion by 2032, growing at a CAGR of 9.27% from 2025-2032. 

The Smart Connected Assets and Operations Market is growing as a result of the increasing adoption of IoT technology, the increasing demand for real-time asset monitoring; increased operational efficiency, and predictive maintenance. The digital transformation taking place in diverse industries and the inherent need for diminished downtime and reduced operational costs are also fueling the market.

Implementing predictive maintenance can lead to up to 12% savings over scheduled repairs, reduce maintenance costs by 30%, and eliminate breakdowns by 70%.

Industrial Internet of Things (IIoT) technologies have helped industrial companies reduce downtime by up to 20% and maintenance costs by around 25-30% through predictive maintenance and real-time monitoring.

Furthermore, Siemens reports that IoT-based asset management can improve operational efficiency by up to 30% and reduce unplanned downtime by up to 50% in manufacturing plants using their MindSphere IoT platform.

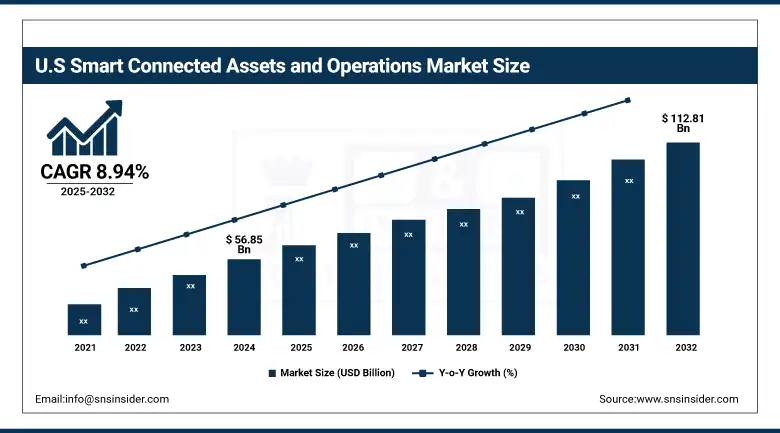
U.S. Smart Connected Assets and Operations Market was valued at USD 56.85 billion in 2024 and is expected to reach USD 112.81 billion by 2032, growing at a CAGR of 8.94% from 2025-2032. 

The factors driving U.S. market growth include widespread adoption of IoT, increased investment in smart infrastructure, rising demand for asset management in real-time, and a focus on improving operational efficiency and reducing maintenance costs within the manufacturing, logistics, and energy industries.

The U.S. government has recognized the potential of IoT technologies, with the DIGIT Act emphasizing IoT's role in generating new economic activity across various sectors, including transportation, energy, agriculture, manufacturing, and healthcare.

Additionally, the U.S. Department of Transportation announced $54 million in grant awards for 34 projects across 22 states, focusing on advanced smart community technologies to improve transportation efficiency and safety.

Market Dynamics

Drivers

  • Widespread adoption of IoT and AI technologies in industrial ecosystems boosts demand for smart connected assets and operations platforms.

IoT and AI are changing industrial asset management by using smart sensors and predictive analytics, along with real-time monitoring, in order to minimize downtime and better productivity in operations and logistics. IoT and AI allow for cloud computing as well as edge intelligence to increase connectivity and automation to support smart predictions and real-time decision-making. With these technologies to optimize resource utilization, businesses can future-proof their operations and reduce costs. As a result, there is an accelerating demand for smart connected assets across industries.

According to the U.S. Department of Energy, implementing predictive maintenance can deliver a 35% to 45% reduction in equipment downtime, highlighting the substantial impact of these technologies on operational efficiency.

Siemens' MindSphere platform leverages AI and IoT to optimize maintenance efficiency, enabling companies to transform data into productive business insights and reduce unplanned downtime.

Meanwhile, GE Vernova’s Asset Performance Management (APM) software has shown measurable outcomes, with customers like Navigator achieving 7.2% cost savings in just 90 days and projecting a 12.8% annual reduction in maintenance costs.

Restraints

  • Data security risks and concerns about system vulnerabilities limit confidence in adopting connected assets and operations platforms at scale.

The growing use of connected devices and cloud systems increases the cyber threat surface area, creating concerns about unauthorized access, breaches of data, and manipulation of systems. This is particularly concerning in the energy, manufacturing, and transport sectors as disruptions can have serious implications. Compliance with data protection and security requires significant investments. Organizations are hesitant to routinely adopt smart connected technologies without firm, guaranteed protections in place as cyber threats continue to evolve.

In 2024, ransomware remained the most significant cyber threat to U.S. critical infrastructure, with complaints to the FBI's Internet Crime Complaint Center (IC3) increasing by 9% from 2023. The IC3 also received 859,532 cybercrime complaints in the same year, with reported losses surpassing USD 16.6 billion marking a 33% rise over the previous year.

Further amplifying concern, a whitepaper by Palo Alto Networks and Siemens revealed that approximately 62% of exploit triggers in operational technology (OT) networks stemmed from vulnerabilities that were 6 to 10 years old, underscoring the dangers posed by aging systems in industrial environments.

Opportunities

  • Expanding role of edge computing and 5G connectivity unlocks new capabilities for real-time monitoring and responsive asset management.

With the combination of edge computing and 5G networks, ultra-low latency, faster data processing, and scalable connectivity options are now available to smart systems. This will allow for near-real-time insight and responsiveness for critical assets in autonomous transport, oil and gas, smart utilities, etc. 5G can accommodate even more devices with the same performance by allowing connections from each device that use low, and potentially, no latency. This has significantly transformed the market for hyper-connected devices enabling vendors, integrators, and industries, to all see growth opportunities in hyper-connected freedom and intelligence.

According to Intel, 67% of manufacturers cited improving employee productivity as the top motivating factor for adopting edge AI, with nearly half aiming to reduce operational costs. For instance, at Audi's Neckarsulm plant in Germany, edge computing enhanced weld inspections by 100 times with a latency of 18 milliseconds, and reduced labor costs by 30% to 50%.

Challenges

  • Lack of standardization across platforms and protocols impedes seamless integration and slows progress toward fully interoperable smart operations.

Despite rapid progress, the smart connected assets remain fragmented with competing platforms, protocols, and data standards. This lack of uniformity creates major integration challenges, particularly for companies with diverse or global assets, hindering data consolidation, workflow automation, and scalability. Without universal frameworks, implementation costs rise, and dependence on vendor-specific solutions limits flexibility and upgrades. Until industry-wide standards are established, achieving interoperable, scalable connected operations will continue to be a costly, persistent challenge.

Segment Analysis

By Industry

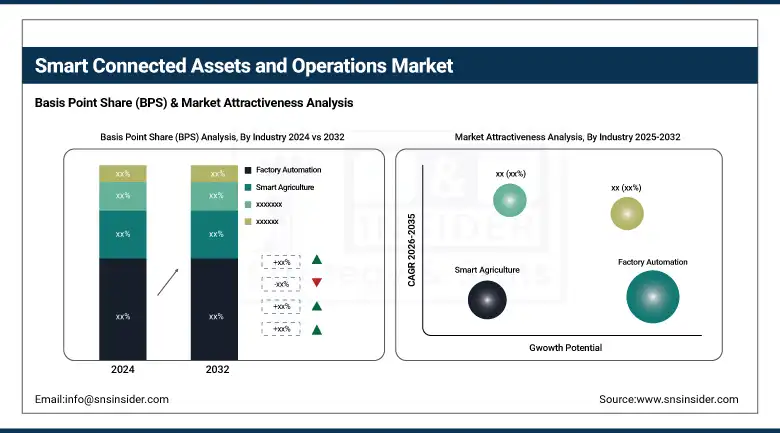
Factory automation led the Smart Connected Assets and Operations Market in 2024 with a 31% revenue share because of widespread implementations of industrial IoT, robotics, and real-time monitoring solutions, contributing to operational efficiency, reducing unproductive downtime, and proactive maintenance - all must-haves in manufacturing. The demand for ultra-flexible, automated, and scalable production environments has led to high factory automation solution adoption rates.

Smart agriculture is projected to grow at the fastest CAGR of 11.53% from 2025 to 2032, with food demand rising globally, shortages of labor, and advancements pushing for sustainable farming practices. The integration of IoT devices, drones, and analytics provides increased yield forecast accuracy, soil monitoring, and resource optimization, making connected devices more critical in modernizing agricultural activities and improving food productivity overall.

By Module

The hardware segment held the largest revenue share of 46% in 2024, primarily due to the extensive use of sensors, controllers, and edge devices that are crucial for enabling connected operations. These physical components are the backbone of smart infrastructure, allowing for real-time data collection and asset management, which are essential for driving IoT-based automation across various industries.

The APM (Asset Performance Management) software and platform segment is expected to grow at a CAGR of 10.57% from 2025 to 2032, driven by an increasing need for predictive analytics, maintenance optimization, and operational insights. These platforms empower businesses to minimize equipment failures, prolong asset lifespan, and enhance overall efficiency through data-driven decision-making, making them more essential in today’s smart industrial ecosystems.

Regional Analysis

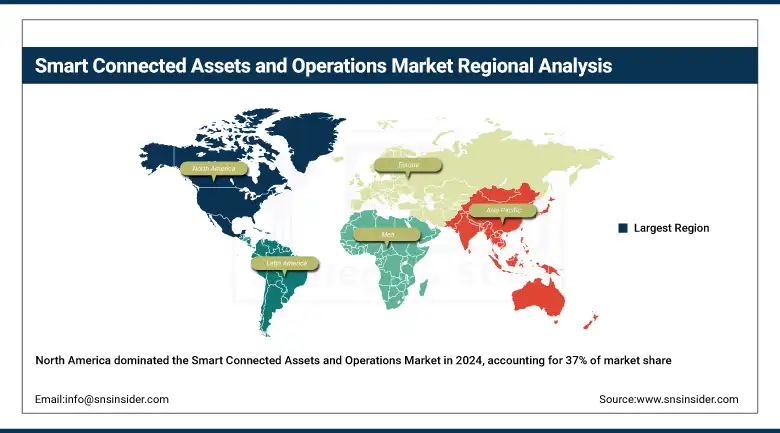
North America accounted for the highest revenue share of 37% in 2024, due to the early embrace of Industry 4.0 technologies, a solid digital infrastructure, and hefty investments in smart manufacturing and industrial IoT. The U.S. and Canada are at the forefront of automation efforts and research and development, backed by a well-established network of technology providers. This strong foundation cements the region's position as a leader in deploying connected assets and optimizing smart operations.

The U.S. dominated the Smart Connected Assets and Operations Market due to strong industrial digitization, advanced infrastructure, and early adoption of IoT technologies.

Asia Pacific is projected to grow at the fastest CAGR of 10.94% from 2025 to 2032, driven by swift industrialization, the rise of smart city projects, and increasing investments in digital transformation across countries. Government backing for automation, a growing need for operational efficiency, and the integration of IoT in manufacturing and agriculture are all contributing to the rapid expansion of smart connected assets and operations in this region.

China is dominating the Smart Connected Assets and Operations Market in Asia Pacific due to large-scale industrial automation, government support, and rapid IoT technology adoption.

Europe holds a significant position in the Smart Connected Assets and Operations Market, driven by strong regulatory support for digital transformation, widespread adoption of automation technologies, and growing investments in sustainable industrial practices across major economies like Germany and France.

Germany is dominating the Smart Connected Assets and Operations Market in Europe due to its advanced manufacturing sector, strong automation focus, and Industry 4.0 leadership.

In the Smart Connected Assets and Operations Market, the Middle East & Africa and Latin America are experiencing steady growth driven by infrastructure modernization, smart city initiatives, and increasing investments in automation across energy, mining, and manufacturing sectors.

Key Players

IBM Corporation, General Electric (GE), Siemens AG, Schneider Electric, Rockwell Automation, Inc., Honeywell International Inc., ABB Ltd., Cisco Systems, Inc., PTC Inc., SAP SE and others.

Recent Developments:

  • In June 2024, Honeywell launched Connected Power, enabling buildings to monitor and control plug-level energy usage, reducing waste and enhancing safety.          

  • In January 2024, Honeywell and NXP Semiconductors announced a collaboration to integrate AI-enabled processors into building management systems, enhancing energy efficiency and autonomy.

  • In 2024, SAP expanded Joule's capabilities with collaborative AI agents, automating complex business workflows and enhancing productivity across financial and dispute management tasks.

Smart Connected Assets and Operations Market Report Scope:

Report Attributes Details
Market Size in 2024 USD 219.00 Billion 
Market Size by 2032 USD 441.87 Billion 
CAGR CAGR of 9.27% From 2025 to 2032
Base Year 2024
Forecast Period 2025-2032
Historical Data 2021-2023
Report Scope & Coverage Market Size, Segments Analysis, Competitive Landscape, Regional Analysis, DROC & SWOT Analysis, Forecast Outlook
Key Segments • By Module(Hardware, APM software & platform, Service)
• By Industry(Automotive & Transportation, Energy & Power, Healthcare, Smart Agriculture, Factory Automation, Others)
Regional Analysis/Coverage North America (US, Canada, Mexico), Europe (Germany, France, UK, Italy, Spain, Poland, Turkey, Rest of Europe), Asia Pacific (China, India, Japan, South Korea, Singapore, Australia, Rest of Asia Pacific), Middle East & Africa (UAE, Saudi Arabia, Qatar, South Africa, Rest of Middle East & Africa), Latin America (Brazil, Argentina, Rest of Latin America)
Company Profiles IBM Corporation, General Electric (GE), Siemens AG, Schneider Electric, Rockwell Automation, Inc., Honeywell International Inc., ABB Ltd., Cisco Systems, Inc., PTC Inc., SAP SE

Frequently Asked Questions

Ans: The market is projected to grow at a CAGR of 9.27% from 2025 to 2032, reaching USD 441.87 billion by 2032.

Ans: The market was valued at USD 219.00 billion in 2024, reflecting strong global momentum toward industrial digitization and automation.

Ans: Growth is driven by IoT adoption, real-time asset monitoring, predictive maintenance, and demand for operational efficiency across industrial sectors.

Ans: Factory automation led with a 31% revenue share in 2024 due to heavy integration of IoT, robotics, and predictive maintenance in manufacturing.

Ans: North America dominated with a 37% revenue share in 2024, driven by early Industry 4.0 adoption and strong digital infrastructure in the U.S. and Canada.

Table of Contents

1. Introduction

1.1 Market Definition

1.2 Scope (Inclusion and Exclusions)

1.3 Research Assumptions

2. Executive Summary

2.1 Market Overview        

2.2 Regional Synopsis

2.3 Competitive Summary

3. Research Methodology

3.1 Top-Down Approach

3.2 Bottom-up Approach

3.3. Data Validation

3.4 Primary Interviews

4. Market Dynamics Impact Analysis

4.1 Market Driving Factors Analysis

4.1.2 Drivers

4.1.2 Restraints

4.1.3 Opportunities

4.1.4 Challenges

4.2 PESTLE Analysis

4.3 Porter’s Five Forces Model

5. Statistical Insights and Trends Reporting

5.1 Cybersecurity Incident Rates

5.2 Latency and Response Time Metrics

5.3 Energy Consumption Reduction

5.4 AI/ML Model Training Frequency

5.5 Service/Subscription Growth

6. Competitive Landscape

6.1 List of Major Companies By Region

6.2 Market Share Analysis By Region

6.3 Product Benchmarking

6.3.1 Product specifications and features

6.3.2 Pricing

6.4 Strategic Initiatives

6.4.1 Marketing and promotional activities

6.4.2 Distribution and Supply Chain Strategies

6.4.3 Expansion Plans and New Product Launches

6.4.4 Strategic partnerships and collaborations

6.5 Technological Advancements

6.6 Market Positioning and Branding

7. Smart Connected Assets and Operations Market Segmentation By Module

7.1 Chapter Overview

7.2 Hardware

        7.2.1 Hardware Trend Analysis (2021-2032)

7.2.2 Hardware Market Size Estimates and Forecasts to 2032 (USD Billion)

7.3 APM software & platform

       7.3.1 APM software & platform Market Trends Analysis (2021-2032)

       7.3.2 APM software & platform Market Size Estimates and Forecasts to 2032 (USD Billion)

7.4 Service

       7.4.1 Service Market Trends Analysis (2021-2032)

       7.4.2 Service Market Size Estimates and Forecasts to 2032 (USD Billion)

8. Smart Connected Assets and Operations Market Segmentation By Industry

8.1 Chapter Overview

8.2 Automotive & Transportation

        8.2.1 Automotive & Transportation Market Trends Analysis (2021-2032)

8.2.2 Automotive & Transportation Market Size Estimates and Forecasts to 2032 (USD Billion)

8.3 Energy & Power

      8.3.1 Energy & Power Market Trends Analysis (2021-2032)

      8.3.2 Energy & Power Market Size Estimates and Forecasts to 2032 (USD Billion)

8.4 Healthcare

        8.4.1 Healthcare Market Trends Analysis (2021-2032)

8.4.2 Healthcare Market Size Estimates and Forecasts to 2032 (USD Billion)

8.5 Smart Agriculture

        8.5.1 Smart Agriculture Market Trends Analysis (2021-2032)

8.5.2 Smart Agriculture Market Size Estimates and Forecasts to 2032 (USD Billion)

8.6 Factory Automation

      8.6.1 Factory Automation Market Trends Analysis (2021-2032)

      8.6.2 Factory Automation Market Size Estimates and Forecasts to 2032 (USD Billion)

8.7 Others

        8.7.1 Others Market Trends Analysis (2021-2032)

8.7.2 Others Market Size Estimates and Forecasts to 2032 (USD Billion)

9. Regional Analysis

     9.1 Chapter Overview

     9.2 North America

9.2.1 Trends Analysis

9.2.2 North America Smart Connected Assets and Operations Market Estimates and Forecasts, by Country (2021-2032) (USD Billion)

9.2.3 North America Smart Connected Assets and Operations Market Estimates and Forecasts, By Module (2021-2032) (USD Billion) 

9.2.4 North America Smart Connected Assets and Operations Market Estimates and Forecasts, By Industry (2021-2032) (USD Billion)

9.2.5 USA

9.2.5.1 USA Smart Connected Assets and Operations Market Estimates and Forecasts, By Module (2021-2032) (USD Billion)

9.2.5.2 USA Smart Connected Assets and Operations Market Estimates and Forecasts, By Industry (2021-2032) (USD Billion)

9.2.6 Canada

9.2.6.1 Canada Smart Connected Assets and Operations Market Estimates and Forecasts, By Module (2021-2032) (USD Billion)

9.2.6.2 Canada Smart Connected Assets and Operations Market Estimates and Forecasts, By Industry (2021-2032) (USD Billion)

9.2.7 Mexico

9.2.7.1 Mexico Smart Connected Assets and Operations Market Estimates and Forecasts, By Module (2021-2032) (USD Billion)

9.2.7.2 Mexico Smart Connected Assets and Operations Market Estimates and Forecasts, By Industry (2021-2032) (USD Billion)

9.3 Europe

9.3.1 Trends Analysis

9.3.2 Europe Smart Connected Assets and Operations Market Estimates and Forecasts, by Country (2021-2032) (USD Billion)

9.3.3 Europe Smart Connected Assets and Operations Market Estimates and Forecasts, By Module (2021-2032) (USD Billion) 

9.3.4 Europe Smart Connected Assets and Operations Market Estimates and Forecasts, By Industry (2021-2032) (USD Billion)

9.3.5 Germany

9.3.5.1 Germany Smart Connected Assets and Operations Market Estimates and Forecasts, By Module (2021-2032) (USD Billion)

9.3.5.2 Germany Smart Connected Assets and Operations Market Estimates and Forecasts, By Industry (2021-2032) (USD Billion)

9.3.6 France

9.3.6.1 France Smart Connected Assets and Operations Market Estimates and Forecasts, By Module (2021-2032) (USD Billion)

9.3.6.2 France Smart Connected Assets and Operations Market Estimates and Forecasts, By Industry (2021-2032) (USD Billion)

9.3.7 UK

9.3.7.1 UK Smart Connected Assets and Operations Market Estimates and Forecasts, By Module (2021-2032) (USD Billion)

9.3.7.2 UK Smart Connected Assets and Operations Market Estimates and Forecasts, By Industry (2021-2032) (USD Billion)

9.3.8 Italy

9.3.8.1 Italy Smart Connected Assets and Operations Market Estimates and Forecasts, By Module (2021-2032) (USD Billion)

9.3.8.2 Italy Smart Connected Assets and Operations Market Estimates and Forecasts, By Industry (2021-2032) (USD Billion)

9.3.9 Spain

9.3.9.1 Spain Smart Connected Assets and Operations Market Estimates and Forecasts, By Module (2021-2032) (USD Billion)

9.3.9.2 Spain Smart Connected Assets and Operations Market Estimates and Forecasts, By Industry (2021-2032) (USD Billion)

9.3.10 Poland

9.3.10.1 Poland Smart Connected Assets and Operations Market Estimates and Forecasts, By Module (2021-2032) (USD Billion)

9.3.10.2 Poland Smart Connected Assets and Operations Market Estimates and Forecasts, By Industry (2021-2032) (USD Billion)

9.3.11 Turkey

9.3.11.1 Turkey Smart Connected Assets and Operations Market Estimates and Forecasts, By Module (2021-2032) (USD Billion)

9.3.11.2 Turkey Smart Connected Assets and Operations Market Estimates and Forecasts, By Industry (2021-2032) (USD Billion)

9.3.12 Rest of Europe

9.3.12.1 Rest of Europe Smart Connected Assets and Operations Market Estimates and Forecasts, By Module (2021-2032) (USD Billion)

9.3.12.2 Rest of Europe Smart Connected Assets and Operations Market Estimates and Forecasts, By Industry (2021-2032) (USD Billion)

9.4 Asia Pacific

9.4.1 Trends Analysis

9.4.2 Asia Pacific Smart Connected Assets and Operations Market Estimates and Forecasts, by Country (2021-2032) (USD Billion)

9.4.3 Asia Pacific Smart Connected Assets and Operations Market Estimates and Forecasts, By Module (2021-2032) (USD Billion) 

9.4.4 Asia Pacific Smart Connected Assets and Operations Market Estimates and Forecasts, By Industry (2021-2032) (USD Billion)

9.4.5 China

9.4.5.1 China Smart Connected Assets and Operations Market Estimates and Forecasts, By Module (2021-2032) (USD Billion)

9.4.5.2 China Smart Connected Assets and Operations Market Estimates and Forecasts, By Industry (2021-2032) (USD Billion)

9.4.6 India

9.4.5.1 India Smart Connected Assets and Operations Market Estimates and Forecasts, By Module (2021-2032) (USD Billion)

9.4.5.2 India Smart Connected Assets and Operations Market Estimates and Forecasts, By Industry (2021-2032) (USD Billion)

9.4.5 Japan

9.4.5.1 Japan Smart Connected Assets and Operations Market Estimates and Forecasts, By Module (2021-2032) (USD Billion)

9.4.5.2 Japan Smart Connected Assets and Operations Market Estimates and Forecasts, By Industry (2021-2032) (USD Billion)

9.4.6 South Korea

9.4.6.1 South Korea Smart Connected Assets and Operations Market Estimates and Forecasts, By Module (2021-2032) (USD Billion)

9.4.6.2 South Korea Smart Connected Assets and Operations Market Estimates and Forecasts, By Industry (2021-2032) (USD Billion)

9.4.7 Singapore

9.4.7.1 Singapore Smart Connected Assets and Operations Market Estimates and Forecasts, By Module (2021-2032) (USD Billion)

9.4.7.2 Singapore Smart Connected Assets and Operations Market Estimates and Forecasts, By Industry (2021-2032) (USD Billion)

8.4.8 Australia

8.4.8.1 Australia Smart Connected Assets and Operations Market Estimates and Forecasts, By Module (2021-2032) (USD Billion)

8.4.8.2 Australia Smart Connected Assets and Operations Market Estimates and Forecasts, By Industry (2021-2032) (USD Billion)

9.4.9 Rest of Asia Pacific

9.4.9.1 Rest of Asia Pacific Smart Connected Assets and Operations Market Estimates and Forecasts, By Module (2021-2032) (USD Billion)

9.4.9.2 Rest of Asia Pacific Smart Connected Assets and Operations Market Estimates and Forecasts, By Industry (2021-2032) (USD Billion)

9.5 Middle East & Africa

9.5.1 Trends Analysis

9.5.2 Middle East & Africa Smart Connected Assets and Operations Market Estimates and Forecasts, by Country (2021-2032) (USD Billion)

9.5.3 Middle East & Africa Smart Connected Assets and Operations Market Estimates and Forecasts, By Module (2021-2032) (USD Billion) 

9.5.4 Middle East & Africa Smart Connected Assets and Operations Market Estimates and Forecasts, By Industry (2021-2032) (USD Billion)

9.5.5 UAE

9.5.5.1 UAE Smart Connected Assets and Operations Market Estimates and Forecasts, By Module (2021-2032) (USD Billion)

9.5.5.2 UAE Smart Connected Assets and Operations Market Estimates and Forecasts, By Industry (2021-2032) (USD Billion)

9.5.6 Saudi Arabia

9.5.6.1 Saudi Arabia Smart Connected Assets and Operations Market Estimates and Forecasts, By Module (2021-2032) (USD Billion)

9.5.6.2 Saudi Arabia Smart Connected Assets and Operations Market Estimates and Forecasts, By Industry (2021-2032) (USD Billion)

9.5.7 Qatar

9.5.7.1 Qatar Smart Connected Assets and Operations Market Estimates and Forecasts, By Module (2021-2032) (USD Billion)

9.5.7.2 Qatar Smart Connected Assets and Operations Market Estimates and Forecasts, By Industry (2021-2032) (USD Billion)

9.5.8 South Africa

9.5.8.1 South Africa Smart Connected Assets and Operations Market Estimates and Forecasts, By Module (2021-2032) (USD Billion)

9.5.8.2 South Africa Smart Connected Assets and Operations Market Estimates and Forecasts, By Industry (2021-2032) (USD Billion)

9.5.9 Middle East & Africa

9.5.9.1 Middle East & Africa Smart Connected Assets and Operations Market Estimates and Forecasts, By Module (2021-2032) (USD Billion)

9.5.9.2 Middle East & Africa Smart Connected Assets and Operations Market Estimates and Forecasts, By Industry (2021-2032) (USD Billion)

9.6 Latin America

9.6.1 Trends Analysis

9.6.2 Latin America Smart Connected Assets and Operations Market Estimates and Forecasts, by Country (2021-2032) (USD Billion)

9.6.3 Latin America Smart Connected Assets and Operations Market Estimates and Forecasts, By Module (2021-2032) (USD Billion) 

9.6.4 Latin America Smart Connected Assets and Operations Market Estimates and Forecasts, By Industry (2021-2032) (USD Billion)

9.6.5 Brazil

9.6.5.1 Brazil Smart Connected Assets and Operations Market Estimates and Forecasts, By Module (2021-2032) (USD Billion)

9.6.5.2 Brazil Smart Connected Assets and Operations Market Estimates and Forecasts, By Industry (2021-2032) (USD Billion)

9.6.6 Argentina

9.6.6.1 Argentina Smart Connected Assets and Operations Market Estimates and Forecasts, By Module (2021-2032) (USD Billion)

9.6.6.2 Argentina Smart Connected Assets and Operations Market Estimates and Forecasts, By Industry (2021-2032) (USD Billion)

9.6.7 Rest of Latin America

9.6.7.1 Rest of Latin America Smart Connected Assets and Operations Market Estimates and Forecasts, By Module (2021-2032) (USD Billion)

9.6.7.2 Rest of Latin America Smart Connected Assets and Operations Market Estimates and Forecasts, By Industry (2021-2032) (USD Billion)

10. Company Profiles

           10.1 IBM Corporation

                          10.1.1 Company Overview

10.1.2 Financial

10.1.3 Product / Services Offered

10.1.4 SWOT Analysis

           10.2 General Electric (GE)

                           10.2.1 Company Overview

10.2.2 Financial

10.2.3 Product/ Services Offered

10.2.4 SWOT Analysis

10.3 Siemens AG

              10.3.1 Company Overview

10.3.2 Financial

10.3.3 Product/ Services Offered

10.3.4 SWOT Analysis

10.4 Schneider Electric

             10.4.1 Company Overview

10.4.2 Financial

10.4.3 Product/ Services Offered

10.4.4 SWOT Analysis

10.5 Rockwell Automation, Inc.

             10.5.1 Company Overview

10.5.2 Financial

10.5.3 Product/ Services Offered

10.5.4 SWOT Analysis

10.6 Honeywell International Inc.

             10.6.1 Company Overview

10.6.2 Financial

10.6.3 Product/ Services Offered

10.6.4 SWOT Analysis

10.7 ABB Ltd.

             10.7.1 Company Overview

10.7.2 Financial

10.7.3 Product/ Services Offered

10.7.4 SWOT Analysis

10.8 Cisco Systems, Inc.

             10.8.1 Company Overview

10.8.2 Financial

10.8.3 Product/ Services Offered

10.8.4 SWOT Analysis

10.9 PTC Inc

             10.9.1 Company Overview

10.9.2 Financial

10.9.3 Product/ Services Offered

10.9.4 SWOT Analysis

10.10 SAP SE

             10.10.1 Company Overview

10.10.2 Financial

10.10.3 Product/ Services Offered

10.10.4 SWOT Analysis

11. Use Cases and Best Practices

12. Conclusion

An accurate research report requires proper strategizing as well as implementation. There are multiple factors involved in the completion of good and accurate research report and selecting the best methodology to compete the research is the toughest part. Since the research reports we provide play a crucial role in any company’s decision-making process, therefore we at SNS Insider always believe that we should choose the best method which gives us results closer to reality. This allows us to reach at a stage wherein we can provide our clients best and accurate investment to output ratio.

Each report that we prepare takes a timeframe of 350-400 business hours for production. Starting from the selection of titles through a couple of in-depth brain storming session to the final QC process before uploading our titles on our website we dedicate around 350 working hours. The titles are selected based on their current market cap and the foreseen CAGR and growth.


The 5 steps process:

Step 1: Secondary Research:

Secondary Research or Desk Research is as the name suggests is a research process wherein, we collect data through the readily available information. In this process we use various paid and unpaid databases which our team has access to and gather data through the same. This includes examining of listed companies’ annual reports, Journals, SEC filling etc. Apart from this our team has access to various associations across the globe across different industries. Lastly, we have exchange relationships with various university as well as individual libraries.

Secondary Research

Step 2: Primary Research

When we talk about primary research, it is a type of study in which the researchers collect relevant data samples directly, rather than relying on previously collected data.  This type of research is focused on gaining content specific facts that can be sued to solve specific problems. Since the collected data is fresh and first hand therefore it makes the study more accurate and genuine.

We at SNS Insider have divided Primary Research into 2 parts.

Part 1 wherein we interview the KOLs of major players as well as the upcoming ones across various geographic regions. This allows us to have their view over the market scenario and acts as an important tool to come closer to the accurate market numbers. As many as 45 paid and unpaid primary interviews are taken from both the demand and supply side of the industry to make sure we land at an accurate judgement and analysis of the market.

This step involves the triangulation of data wherein our team analyses the interview transcripts, online survey responses and observation of on filed participants. The below mentioned chart should give a better understanding of the part 1 of the primary interview.

Primary Research

Part 2: In this part of primary research the data collected via secondary research and the part 1 of the primary research is validated with the interviews from individual consultants and subject matter experts.

Consultants are those set of people who have at least 12 years of experience and expertise within the industry whereas Subject Matter Experts are those with at least 15 years of experience behind their back within the same space. The data with the help of two main processes i.e., FGDs (Focused Group Discussions) and IDs (Individual Discussions). This gives us a 3rd party nonbiased primary view of the market scenario making it a more dependable one while collation of the data pointers.

Step 3: Data Bank Validation

Once all the information is collected via primary and secondary sources, we run that information for data validation. At our intelligence centre our research heads track a lot of information related to the market which includes the quarterly reports, the daily stock prices, and other relevant information. Our data bank server gets updated every fortnight and that is how the information which we collected using our primary and secondary information is revalidated in real time.

Data Bank Validation

Step 4: QA/QC Process

After all the data collection and validation our team does a final level of quality check and quality assurance to get rid of any unwanted or undesired mistakes. This might include but not limited to getting rid of the any typos, duplication of numbers or missing of any important information. The people involved in this process include technical content writers, research heads and graphics people. Once this process is completed the title gets uploader on our platform for our clients to read it.

Step 5: Final QC/QA Process:

This is the last process and comes when the client has ordered the study. In this process a final QA/QC is done before the study is emailed to the client. Since we believe in giving our clients a good experience of our research studies, therefore, to make sure that we do not lack at our end in any way humanly possible we do a final round of quality check and then dispatch the study to the client.

Key Segments: 

By Module

  • Hardware

  • APM software & platform

  • Service

By Industry

  • Automotive & Transportation

  • Energy & Power

  • Healthcare

  • Smart Agriculture

  • Factory Automation

  • Others

Request for Segment Customization as per your Business Requirement: Segment Customization Request

Regional Coverage: 

North America

  • US

  • Canada

  • Mexico

Europe

  • Germany

  • France

  • UK

  • Italy

  • Spain

  • Poland

  • Turkey

  • Rest of Europe

Asia Pacific

  • China

  • India

  • Japan

  • South Korea

  • Singapore

  • Australia

  • Rest of Asia Pacific

Middle East & Africa

  • UAE

  • Saudi Arabia

  • Qatar

  • South Africa

  • Rest of Middle East & Africa

Latin America

  • Brazil

  • Argentina

  • Rest of Latin America

Request for Country Level Research Report: Country Level Customization Request

Available Customization 

With the given market data, SNS Insider offers customization as per the company’s specific needs. The following customization options are available for the report: 

  • Detailed Volume Analysis 

  • Criss-Cross segment analysis (e.g. Product X Application) 

  • Competitive Product Benchmarking 

  • Geographic Analysis 

  • Additional countries in any of the regions 

  • Customized Data Representation 

  • Detailed analysis and profiling of additional market players

Explore Key Insights 


  • Analyzes market trends, forecasts, and regional dynamics
  • Covers core offerings, innovations, and industry use cases
  • Profiles major players, value chains, and strategic developments
  • Highlights innovation trends, regulatory impacts, and growth opportunities
Request an Analyst Call