Digital Utility Market Report Scope & Overview:
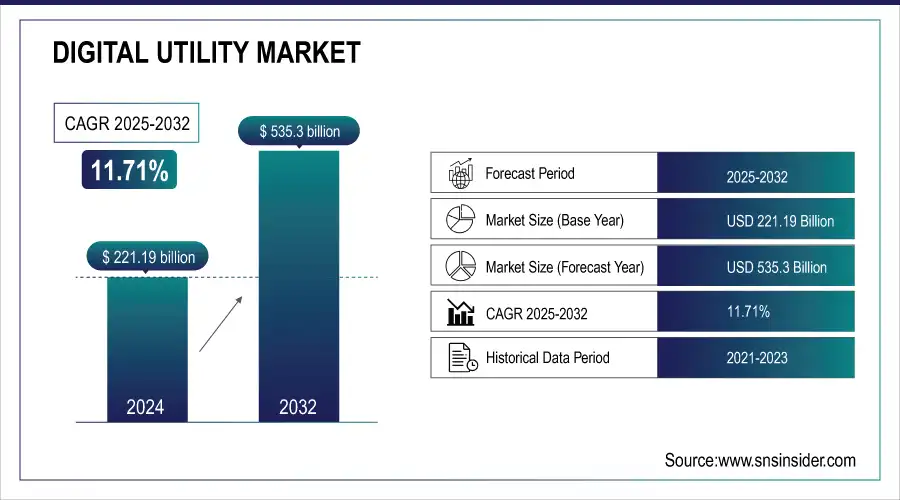
The Digital Utility Market was valued at USD 221.19 billion in 2024 and is expected to reach USD 535.3 billion by 2032, growing at a CAGR of 11.71% from 2025-2032.

To Get more information on Digital Utility Market - Request Free Sample Report
The Digital Utility Market report highlights rising adoption rates of digital utility solutions across electricity, water, and gas utilities, with electric utilities leading in implementation. Smart grid deployment is accelerating, particularly in North America, Europe, and Asia Pacific region, driven by decarbonization and grid modernization initiatives. Regional investments in digital utility infrastructure have surged, especially in cloud-based systems for asset management and customer engagement. Notably, cloud-based utility management software adoption is expanding rapidly among large enterprises, while SMEs are showing steady growth. Additionally, the report reveals increasing integration of AI-driven predictive maintenance and edge analytics into utility operations platforms.
Digital Utility Market Size and Forecast:
-
Market Size in 2024: USD 221.9 Billion
-
Market Size by 2032: USD 535.3 Billion
-
CAGR: 11.71% from 2025 to 2032
-
Base Year: 2024
-
Forecast Period: 2025–2032
-
Historical Data: 2021–2023
Key Digital Utility Market Trends:
-
Integration of AI and machine learning enhances predictive maintenance, demand forecasting, and real-time grid optimization for utility companies.
-
Adoption of smart grids and digital twins improves asset management, operational resilience, and dynamic response to fluctuating energy demand.
-
Growth of distributed energy resources (DERs) and virtual power plants supports decentralized energy management and renewable integration.
-
Rising focus on cybersecurity and regulatory compliance strengthens infrastructure resilience and ensures secure, reliable utility operations.
-
Cloud platforms, edge computing, and blockchain adoption enable decentralized energy transactions, peer-to-peer trading, and system interoperability.
-
Proliferation of IoT-enabled smart meters and sensors provides detailed consumption insights, enabling demand-response programs and predictive analytics.
-
Consumer-centric digital platforms enhance engagement through real-time energy usage insights, personalized billing, and interactive demand management solutions.
-
Government initiatives and sustainability mandates accelerate investments in renewable energy integration and smart utility infrastructure.
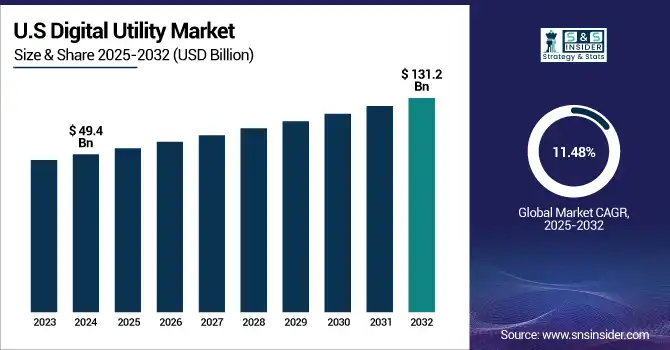
The U.S. Digital Utility Market was valued at USD 49.4 billion in 2024 and is projected to reach USD 131.2 billion by 2032, growing at a CAGR of 11.48% from 2025 to 2032. Growth is fueled by nationwide smart grid initiatives, rising investments in renewable energy integration, and increasing demand for real-time utility asset monitoring and customer management solutions. Additionally, rapid cloud adoption and AI-based operational analytics are further accelerating digital transformation across U.S. utility sectors.

Digital Utility Market Drivers:
-
Increasing investments in smart grid infrastructure and renewable energy integration are accelerating the demand for advanced digital utility solutions.
Governments and utility providers worldwide are heavily investing in smart grid infrastructure to modernize outdated utility networks, enhance grid reliability, and integrate decentralized renewable energy sources. In the U.S., initiatives like the Grid Resilience and Innovation Partnerships and increasing state-level clean energy mandates are accelerating smart grid rollouts. These systems require advanced digital utility platforms for real-time monitoring, distributed asset management, and predictive maintenance. The shift toward renewables like solar, wind, and battery storage also demands digitally enabled utilities for seamless generation, distribution, and consumption balancing, significantly driving market growth for digital utility software, smart meters, and cloud-based management solutions.
Digital Utility Market Restraints:
-
High implementation costs and the complexity of transitioning legacy infrastructure limit digital utility adoption, especially for smaller utilities.
While digital utility solutions offer long-term operational benefits, their high initial capital investment poses a challenge, especially for small and regional utility providers. The costs involved in deploying smart meters, IoT-enabled infrastructure, cloud platforms, and cybersecurity systems can strain operational budgets. Moreover, integrating new digital systems with legacy infrastructure requires significant time, technical expertise, and process restructuring, increasing operational risk during the transition. Many utilities are cautious about large-scale digital adoption due to these complexities, which can slow overall market growth, particularly in emerging economies and resource-constrained municipal utilities.
Digital Utility Market Opportunities:
-
Rising cloud adoption and AI-powered analytics are creating significant opportunities for utilities to optimize operations and grid management.
The increasing shift toward cloud-based utility management platforms presents a substantial opportunity for market players. Cloud solutions offer scalable, cost-effective infrastructure for utilities to manage assets, track consumption patterns, and optimize resource distribution. AI and machine learning models integrated into digital utility platforms enhance operational intelligence through predictive analytics, fault detection, demand forecasting, and customer experience personalization. Utilities embracing AI-powered digital platforms can improve grid efficiency, minimize outages, and optimize renewable energy integration. This trend is especially promising for large enterprises and municipal utilities upgrading infrastructure to align with decarbonization and resilience goals.
Digital Utility Market Challenges:
-
Growing cybersecurity threats and data protection concerns pose operational risks to increasingly digitalized utility networks.
As utility providers digitize operations and implement smart grids, they become increasingly vulnerable to cybersecurity threats targeting critical infrastructure. Smart meters, remote sensors, and cloud-based management systems generate and transmit vast amounts of sensitive operational data, making utility networks attractive targets for cyberattacks. Incidents like ransomware attacks on energy providers and water utilities in recent years highlight these growing risks. Protecting digital utility systems demands substantial investments in security frameworks, encryption, and real-time threat monitoring, which adds operational complexity and costs. Failure to address cybersecurity vulnerabilities can compromise grid reliability, consumer trust, and regulatory compliance.
Digital Utility Market Segmentation Analysis:
By Technology, Hardware Leads the Market While Integrated Digital Solutions Drive Future Growth
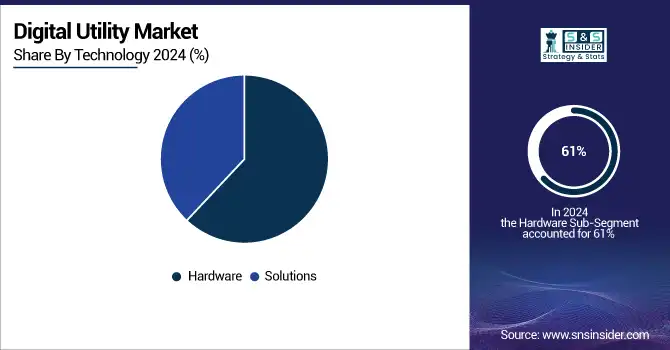
In 2024, the hardware segment dominated the market and accounted for 61% of revenue share. The segment growth is attributable to technological advancements in hardware, along with the growing adoption of smart meters, transformers, and other smart equipment. Smart grid solutions help organizations leverage predictive maintenance, real-time analytics, and asset management; thus, organizations seek smart grids for effective management.
The solutions segment is expected to register the fastest CAGR from 2025 to 2032. The market consists of Integrated Solutions such as cloud and software solutions. It helps in digitizing of assets, operational optimization, flexibility, and enhancing reliability.

By Network, Transmission & Distribution Dominate as Residential Segment Emerges with Fastest Growth
In 2024, the transmission & distribution segment dominated the market and held the highest revenue share of more than 49% in the market. Transmission and distribution solutions are the most widely used solutions in the utility industry, primarily for the monitoring and management of electric transmission and distribution systems. Electrical grids worldwide are aging and were designed for the energy needs of different times. Utilities heavily invest in updating their infrastructure to adapt to evolving business requirements. It integrates modern sensors, communication systems, and automation technologies into the grid.
The residential segment is likely to witness the fastest CAGR throughout the forecast period. These corresponding data extraction and analytics techniques can be essential for efficient customer management, which in turn is expected to spur growth for the segment throughout the forecast. The first one is that consumers are becoming more familiar by the day with environmental matters and the effect of energy usage on climate change. Consequently, a considerable number of consumers turn to renewable energy and sustainable practices from utility providers.
Digital Utility Market Regional Analysis:
North America Dominates Digital Utility Market in 2024
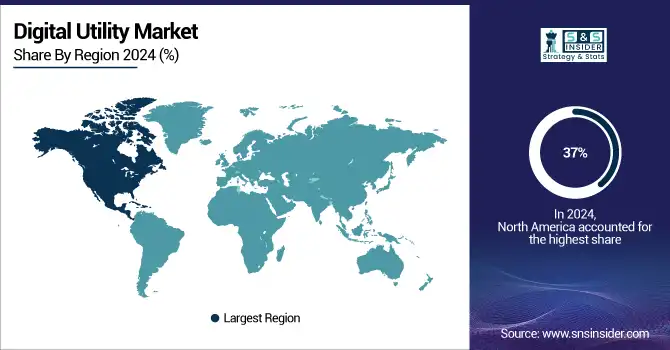
North America holds an estimated 37% market share in 2024, driven by rapid adoption of smart grids, IoT-enabled platforms, and renewable energy integration. This causes utilities to prioritize digital transformation initiatives that enhance grid reliability, predictive maintenance, and customer engagement through advanced analytics and automation. Companies collaborate with technology providers to enhance demand response, grid flexibility, and distributed energy resource management.

Get Customized Report as per Your Business Requirement - Enquiry Now
-
United States Leads North America’s Digital Utility Market
The U.S. dominates due to large-scale smart grid modernization projects, renewable energy adoption, and strong government support for digital infrastructure. Federal funding accelerates investment in clean energy and utility digitalization, while utilities integrate AI, IoT, and cloud-based solutions to optimize operations. With advanced R&D, mature infrastructure, and regulatory support, the U.S. remains the largest contributor to North America’s digital utility leadership.
Asia Pacific is the Fastest-Growing Region in Digital Utility Market in 2024
The region is expected to grow at a CAGR of 13.8% from 2025–2032, driven by rapid urbanization, renewable energy expansion, and government-backed digitalization initiatives. This causes utilities to adopt smart grids, AI-driven platforms, and IoT-based solutions to meet rising electricity demand and sustainability targets.
-
China Leads Asia Pacific’s Digital Utility Market
China dominates the Asia Pacific market due to its large-scale investments in renewable integration, smart city projects, and digital grid modernization. National initiatives such as “New Infrastructure Development” accelerate the deployment of IoT-enabled grids, digital twins, and real-time analytics platforms. With its manufacturing strength in smart meters and sensors, coupled with heavy government support for decarbonization, China sets regional benchmarks. Its strong focus on AI, automation, and big data ensures efficient energy distribution, making China the powerhouse of digital utility transformation in the Asia Pacific.
Europe Digital Utility Market Insights, 2024
Europe is witnessing strong growth in digital utilities, fueled by EU decarbonization targets, renewable integration, and large-scale grid modernization projects. Germany’s emphasis on smart grids, renewable integration, and AI-enabled energy management improves grid efficiency, causing accelerated digital utility adoption across Europe.
-
Germany Leads Europe’s Digital Utility Market
Germany dominates the European market due to its advanced energy transition strategy (Energiewende), prioritizing renewable integration and digital grid management. Heavy investment in IoT-enabled infrastructure, coupled with real-time data analytics platforms, supports predictive maintenance and efficient energy distribution. Partnerships between utilities and technology providers enhance grid flexibility, while vocational training programs foster skilled digital utility professionals. Germany’s leadership in sustainable energy and digital innovation reinforces its central role in shaping Europe’s digital utility future.
Middle East & Africa and Latin America Digital Utility Market Insights, 2024
The Digital Utility Market in these regions is expanding steadily, supported by rising energy demand, smart city projects, and renewable energy adoption. Countries such as the UAE and Saudi Arabia invest heavily in smart grids, digital platforms, and clean energy integration, while Brazil and Mexico focus on grid modernization and distributed energy resource management. International partnerships and technology investments accelerate the adoption of IoT, AI, and cloud-based utility platforms. Growing emphasis on sustainability and digital transformation drives steady progress across both regions.
Competitive Landscape for the Digital Utility Market:
Siemens AG
Siemens AG is a global leader in electrification, automation, and digitalization for utilities and infrastructure. Its Siemens Xcelerator and Grid Software portfolios deliver end-to-end digital utility capabilities — from grid planning and asset management to real-time operations, DERMS/ADMS integration, and edge-to-cloud analytics that help utilities modernize distribution and transmission networks. Siemens also combines hardware (switchgear, transformers, HV equipment) with software-driven services to support resilience, asset lifecycle management, and the energy transition.
-
In 2025, Siemens showcased its latest grid-modernization and digital transformation technologies at DISTRIBUTECH 2025 and continues to push Smart Infrastructure targets focused on growth and value creation.
Schneider Electric SE
Schneider Electric SE is a French multinational focused on energy management and automation, offering an integrated digital utility stack (EcoStruxure and related grid platforms) that spans planning, asset health, DER integration, distribution automation, and customer engagement. Schneider emphasizes software-defined grid solutions, AI-enabled asset advisors, and services that reduce losses, improve reliability, and accelerate utilities’ decarbonization and resiliency efforts.
-
On March 25, 2025, Schneider Electric announced the “One Digital Grid” platform — an AI-forward, end-to-end digital grid offering aimed at planning & asset management, operations & resiliency, and flexibility & customer engagement.
ABB Ltd
ABB Ltd provides a broad portfolio for utilities combining power-electrification hardware (switchgear, transformers, HVDC/FACTS), power-conversion technologies, and the ABB Ability digital platform for asset performance, grid automation, and DER/inverter management. ABB positions itself as a systems integrator that links field devices, control systems, power-electronics and cloud analytics to improve uptime, efficiency, and renewable integration.
-
ABB highlighted a comprehensive set of grid solutions at DISTRIBUTECH 2025 and has pursued strategic moves, including renewables-focused acquisitions, to strengthen its digital and conversion technology capabilities for utilities.
General Electric Company (GE / GE Vernova)
General Electric, through its GE Vernova / Grid Solutions businesses, supplies a mix of high-voltage equipment, grid automation, protection & controls, and the GridOS/GridBeats software family that supports utilities’ digitalization, asset lifecycle, and operational analytics. GE emphasizes software-enabled grid visibility, automation, and AI-assisted tools for inspection, virtualized protection, and microgrid/DER orchestration — coupling OEM equipment with cloud and on-prem software stacks.
-
In 2025, GE Vernova expanded its grid automation and digitalization offerings at DISTRIBUTECH and strengthened its AI capabilities for utilities by acquiring Alteia, enhancing GridOS Visual Intelligence.
Digital Utility Market key Players:
-
Siemens AG
-
Schneider Electric SE
-
ABB Ltd
-
General Electric Company (GE)
-
Honeywell International Inc.
-
Itron, Inc.
-
Landis+Gyr Group AG
-
Oracle Corporation
-
IBM Corporation
-
Cisco Systems, Inc.
-
SAP SE
-
Emerson Electric Co.
-
Eaton Corporation
-
Hitachi Ltd
-
Toshiba Corporation
-
Capgemini SE
-
Veolia Environnement S.A.
-
Enel Group
-
Sensus (Xylem Inc.)
-
Silver Spring Networks (Itron subsidiary)
| Report Attributes | Details |
| Market Size in 2024 | US$ 221.9 Billion |
| Market Size by 2032 | US$ 535.3 Billion |
| CAGR | CAGR of 11.71 % From 2024 to 2032 |
| Base Year | 2024 |
| Forecast Period | 2025-2032 |
| Historical Data | 2021-2023 |
| Report Scope & Coverage | Market Size, Segments Analysis, Competitive Landscape, Regional Analysis, DROC & SWOT Analysis, Forecast Outlook |
| Key Segments | • By Technology (Hardware, Integrated Solutions) • By Network (Generation, Transmission & Distribution, Retail) |
| Regional Analysis/Coverage | North America (US, Canada, Mexico), Europe (Eastern Europe [Poland, Romania, Hungary, Turkey, Rest of Eastern Europe] Western Europe] Germany, France, UK, Italy, Spain, Netherlands, Switzerland, Austria, Rest of Western Europe]), Asia Pacific (China, India, Japan, South Korea, Vietnam, Singapore, Australia, Rest of Asia Pacific), Middle East & Africa (Middle East [UAE, Egypt, Saudi Arabia, Qatar, Rest of Middle East], Africa [Nigeria, South Africa, Rest of Africa], Latin America (Brazil, Argentina, Colombia, Rest of Latin America) |
| Company Profiles | Siemens, ABB, Schneider Electric, General Electric, Oracle, SAP, IBM, Landis+Gyr, Itron, Eaton, Hitachi Energy, Cisco, Honeywell, Open Systems International (OSI), Aclara Technologies |

