Tractor Implements Market Report Scope & Overview:
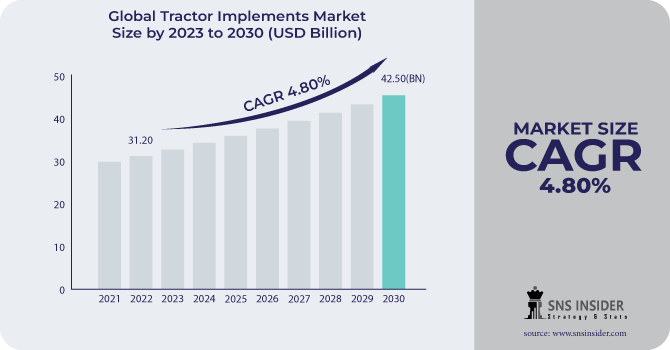
The Tractor Implements Market size is expected to reach USD 42.50 Bn by 2030, the market was valued at USD 31.20 Bn in 2022 and will grow at a CAGR of 4.80% over the forecast period of 2023-2030.
To prepare the ground for planting, plows are used to break up and turn the soil. Moldboard plows, disc plows, and chisel plows are just a few of the several kinds of plows available. Each is designed for a particular soil type and setting. Harrows: Harrows are used to break up clods or to smooth and level soil after plowing. Harrow types include disc harrows, chain harrows, and spike-tooth harrows. Powerful equipment for deep cultivation and soil preparation is the rotary tiller. Compacted soil is broken up, organic matter is added, and seedbeds are prepared. Planter or Seeder? Seeds are sown in rows at predetermined intervals using planters and seeders, respectively. They are available in a range of shapes and sizes, from modest garden seeders to substantial planters for row crops.
Weeds are pulled up and the soil around crops is aerated with cultivators. Field cultivators, row crop cultivators, and tine cultivators are just a few of the various designs available. Pesticides, herbicides, fertilizers, and other chemicals are applied to crops using tractors mounted sprayers. The two most popular types of sprayers are boom and broadcast. Grass, hay, and other plants are mowed with tractor-mounted mowers. They can be found in rotary, flail, and sickle bar styles, among others. Tractors can scoop, lift, and move things like soil, gravel, and feed thanks to the loader attachment. Backhoes and front-end loaders are typical loader attachments. Tractors can excavate, dig ditches, and carry out various earthmoving activities thanks to backhoe attachments. They frequently appear in construction.
Uses for this attachment include planting trees and excavating holes for fence posts. Both hydraulic and manual versions are available. Hay, straw, or other materials are handled in round or square bales with bale spears. They can be connected to the front-end loader of the tractor. This tool is used to distribute manure or other organic fertilizing ingredients on fields. It is available in a variety of shapes and sizes. Snow blowers are used to clear paths, driveways, and roads of snow. In areas where there is a lot of snowfall, they are crucial. Gravel or dirt roads and surfaces can be graded, leveled, and smoothed using a grader blade attachment.
Market Dynamics:
Driver
The rising activities related to agriculture.
Urban agriculture programs are becoming more and more popular in cities all around the world. Urban residents can grow fresh produce close to where they live using rooftop gardens, communal gardens, and indoor hydroponic systems, which lowers the carbon footprint of food transportation. Startups in the agriculture technology (agtech) space are creating solutions for anything from automated farm equipment to supply chain tracking based on blockchain technology and AI-powered crop management. The development of genetically modified crops with improved resistance to pests, diseases, and unfavorable environmental conditions is being facilitated by advances in biotechnology and genome editing methods like CRISPR-Cas9.
Restrain
To maintain smooth and secure operation, tractor implements need routine maintenance. Inadequate maintenance can result in malfunctions, poor performance, and higher repair expenses.
Opportunity
The need for minimizing the labor cost and at the same time improve efficacy.
Various operations that would usually require a lot of manual labor are automated by tractor implements. Automated planting, harvesting, and baling tools, for instance, can eliminate the need for labor-intensive operations, saving time and money. Farmers may work effectively and fast thanks to the efficiency of modern tractor equipment. Farmers can manage greater acreages and perform more tasks during the busy planting and harvesting seasons thanks to the time savings. Farmers can diversify their crops and adjust to shifting market needs thanks to the large range of types and sizes of tractor implements. No-till farming tools, for instance, can lessen soil disturbance and encourage better soil, enabling the production of a variety of crops.
Challenge
It takes sufficient training to operate tractor tools efficiently and safely. Inexperienced operators may have trouble setting up and controlling the implementation.
Impact of Recession
Used tractor implement sales may rise during economic downturns as farmers and companies try to make money by offloading surplus machinery. The demand for new equipment may be impacted by this. Tractor implement producers may have difficulties in terms of funding for research and development. Reductions in funding for innovation and the creation of new products may result from a recession, which could delay the release of cutting-edge tools on the market. Disruptions in global supply chains, which can happen during economic downturns, may have an effect on the supply of the parts and components required to make tractor implements. Manufacturers may experience delays and increased expenses as a result.
Impact of Russia Ukraine War:
Manufacturers of tractor implements may incur greater production expenses if the war raises energy prices or causes delays in the movement of commodities. Consumers might be affected by this as a result of price increases. The conflict may have an impact on Ukraine's agriculture, a significant exporter of agricultural products. The demand for tractor implements in the area and on the world agricultural markets may be impacted by changes in crop yields or production disruptions. The export and import of tractor implement may be affected by geopolitical tensions and sanctions related to the conflict. Market access and pricing may be impacted by tariffs, export prohibitions, or trade restrictions.
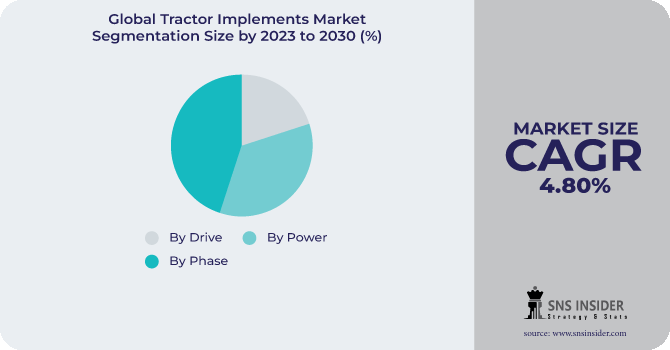
Market Segmentation
By Phase
-
Tillage
-
Irrigation
-
Crop Protection
-
Sowing
-
Harvesting
-
Others
By Drive
-
2-Wheel
-
4-Wheel
By Power
-
Powered
-
Unpowered
Regional Coverage
North America
-
US
-
Canada
-
Mexico
Europe
-
Eastern Europe
-
Poland
-
Romania
-
Hungary
-
Turkey
-
Rest of Eastern Europe
-
-
Western Europe
-
Germany
-
France
-
UK
-
Italy
-
Spain
-
Netherlands
-
Switzerland
-
Austria
-
Rest of Western Europe
-
Asia Pacific
-
China
-
India
-
Japan
-
South Korea
-
Vietnam
-
Singapore
-
Australia
-
Rest of Asia Pacific
Middle East & Africa
-
Middle East
-
UAE
-
Egypt
-
Saudi Arabia
-
Qatar
-
Rest of Middle East
-
-
Africa
-
Nigeria
-
South Africa
-
Rest of Africa
-
Latin America
-
Brazil
-
Argentina
-
Colombia
-
Rest of Latin America
Regional Analysis
The agriculture industry in North America, and particularly the United States, is developed and heavily mechanized. A high rate of adoption of cutting-edge tractor tools, such as precision farming technology, defines the market. Sustainable farming methods are also gaining popularity. Canada has a sizable agricultural sector, and the country's diverse agricultural terrain, which includes grain farming, animal farming, and horticulture, has an impact on the tractor tools market. The demand for effective implements is being driven by modernization initiatives.
The agricultural sector in China is huge and expanding swiftly. As a result of the government's emphasis on modernizing agriculture and increasing farm production, there is a considerable demand for tractor implements. Technologies for smart farming are also gaining prominence. India has a diversified agricultural environment with a focus on smallholder farming. Tractor implement demand is driven by the need for mechanization to increase farm output and reduce reliance on manual labor.
Key Players
The major key players are Claas KGaA, Deere & Co, Kubota Corp, CNH Industrial, Afco Corporation, TAFE, SDF Group, Mahindra & Mahindra, Actuant, Kuhn Group, and others.
Kubota Corp-Company Financial Analysis
| Report Attributes | Details |
| Market Size in 2022 | US$ 31.20 Bn |
| Market Size by 2030 | US$ 42.50 Bn |
| CAGR | CAGR of 4.80 % From 2023 to 2030 |
| Base Year | 2022 |
| Forecast Period | 2023-2030 |
| Historical Data | 2019-2021 |
| Report Scope & Coverage | Market Size, Segments Analysis, Competitive Landscape, Regional Analysis, DROC & SWOT Analysis, Forecast Outlook |
| Key Segments | • By Phase (Tillage, Irrigation, Crop Protection, Sowing, Harvesting, Others), • By Drive (2-Wheel, 4-Wheel), • By Power (Powered, Unpowered), |
| Regional Analysis/Coverage | North America (US, Canada, Mexico), Europe (Eastern Europe [Poland, Romania, Hungary, Turkey, Rest of Eastern Europe] Western Europe] Germany, France, UK, Italy, Spain, Netherlands, Switzerland, Austria, Rest of Western Europe]), Asia Pacific (China, India, Japan, South Korea, Vietnam, Singapore, Australia, Rest of Asia Pacific), Middle East & Africa (Middle East [UAE, Egypt, Saudi Arabia, Qatar, Rest of Middle East], Africa [Nigeria, South Africa, Rest of Africa], Latin America (Brazil, Argentina, Colombia Rest of Latin America) |
| Company Profiles | Cargo Carriers, UPS, FedEx, Ceva Holdings, Tuma Transport, Swift Transport, Interlogix, Transtech Logistics Procet, Concargo and others. |
| Key Drivers | • The rising activities related to agriculture. |
| Market Restraints | • To maintain smooth and secure operation. |
Frequently Asked Questions
Ans: It takes sufficient training to operate tractor tools efficiently and safely.
Ans; The rising activities related to agriculture.
Ans: APAC will be the region which will have the highest CAGR growth rate.
Ans: The Tractor Implements Market size is expected to reach USD 42.50 Bn by 2030, the market was valued at USD 31.20 Bn in 2022 and will grow at a CAGR of 4.80% over the forecast period of 2023-2030.
Ans The CAGR growth rate recorded was 4.80%
Get in Touch
