Smart Agriculture Market Report Scope & Overview:
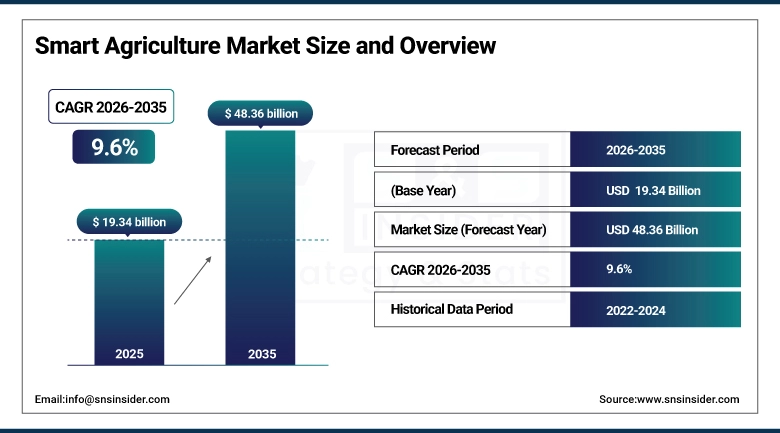
The Smart Agriculture Market size was valued at USD 19.34 Billion in 2025 and is expected to grow to USD 48.36 Billion by 2035 and grow at a CAGR of 9.6% over the forecast period of 2026-2035.
Agriculture is facing intense pressure. The FAO predicts that a 70% increase in food production will be needed by 2050 to feed a population of 9.1 billion, as the climate crisis continues to impact supply chains. This is the point where advanced agricultural practices, utilizing technologies such as AI, become involved. The demand for higher productivity and efficiency in a shifting climate is fueling this growth. AI assists farmers in forecasting weather patterns several months ahead, enabling them to prepare for unforeseeable weather conditions. It also assesses the health of the soil, an essential yet slowly renewing asset, guaranteeing sustainability in the long run. With one-third of the planet's soil already deteriorating, the importance of AI in soil management is increasingly vital. Climate change is not only a concern for the environment, but also a chance for business growth. Public-private partnerships are essential for expanding Smart Agriculture solutions, not only for ensuring food security, but also for seizing the USD 1 trillion climate adaptation opportunity across various sectors. By embracing AI-driven technologies, businesses in the food and beverage industry can enhance supply chain resilience and reduce greenhouse gas emissions, benefiting both their bottom line and the environment.
Market Size and Forecast:
-
Market Size in 2025 USD 19.34 Billion
-
Market Size by 2035 USD 48.36 Billion
-
CAGR of 9.6% From 2026 to 2035
-
Base Year 2025
-
Forecast Period 2026-2035
-
Historical Data 2021-2024
To Get More Information On Smart Agriculture Market - Request Free Sample Report
Smart Agriculture Market Trends:
-
Increasing integration of solar-powered solutions to support energy-efficient smart farming and reduce operational costs.
-
Rapid adoption of digital and precision agriculture tools such as sensors, drones, and mobile platforms across farms.
-
Growing focus on digitizing smallholder farms in developing regions to improve productivity and food security.
-
Rising deployment of data-driven decision-making technologies for crop monitoring, irrigation, and yield optimization.
-
Alignment of smart agriculture adoption with sustainability goals and SDGs, encouraging environmentally responsible farming practices.
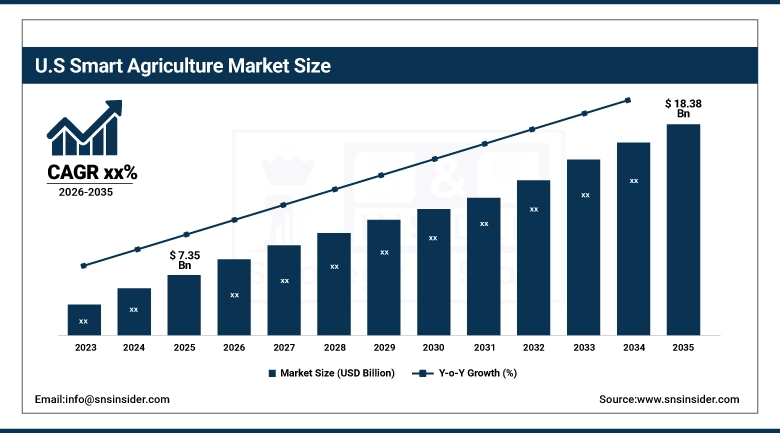
U.S. Smart Agriculture Market Size Outlook:
The U.S. Smart Agriculture Market is projected to grow from USD 7.35 Billion in 2025 to USD 18.38 Billion by 2035. Driven by strong adoption of precision farming, advanced farm machinery, and digital agriculture solutions. High technology readiness, supportive government initiatives, sustainability-focused practices, and leadership from key players such as John Deere and Trimble continue to accelerate market growth nationwide.
Smart Agriculture Market Growth Drivers:
-
Decreasing Price of Solar Energy Drives Adoption of Smart Agriculture Technologies
Technological advancements have significantly reduced the cost of solar power, making it a major market driver for the Smart Agriculture industry. Solar energy is now significantly more affordable and clean with a 90% decrease in Levelized Cost of Electricity (LCOE) from ten cents to just one to two cents per kilowatt-hour in areas like Africa. This economic benefit drives the incorporation of solar technology into farming methods, allowing farmers to embrace smart agricultural solutions. LONGi's Hi-MO 9 module emphasizes the advancement in solar technology, with an efficiency of 24.4% and a 6.5-8% increase in power generation on the same land area, solidifying its status as a practical and appealing choice for powering agricultural activities. The decrease in costs, along with rising energy needs in the agricultural sector, is speeding up the acceptance of smart agricultural technologies. This is fueling the expansion of the Smart Agriculture industry, forecasted to hit USD 25.4 billion by 2028.
Smart Agriculture Market Restraints:
-
Climate Change and Deforestation are worsening Agricultural difficulties.
The growing climate crisis presents a major obstacle for Smart Agriculture in at-risk areas such as Madagascar. Severe weather occurrences, like droughts and cyclones, disturb agricultural production, livelihoods, and food security. Farmers contribute to the worsening of climate change by turning to deforestation in order to increase their land, creating a harmful cycle. The interaction of climate change and deforestation obstructs the implementation of sustainable farming practices and reduces the impact of innovative agriculture solutions. Nearly 1/3 of Madagascar's population experiencing food insecurity highlights the urgent requirement for resilient and adaptive agricultural tactics, making the challenge more evident. Despite some progress shown by initiatives from Conservation International and the UN Green Climate Fund, it is essential to widely adopt climate-Smart Agriculture to address this market barrier and guarantee food security in the midst of a changing climate.
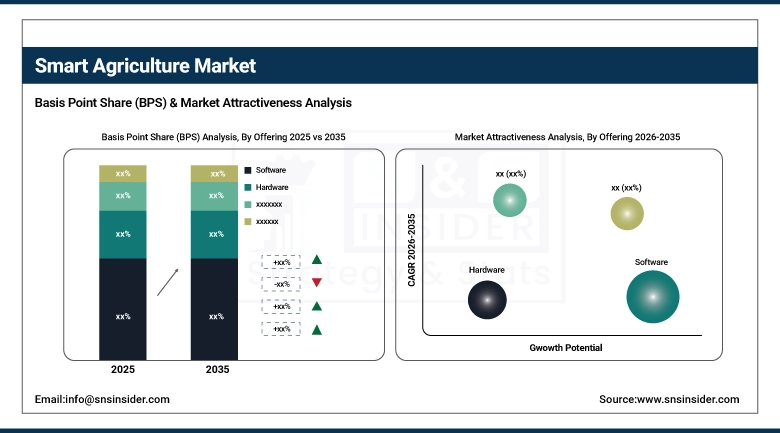
Smart Agriculture Market Segment Analysis:
By Offering
Offering-wise, Software was the dominant force in the Smart Agriculture market, boasting a substantial 56% share in 2025E. The reason for this supremacy lies in the fact that smart farming is driven by data. Picture a farmer using software as a digital compass to steer them through key decisions. Farm management software serves as a guide by gathering and evaluating information from sensors, drones, and various other sources. This information enables farmers to make accurate decisions, from planting and irrigation to pest management. The growth of IoT devices and sensors in farming has also boosted the software industry. These sensors function as virtual vision and hearing organs, consistently producing information that must be gathered and analyzed. Farm management software converts raw data into useful insights, allowing farmers to closely oversee and manage all aspects of their operations. Basically, software acts as the intelligence behind the smart farming evolution.
By Farm Size
Smart Agriculture Market in 2025E is led by small farms 38% share, driven by adoption of cost-effective technologies such as smart irrigation, soil sensors, and mobile farm management applications supported by government incentives and agri-tech startups. Medium farms 34% share show strong uptake of precision agriculture tools, including drones, variable rate technology, and data analytics platforms, due to better capital access and measurable productivity gains. Large farms 28% share generate high-value demand for advanced solutions like autonomous machinery, AI-based farm management systems, robotics, and integrated IoT platforms, focusing on automation, scalability, and operational efficiency.
By Application
Based on Application , Precision Farming dominated the Smart Agriculture market with 42% of share in 2025E. This superiority stems from its capacity to convert conventional agriculture into an efficient and fruitful process. Picture a farmer carefully adjusting their methods for every part of their field, much like a talented artist sculpting a work of art. Precision farming enables farmers to optimize water, fertilizers, and pesticides usage with surgical precision, allowing them to do exactly that. Major reductions in expenses, heightened profitability, and increased crop production. By applying fertilizers only in areas where necessary, farmers can minimize waste and environmental harm while enhancing crop well-being. Precision farming goes beyond technology; it is a strategic method to optimize yield with scarce resources. As the global population continues to rise and the need for more food increases, precision farming is becoming increasingly important for guaranteeing food security and sustainability.
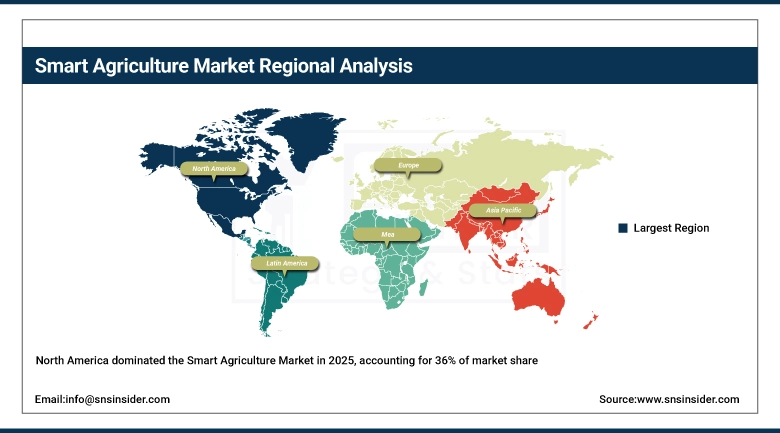
Smart Agriculture Market Regional Analysis:
North America Smart Agriculture Market Insights
North America dominated the Smart Agriculture market with 36% of share in 2025E. The strong agricultural industry in this area, combined with a keen interest in technological advancement, has established a supportive environment for innovative farming solutions. John Deere and Trimble are leading the way by providing cutting-edge equipment and software to enhance farm operations. The emphasis on sustainability and efficiency, motivated by environmental issues, is in line with the objectives of smart farming. Government actions and large investments in agri-tech continue to boost market expansion. As the world faces increasing food demands, North America's implementation of smart agricultural techniques sets an example for other areas to emulate.
Get Customized Report as Per Your Business Requirement - Enquiry Now
Asia Pacific Smart Agriculture Market Insights
Asia Pacific is the second largest fastest growing region with 26% of share in 2025E. The Asia Pacific region is undergoing a swift agricultural evolution supported by advanced technologies such as variable rate technology, intelligent irrigation systems, and AI-driven analytics. This rapid advancement in technology is supported by a thriving livestock and aquaculture sector, requiring automation and intelligent farming solutions. The increasing population in the region, especially in countries such as China and India, is leading to higher meat consumption, which is driving market growth even more. An example of this is the significant increase in cattle populations in China by 3% and in India by 0.4% in 2022, highlighting the growing need for livestock items. Asia Pacific is establishing itself as a top player in smart agriculture, balancing feeding its increasing population with sustainable methods in a dynamic landscape.
Europe Smart Agriculture Market Insights
The Europe smart agriculture market is growing steadily, driven by strong government support, sustainability initiatives, and advanced farming practices. High adoption of precision farming technologies, including sensors, drones, and data analytics, supports efficient resource management. Countries such as Germany, France, and the Netherlands lead adoption, supported by digital infrastructure and increasing focus on climate-smart agriculture.
Latin America (LATAM) and Middle East & Africa (MEA) Smart Agriculture Market Insights
The LATAM and MEA smart agriculture market is expanding due to rising food demand, climate challenges, and growing awareness of precision farming benefits. Increasing adoption of solar-powered solutions, remote sensing, and digital platforms supports productivity improvements. Brazil, Mexico, the UAE, and Saudi Arabia are key markets, driven by investments in agri-technology and sustainable farming initiatives.
Smart Agriculture Companies are:
-
Deere & Company
-
CropMetrics LLC
-
Argus Control Systems Ltd
-
AGCO Corporation
-
AgJunction, Inc
-
CropZilla, Inc
-
DICKEY-john
-
AgEagle Aerial Systems Inc
-
Autonomous Solutions, Inc
-
BouMatic Robotic B.V
-
CLAAS KGaA mbH
-
DroneDeploy
-
Farmers Edge, Inc
-
DeLaval Inc
-
Granular, Inc
-
Trimble Inc
-
Gamaya
-
GEA Group Aktiengesellschaft
-
Raven Industries, Inc
Competitive Landscape for Smart Agriculture Market:
Trimble Inc. is a leading provider of precision agriculture and smart farming technologies, offering GPS, GNSS, sensor systems, and data analytics solutions that enhance crop management, field mapping, and farm automation. Its integrated hardware and software platforms help farmers optimize resource use, improve yields, and increase operational efficiency across global agricultural landscapes.
-
Trimble Inc. release two screens for precision agriculture Farm Sizes, the GFX-1060 and GFX-1260, in October 2022. Farmers can carry out in-field chores quickly and effectively with these next-generation monitors, which allow them to precisely map and monitor field data in real-time.
Hexagon is a global technology company providing smart agriculture solutions through geospatial data, sensors, GNSS, and analytics platforms. Its technologies enable precision farming, land mapping, crop monitoring, and autonomous operations, helping farmers improve productivity, optimize resource usage, and support sustainable agricultural practices worldwide.
-
New Hexagon technology provided accuracy in excavator planting. The launch of HxGN AgrOn Planting Assistant is aimed squarely at the forest market. It can, however, be customized to improve operations on other crop Agriculture Types such as palm oil, citrus, and coffee.
| Report Attributes | Details |
|---|---|
| Market Size in 2025 | USD 19.34 Billion |
| Market Size by 2035 | USD 48.36 Billion |
| CAGR | CAGR of 9.6% From 2026 to 2035 |
| Base Year | 2025E |
| Forecast Period | 2026-2035 |
| Historical Data | 2021-2024 |
| Report Scope & Coverage | Market Size, Segments Analysis, Competitive Landscape, Regional Analysis, DROC & SWOT Analysis, Forecast Outlook |
| Key Segments | • By Agriculture Type (Precision farming, Livestock Monitoring, Smart Greenhouse, Others) • By Offering (Hardware, Software) • By Farm Size (Small Farms, Medium Farms, Large Farms) • By Application (Precision farming application, Livestock monitoring application, Smart greenhouse application, Others.) |
| Regional Analysis/Coverage | North America (US, Canada), Europe (Germany, UK, France, Italy, Spain, Russia, Poland, Rest of Europe), Asia Pacific (China, India, Japan, South Korea, Australia, ASEAN Countries, Rest of Asia Pacific), Middle East & Africa (UAE, Saudi Arabia, Qatar, South Africa, Rest of Middle East & Africa), Latin America (Brazil, Argentina, Mexico, Colombia, Rest of Latin America). |
| Company Profiles | Grownetics, Inc., Deere & Company, CropMetrics LLC, Argus Control Systems Ltd, AGCO Corporation, Ag Leader Technology, AgJunction, Inc., CropZilla, Inc., DICKEY-john, AgEagle Aerial Systems Inc., Autonomous Solutions, Inc., BouMatic Robotic B.V., CLAAS KGaA mbH, DroneDeploy, Farmers Edge, Inc., DeLaval Inc, Granular, Inc., Trimble Inc., Gamaya, GEA Group Aktiengesellschaft, Raven Industries, Inc., and others. |
Frequently Asked Questions
Ans: The North American region is dominating the Smart Agriculture Market.
Ans: The forecast period for the Smart Agriculture Market is 2026-2035.
Ans:The major players are Grownetics, Inc., Deere & Company, CropMetrics LLC, Argus Control Systems Ltd, AGCO Corporation, Ag Leader Technology, AgJunction, Inc., CropZilla, Inc., DICKEY-john, AgEagle Aerial Systems Inc., Autonomous Solutions, Inc., BouMatic Robotic B.V., CLAAS KGaA mbH, DroneDeploy, Farmers Edge, Inc., DeLaval Inc, Granular, Inc., Trimble Inc., Gamaya, GEA Group Aktiengesellschaft, Raven Industries, Inc., and others.
Ans: USD 48.36 billion in 2035 is the market share of the Smart Agriculture Market.
Ans: 9.6 % is the CAGR of the Smart Agriculture Market in the forecast period of 2026-2035.
Get in Touch
