Transition Metals Market Report Scope & Overview:
Get more information on Transition Metals Market - Request Sample Report
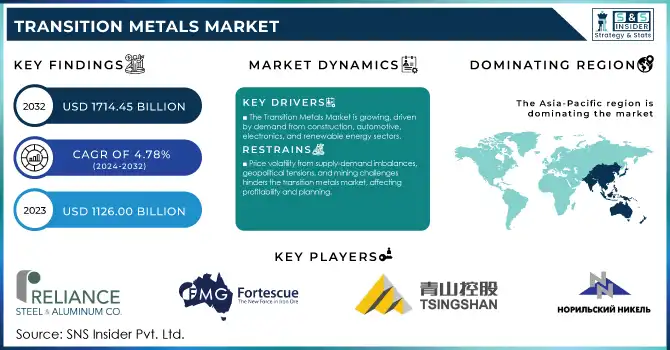
The Transition Metals Market Size was valued at USD 1126.00 billion in 2023, and is expected to reach USD 1714.45 billion by 2032, and grow at a CAGR of 4.78% over the forecast period 2024-2032.
The transition metals market has been experiencing notable growth, driven by their critical role in a wide range of industries such as electronics, automotive, construction, and energy. Transition metals, known for their high melting points, strength, and conductivity, are integral to the manufacturing of alloys, catalysts, and batteries, further boosting their demand. These metals, including copper, zinc, nickel, and iron, are used extensively in electrical wiring, chemical production, and renewable energy technologies, contributing to the market’s expansion.
Nickel plays a crucial role in EV battery chemistries, particularly in high-energy density options such as Nickel Manganese Cobalt (NMC) and Nickel Cobalt Aluminum (NCA) batteries, which offer longer driving ranges essential for broader EV adoption. In 2023, over half of the EV battery market relied on nickel-rich batteries, with the demand for these materials expected to escalate as EV sales grow, targeting up to 60 million units annually by 2030. Nickel’s importance extends beyond just EV batteries. Its role in battery energy storage systems (BESS) is becoming more prominent as renewable energy integration into power grids increases. The demand for BESS is projected to rise six-fold by 2030, further driving the need for nickel.
In 2023, global nickel production stood at 3.6 million tonnes, with Indonesia and the Philippines supplying nearly 60% of the world's nickel. By 2030, nickel demand for EV batteries alone is expected to grow significantly, potentially reaching between 0.53 and 1.09 million tonnes. This growth highlights the critical need for increased nickel production to meet global energy storage and EV battery demands.
Cobalt recycling from used batteries is becoming more prevalent as industries seek to reduce environmental impact. In 2024, cobalt recycling rates from end-of-life batteries reached around 67%. This trend is expected to rise as advancements in recycling technologies and the push for a circular economy continue to evolve, aligning with the global demand for cleaner, more sustainable manufacturing practices. Recycling transition metals from waste products not only reduces dependence on mining but also helps meet growing demand without further straining natural resources. Technological advancements in extraction processes, alloy development, and metal recovery methods are also fostering market growth, making the production of these metals more cost-effective and efficient. As industries worldwide continue to evolve, the transition metals market remains a key contributor to global manufacturing and innovation.
Transition Metals Market Dynamics
DRIVERS
- The Transition Metals Market is growing due to rising demand from construction, automotive, electronics, and renewable energy sectors, driven by industrialization, EV adoption, and sustainable energy trends.
The Transition Metals Market is experiencing significant growth, driven by increasing demand across key end-use industries such as construction, automotive, electronics, and energy. Transition metals like iron, copper, nickel, and cobalt play a pivotal role in these sectors due to their unique properties, including strength, conductivity, and corrosion resistance. Rapid urbanization and industrialization are fueling the need for these metals in structural applications, advanced batteries, and electronic components.
The market is also witnessing significant trends, such as the growing adoption of electric vehicles (EVs), which depend heavily on transition metals like cobalt and nickel for battery manufacturing. Advancements in catalyst technologies and the increasing use of metals in chemical processing further bolster market growth. However, challenges such as price volatility, environmental concerns, and supply chain vulnerabilities pose restraints. Emerging alternatives to transition metals in certain applications could also impact growth. Despite these challenges, the market is projected to expand steadily, driven by continued investment in renewable energy projects, EV infrastructure, and the development of advanced materials.
RESTRAINT
- The transition metals market is hindered by price volatility caused by supply-demand imbalances, geopolitical tensions, and mining challenges, impacting profitability and industry planning.
The transition metals market faces significant challenges due to fluctuating raw material prices, driven by supply-demand imbalances, geopolitical tensions, and the complexities of mining operations. Metals such as copper, nickel, and cobalt are critical for industries like construction, electronics, and renewable energy, but their volatile pricing creates uncertainty in procurement and production planning. Geopolitical factors, such as trade restrictions or conflicts in resource-rich regions, further amplify price instability. Additionally, the high costs and environmental concerns associated with mining and refining these metals often limit their availability. This price volatility can negatively impact the profitability of end-use industries, particularly in sectors like automotive and energy, where transition metals are key inputs. As companies strive to adapt to these market dynamics, the uncertainty around raw material costs remains a critical restraint, necessitating strategic resource management and the exploration of alternative materials or recycling methods.
Transition Metals Market Segmentation
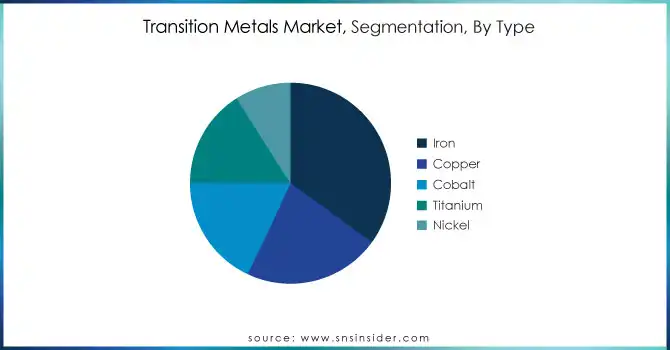
BY TYPE
The iron segment dominated with the market share over 35% in 2023, due to its abundance and role in steel production, a construction staple. This abundance, along with its critical role in steel production, the backbone of construction, fuels predictions of significant growth in the iron market. Meanwhile, copper also growing in electrical wiring due to its exceptional conductivity. Its flexibility and resistance to water corrosion further crown it as the material of choice for water pipes.
Get Customized Report as per your Business Requirement - Request For Customized Report
BY END USER
The building & construction segment dominated with the market share over 32% in 2023, due to the extensive use of steel in infrastructure, buildings, and transportation. Iron and other metals like manganese are crucial components. This is due to the extensive utilization of transition metals such as iron, manganese, and steel in infrastructure development, buildings, and transportation systems. These metals are critical for ensuring durability, structural integrity, and the longevity of construction projects. The automotive sector is the second-largest contributor, driven by the rising demand for electric vehicles (EVs) and the need for lightweight, high-strength materials. Transition metals like aluminum, titanium, and magnesium are increasingly used to manufacture vehicle components that enhance performance while reducing overall weight. Additionally, copper remains indispensable for wiring and electrical components, ensuring efficient energy transmission in automotive systems.
Transition Metals Market Regional Analysis
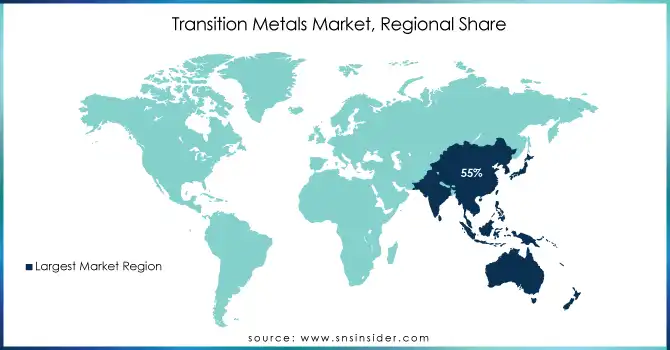
Asia Pacific region dominated with a market share of over 55% in 2023, primarily driven by its large-scale industrial activities and robust manufacturing infrastructure. The region plays a pivotal role in the global supply chain, with key economies like China and India leading the demand for transition metals. China, as the world’s largest producer and consumer of metals, significantly influences the market, accounting for around 50% of global metal consumption. Key sectors such as electronics, automotive, and construction are major drivers. India, with its rapidly growing industrial base, is also contributing to the rising demand for transition metals, particularly for steel production (India is the second-largest steel producer globally, producing around 100 million metric tons annually) and electronics. The expansion of industries such as renewable energy, electric vehicles, and infrastructure development continues to bolster the need for transition metals in Asia.
North America is the fastest-growing region in the transition metals market, fueled by advancements in renewable energy, electric vehicles, and electronics. The increasing demand for transition metals like cobalt, and nickel is driven by the rapid growth of these industries, particularly in electric vehicle batteries and energy storage solutions. Furthermore, substantial investments in mining infrastructure and technological innovations in the region are accelerating the extraction and use of these metals. These factors, combined with a strong focus on sustainable energy solutions and green technologies, are propelling North America’s rapid market growth in the transition metals sector.
Some of the major key players of the Transition Metals Market
- Metallurgical Products India Ltd (India) (Transition metal powders, oxides, and chemical compounds)
- KGHM Polska Miedź S.A. (Poland) (Copper, silver, and other non-ferrous metals)
- Rhenium Alloys (US) (Rhenium-based alloys, molybdenum-rhenium products)
- Reliance Steel & Aluminum Co (US) (Steel and aluminum alloys, specialty metals)
- Transition Metals Corp (Canada) (Exploration and development of nickel, copper, and platinum group elements)
- Fortescue Metals Group Limited (Australia) (Iron ore, nickel, and copper products)
- Rio Tinto Group (UK) (Iron ore, copper, aluminum, and other transition metals)
- Tshingshan Group (China) (Stainless steel, nickel, and cobalt products)
- Norilsk Nickel (Russia) (Nickel, palladium, and platinum group metals)
- Samancor Chrome (South Africa) (Chrome ores, ferrochrome alloys)
- Vedanta Resources plc (Canada) (Zinc, lead, silver, copper, and other metals)
- Vale S.A. (Brazil) (Nickel, cobalt, iron ore, and other metals)
- Anglo American plc (UK) (Platinum, palladium, nickel, and copper)
- Freeport-McMoRan Inc. (US) (Copper, molybdenum, and gold products)
- Glencore plc (Switzerland) (Cobalt, nickel, copper, and ferroalloys)
- Jinchuan Group International Resources Co. Ltd (China) (Nickel, cobalt, and copper products)
- Southern Copper Corporation (Mexico) (Copper, molybdenum, and silver products)
- Outokumpu Oyj (Finland) (Stainless steel, chromium, and ferrochrome alloys)
- Sumitomo Metal Mining Co., Ltd. (Japan) (Nickel, copper, and gold products)
- Eurasian Resources Group (Luxembourg) (Cobalt, nickel, copper, and ferroalloys)
Suppliers for (platinum group metals, copper, iron ore, and nickel production) of Transition Metals Market
- Vale S.A.
- Anglo American Plc
- BHP Group
- Glencore Plc
- Rio Tinto
- Norilsk Nickel
- Freeport-McMoRan Inc.
- Sumitomo Metal Mining Co., Ltd.
- Southern Copper Corporation
- China Molybdenum Co., Ltd.
Recent Development
-
In March 2024: The Adani Group launched the first phase of the world’s largest copper plant in Mundra, Gujarat. This major development is anticipated to reduce India's dependence on copper imports and support the nation’s shift towards cleaner energy sources.
-
In February 2024: Elliott Investment Management, a prominent Wall Street firm, is preparing to initiate a new venture with a billion-dollar investment fund. This venture aims to acquire undervalued mining assets worldwide, capitalizing on the growth of clean energy and the current low valuations of mining companies.
-
In August 2023: H2 Green Steel, based in Sweden, signed agreements with Rio Tinto and Vale to supply Direct Reduced Iron (DRI) pellets for green steel production. Additionally, Rio Tinto will purchase and market any surplus low-carbon hot briquetted iron from H2 Green Steel as part of its capacity expansion plans.
| Report Attributes | Details |
| Market Size in 2023 | USD 1126 Billion |
| Market Size by 2032 | USD 1714.45 Billion |
| CAGR | CAGR of 4.78% From 2024 to 2032 |
| Base Year | 2023 |
| Forecast Period | 2024-2032 |
| Historical Data | 2020-2022 |
| Report Scope & Coverage | Market Size, Segments Analysis, Competitive Landscape, Regional Analysis, DROC & SWOT Analysis, Forecast Outlook |
| Key Segments | • By Type (Iron, Copper, Cobalt, Titanium, Nickel, Others) • By End-Use Industry (Building & Construction, Automotive, Electronics, Paints & Coatings, Others) |
| Regional Analysis/Coverage | North America (US, Canada, Mexico), Europe (Eastern Europe [Poland, Romania, Hungary, Turkey, Rest of Eastern Europe] Western Europe] Germany, France, UK, Italy, Spain, Netherlands, Switzerland, Austria, Rest of Western Europe]), Asia Pacific (China, India, Japan, South Korea, Vietnam, Singapore, Australia, Rest of Asia Pacific), Middle East & Africa (Middle East [UAE, Egypt, Saudi Arabia, Qatar, Rest of Middle East], Africa [Nigeria, South Africa, Rest of Africa], Latin America (Brazil, Argentina, Colombia, Rest of Latin America) |
| Company Profiles | Metallurgical Products India Ltd (India), KGHM Polska Miedź S.A. (Poland), Rhenium Alloys (US), Reliance Steel & Aluminum Co (US), Transition Metals Corp (Canada), Fortescue Metals Group Limited (Australia), Rio Tinto Group (UK), Tshingshan Group (China), Norilsk Nickel (Russia), Samancor Chrome (South Africa), Vedanta Resources plc (Canada), Vale S.A. (Brazil), Anglo American plc (UK), Freeport-McMoRan Inc. (US), Glencore plc (Switzerland), Jinchuan Group International Resources Co. Ltd (China), Southern Copper Corporation (Mexico), Outokumpu Oyj (Finland), Sumitomo Metal Mining Co., Ltd. (Japan), Eurasian Resources Group (Luxembourg). |
| Key Drivers | • The Transition Metals Market is growing due to rising demand from construction, automotive, electronics, and renewable energy sectors, driven by industrialization, EV adoption, and sustainable energy trends. |
| Restraints | • The transition metals market is hindered by price volatility caused by supply-demand imbalances, geopolitical tensions, and mining challenges, impacting profitability and industry planning. |
Frequently Asked Questions
Ans: The Transition Metals Market is expected to grow at a CAGR of 4.78% during 2024-2032.
Ans: The Transition Metals Market was USD 1126 billion in 2023 and is expected to Reach USD 1714.45 billion by 2032.
Ans: The Transition Metals Market is growing due to rising demand from construction, automotive, electronics, and renewable energy sectors, driven by industrialization, EV adoption, and sustainable energy trends.
Ans: The “Iron” segment dominated the Transition Metals Market.
Ans: Asia-Pacific dominated the Transition Metals Market in 2023.
Get in Touch
