Utility Communication Market Key Insights:
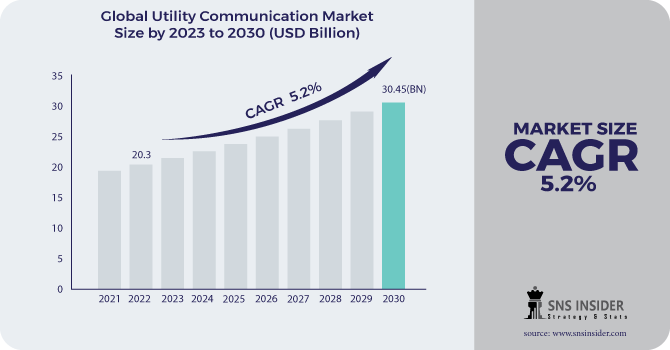
The Utility Communication Market size was valued at USD 20.3 Billion in 2023 and is projected to reach USD 33.70 Billion by 2032, growing at a compound annual growth rate (CAGR) of 5.2% from 2024 to 2032.
Utility communication is a critical aspect of modern infrastructure management. It involves the exchange of information between utility companies and their customers, as well as between different utility providers. Effective utility communication is essential for ensuring the reliable and efficient delivery of essential services such as electricity, gas, water, and telecommunications. To achieve effective utility communication, it is important to have clear and concise messaging that is easily understood by all stakeholders. This requires the use of plain language and the avoidance of technical jargon. Additionally, utility companies must be proactive in communicating with their customers, providing regular updates on service disruptions, maintenance schedules, and other important information. In today's digital age, utility communication has become increasingly reliant on technology. This includes the use of automated systems for monitoring and reporting service outages, as well as online portals and mobile apps for customers to access their account information and report issues. However, it is important to ensure that these technologies are user-friendly and accessible to all customers, regardless of their level of technical expertise.
To Get More Information on Utility Communication Market - Request Sample Report
This market is driven by the increasing demand for reliable and efficient communication systems in the utility industry, as well as the need for real-time monitoring and control of utility assets. With the advent of new technologies such as the Internet of Things (IoT) and 5G networks, the utility communication market is expected to grow significantly in the coming years. As such, it represents a lucrative opportunity for businesses operating in this space to capitalize on the growing demand for advanced communication solutions in the utility sector.
Market Dynamics
Drivers
-
Growing demand for efficient and reliable communication systems
-
Rising demand for energy
-
Growing adoption of smart grid technologies
-
Need for real-time monitoring and control of utility networks
The need for real-time monitoring and control of utility networks is the primary driving force behind the Utility Communication Market. With the increasing demand for energy and the growing complexity of utility networks, it is more important than ever to have robust communication systems in place. These systems enable utilities to monitor their networks in real-time, identify potential issues, and take proactive measures to prevent outages and other disruptions. The utility Communication Market plays a critical role in ensuring the smooth and efficient operation of energy infrastructure.
Restrain
-
High cost of implementation
-
Lack of standardization
Opportunities
-
Emergence of advanced communication technologies such as 5G and the Internet of Things (IoT)
As technology continues to advance, the Utility Communication Market is poised to benefit from the latest developments. With the advent of 5G and IoT, the potential for improved communication and connectivity is greater than ever before. This presents a unique opportunity for the Utility Communication Market to expand and grow, providing even more value to customers and stakeholders alike.
Challenges
-
Complexity of integrating different communication technologies
Impact of COVID-19:
Due to the sudden shift to remote work and social distancing measures, utilities have had to adapt quickly to ensure the continuity of their operations during the Covid-19 pandemic. This has led to an increased demand for reliable and secure communication systems that can support remote work and collaboration. One of the most significant changes caused in the utility communication market is the adoption of cloud-based solutions. Utilities are increasingly turning to cloud-based platforms to enable remote work and collaboration, as well as to improve the efficiency and reliability of their operations. Cloud-based solutions offer a range of benefits, including scalability, flexibility, and cost-effectiveness, making them an attractive option for utilities looking to modernize their communication systems.
Impact of Russia-Ukraine War:
The Russia-Ukraine war has disrupted the flow of goods and services between the two countries, causing a ripple effect throughout the industry. One of the most significant impacts has been on the supply of critical components used in utility communication systems. Many of these components are manufactured in Russia, and the conflict has disrupted their production and transportation to Ukraine. This has led to shortages and delays in the delivery of these components, which has had an effect on the entire industry.
Impact of Recession:
The current economic downturn has led to a decrease in the number of new utility projects being initiated. This has further reduced the demand for communication services, as fewer new projects mean fewer opportunities for companies to provide their services. Detailed analysis is comprised in the final report.
Key Market Segmentation
By Technology:
-
Wired
-
Wireless
By Utility:
-
Public
-
Private
By Component:
-
Software
-
Hardware
By End-user:
-
Residential
-
Industrial
-
Commercial
By Application:
-
Oil & Gas Utilities
-
Transmission & Distribution
-
Others
.png)
Do You Need any Customization Research on Utility Communication Market - Enquire Now
Regional Analysis
Asia Pacific region dominated the Utility communication market and is expected to lead this market during the forecast period. This dominance is attributed to the region's large population, rapid urbanization, and increasing demand for reliable and efficient energy services.
One of the key drivers of the utility communication market in the Asia Pacific region is the growing need for smart grid technologies. As countries in the region continue to develop and modernize their energy infrastructure, there is a growing demand for advanced communication systems that can support the integration of renewable energy sources, improve grid reliability, and enhance energy efficiency. Another factor contributing to the dominance of the Asia Pacific region in the utility communication market is the increasing adoption of Internet of Things (IoT) technologies. With the proliferation of connected devices and sensors, utilities in the region are leveraging IoT to improve their operations, reduce costs, and enhance customer service. Moreover, the Asia Pacific region is home to some of the world's largest utility companies, which have been investing heavily in communication technologies to improve their operations and stay competitive. These companies have been at the forefront of innovation in the utility communication market, driving the development of new technologies and solutions that are transforming the industry.
REGIONAL COVERAGE:
-
North America
-
USA
-
Canada
-
Mexico
-
-
Europe
-
Germany
-
UK
-
France
-
Italy
-
Spain
-
The Netherlands
-
Rest of Europe
-
-
Asia-Pacific
-
Japan
-
south Korea
-
China
-
India
-
Australia
-
Rest of Asia-Pacific
-
-
The Middle East & Africa
-
Israel
-
UAE
-
South Africa
-
Rest of Middle East & Africa
-
-
Latin America
-
Brazil
-
Argentina
-
Rest of Latin America
-
Key Players
The major players are Schneider Electric, ABB, Ltd., Siemens Ag, General Electric, Motorola Solutions, Emerson, Rockwell Automation, Hitachi, Toshiba, Azbil Corporation, and other key players will be included in the final report.
Siemens Ag-Company Financial Analysis
| Report Attributes | Details |
| Market Size in 2023 | US$ 20.3 Bn |
| Market Size by 2032 | US$ 33.70 Bn |
| CAGR | CAGR of 5.2% From 2024 to 2032 |
| Base Year | 2022 |
| Forecast Period | 2024-2032 |
| Historical Data | 2020-2022 |
| Report Scope & Coverage | Market Size, Segments Analysis, Competitive Landscape, Regional Analysis, DROC & SWOT Analysis, Forecast Outlook |
| Key Segments | • By Technology (Wired and Wireless) • By Utility (Public and Private) • By Component (Software and Hardware) • By End-user (Residential, Industrial, and Commercial) • By Application (Oil & Gas Utilities, Transmission & Distribution, and Others) |
| Regional Analysis/Coverage | North America (USA, Canada, Mexico), Europe (Germany, UK, France, Italy, Spain, Netherlands, Rest of Europe), Asia-Pacific (Japan, South Korea, China, India, Australia, Rest of Asia-Pacific), The Middle East & Africa (Israel, UAE, South Africa, Rest of Middle East & Africa), Latin America (Brazil, Argentina, Rest of Latin America) |
| Company Profiles | Schneider Electric, ABB, Ltd., Siemens Ag, General Electric, Motorola Solutions, Emerson, Rockwell Automation, Hitachi, Toshiba, Azbil Corporation |
| Key Drivers | • Growing demand for efficient and reliable communication systems • Rising demand for energy |
| Market Opportunities | • Emergence of advanced communication technologies such as 5G and the Internet of Things (IoT) |
Frequently Asked Questions
Increasing demand for reliable and efficient communication systems, rising demand for energy, growing adoption of smart grid technologies, and need for real-time monitoring and control of utility networks are the growth factors of Utility Communication Market.
Asia-Pacific region dominated the Utility Communication Market.
The major key players in the Utility Communication Market are Schneider Electric, ABB, Ltd., Siemens Ag, General Electric, Motorola Solutions, Emerson, Rockwell Automation, Hitachi, Toshiba, Azbil Corporation.
The market size of the Utility Communication Market is USD 20.3 billion in 2022.
The expected CAGR of the global Utility Communication Market during the forecast period is 5.2%.
Get in Touch
