image

Wind Power Market Report Scope & Overview:

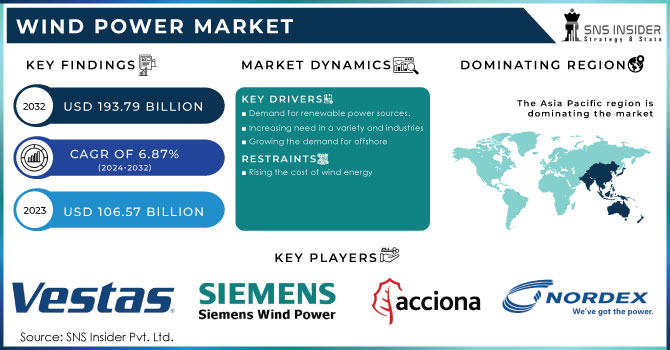
The Wind Power Market size was valued at USD 99.5 billion in 2022 and is expected to grow to USD 165.91 billion by 2030 and grow at a CAGR of 6.6 % over the forecast period of 2023-2030.

Wind energy harnesses the ambient wind and transforms the velocity of the air into mechanical energy. Different atmospheric pressures lead to wind. Season, terrain, and geography all affect wind speed. As a result, certain places are more suitable for producing wind energy than others. In general, wind speeds are faster close to the coast and offshore because there are less obstructions to slow them down, such as vegetation, mountains, and buildings.

Wind Power Market Revenue Analysis

  When some areas of the rocky surface of the Earth receive a different quantity of light than others nearby and cool or heat more quickly, wind is created. Air travels over the planet, gaining or losing speed as it crosses rivers and valleys, balancing the variations like mixing hot and cold water in a bathtub. You guessed it, that produces wind. Birds may be propelled through the air by wind, ships can travel across the ocean, and trees can even be uprooted by it. The act of moving wind turbine blades is simple in compared to all that. Electricity is produced by the turbines' rotation.

MARKET DYNAMICS

KEY DRIVERS:  

  • Demand for renewable power sources.

  • Increasing need in variety and industries

  • Growing the demand for offshore

Many governments all over the globe have implemented policies to encourage the growth of wind energy, including feed-in tariffs, tax rebates, and renewable portfolio standards. These regulations have significantly increased the industry's growth and made wind power a more appealing investment.

RESTRAIN:

  • Rising the cost of wind energy

The wind energy has become less expensive recently, it is still more expensive than certain other energy sources, such coal or natural gas. Due to this, wind power may find it challenging to compete in the electricity market.

OPPORTUNITY: 

  • Technological advancement for offshore installation

CHALLENGES:

  • Grid integration

  • Intermittency

Since wind energy is a fluctuating source of energy, its output might change depending on the wind's direction and speed. This can make it challenging to incorporate wind energy into the electrical grid and, if there is not enough wind energy to fulfil demand.

IMPACT OF RUSSIAN UKRAINE WAR

According to the Energy Information Administration, about half of the power produced in the United States from renewable sources last year came from wind energy. The country's use of wind energy has increased significantly over the past two decades, going from 0.2% to 9.2% of all power produced during that time. According to the International Energy Agency, the ongoing Russian invasion of Ukraine, which is in its seventh month, has shaken up the world's energy markets and increased worries about the security and availability of energy globally.

IMPACT OF ONGOING RECESSION

A decline in wind project completions by 2022, however despite a continued Chinese boom in both onshore and offshore wind, this decline was mostly caused by delays to US offshore projects, a slowdown in onshore permits in the US and Europe, and delays to US offshore projects. In September that China revealed rife offshore wind deployments, with increased capacity for the half-year coming in at 6.8 GW, accounting for 78% of all new additions worldwide. Further development was also seen in South Korea and Vietnam, two other countries in Asia.

KEY MARKET SEGMENTS

By Location

  • Onshore

  • Offshore

By Application

  • Utility

  • Non-utility

Wind Power Market Segmentation Analysis

REGIONAL ANALYSIS

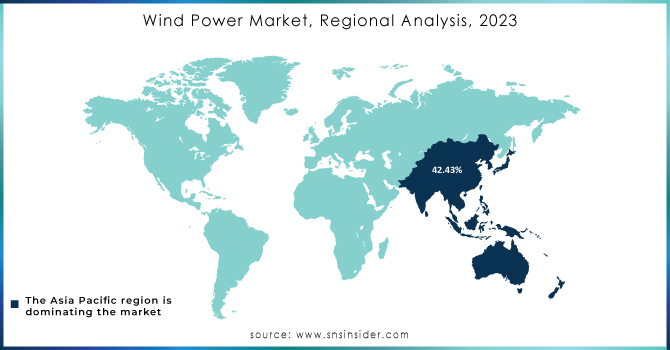
More than 42.43% of global revenue in 2021 came from the Asia Pacific area, and this dominance is anticipated to persist throughout the projection period. Due to continued actions and expenditures made by the government to support industrial growth, China has the highest installation in the area.

China's onshore wind sector is expected to grow gradually over the next few years as the country's leadership promotes the development of renewable infrastructure in an effort to minimise the importance of thermal power and lower pollution levels in the nation's power production. This will probably affect how quickly wind energy projects are completed in the nation, which is expected to fuel industry expansion. 

REGIONAL COVERAGE:

North America

  • US

  • Canada

  • Mexico

Europe

  • Eastern Europe

    • Poland

    • Romania

    • Hungary

    • Turkey

    • Rest of Eastern Europe

  • Western Europe

    • Germany

    • France

    • UK

    • Italy

    • Spain

    • Netherlands

    • Switzerland

    • Austria

    • Rest of Western Europe

Asia Pacific

  • China

  • India

  • Japan

  • South Korea

  • Vietnam

  • Singapore

  • Australia

  • Rest of Asia Pacific

Middle East & Africa

  • Middle East

    • UAE

    • Egypt

    • Saudi Arabia

    • Qatar

    • Rest of Middle East

  • Africa

    • Nigeria

    • South Africa

    • Rest of Africa

Latin America

  • Brazil

  • Argentina

  • Colombia

  • Rest of Latin America

RECENT DEVELOPMENT

  • Suzlon Group received a fresh order in October 2022 from the Aditya Birla Group to construct 144.9 MW wind power projects at locations in Gujarat and Madhya Pradesh. A total of 69 wind turbine generators (Wind Turbines) with a Hybrid Lattice Tubular (HLT) tower and a rated capacity of 2.1 MW will be installed as part of the contract by the firm. It's anticipated to start up business before the end of 2023.

  • May 20222 saw the announcement by India's Minister for Power and New & Renewable Energy of intentions to have 30,000 MW of India's offshore wind energy.

  • In October 2021, USW Energy Ltd., a subsidiary of the regional conglomerate JSW Group, awarded GE Renewable Energy a contract. For its planned projects in Tamil Nadu, JSW has bought 810 MW of onshore wind turbines as part of the deal.    

KEY PLAYERS 

GE Wind, Vestas, Siemens Wind Power, Suzlon Group, Goldwind, United Power, Acciona, Nordex SE, Sinovel Wind Group, EDF Renewable Energy, ReGen Powertech, Vensys Energy, ABB Limited, NextEra Energy Inc., Northland Power Inc., DONG Energy and other players are listed in a final report.

Siemens Wind Power-Company Financial Analysis

Company Landscape Analysis

Wind Power Market Report Scope:
Report Attributes Details
Market Size in 2022  US$ 99.5 Bn
Market Size by 2030  US$ 165.91 Bn
CAGR   CAGR of 6.6 % From 2023 to 2030
Base Year 2022
Forecast Period  2023-2030
Historical Data  2020-2021
Report Scope & Coverage Market Size, Segments Analysis, Competitive  Landscape, Regional Analysis, DROC & SWOT Analysis, Forecast Outlook
Key Segments • By Location (Onshore, Offshore), By Application (Utility, Non-utility)
Regional Analysis/Coverage North America (US, Canada, Mexico), Europe (Eastern Europe [Poland, Romania, Hungary, Turkey, Rest of Eastern Europe] Western Europe] Germany, France, UK, Italy, Spain, Netherlands, Switzerland, Austria, Rest of Western Europe]). Asia Pacific (China, India, Japan, South Korea, Vietnam, Singapore, Australia, Rest of Asia Pacific), Middle East & Africa (Middle East [UAE, Egypt, Saudi Arabia, Qatar, Rest of Middle East], Africa [Nigeria, South Africa, Rest of Africa], Latin America (Brazil, Argentina, Colombia Rest of Latin America)
Company Profiles GE Wind, Vestas, Siemens Wind Power, Suzlon Group, Goldwind, United Power, Acciona, Nordex SE, Sinovel Wind Group, EDF Renewable Energy, ReGen Powertech, Vensys Energy, ABB Limited, NextEra Energy Inc., Northland Power Inc., DONG Energy
Key Drivers • Demand for renewable power sources.
• Increasing need in variety and industries
• Growing the demand for offshore
Market Restraints • Rising the cost of wind energy


Frequently Asked Questions

Ans: Wind Power Market is anticipated to expand by 6.6 % from 2023 to 2030.

Ans:  USD 165.91 billion is expected to grow by 2030.

Ans: Wind Power Market size was valued at USD 99.5 billion in 2022

Ans: Acia Pacific is dominating the market.

Ans: Demand for renewable power sources, increasing need in variety and industries, and growing the demand for offshore.

TABLE OF CONTENT

1. Introduction
1.1 Market Definition
1.2 Scope
1.3 Research Assumptions

2. Research Methodology

3. Market Dynamics
3.1 Drivers
3.2 Restraints
3.3 Opportunities
3.4 Challenges

4. Impact Analysis
4.1 Impact of the Russia-Ukraine War
4.2 Impact of Ongoing Recession
4.2.1 Introduction
4.2.2 Impact on major economies
4.2.2.1 US
4.2.2.2 Canada
4.2.2.3 Germany
4.2.2.4 France
4.2.2.5 United Kingdom
4.2.2.6 China
4.2.2.7 Japan
4.2.2.8 South Korea
4.2.2.9 Rest of the World

5. Value Chain Analysis

6. Porter’s 5 forces model

7. PEST Analysis

8. Wind Power Market Segmentation, By Location
8.1 Onshore
8.2 Offshore

9. Wind Power Market Segmentation, By Application
9.1 Utility
9.2 Non-utility

10. Regional Analysis
10.1 Introduction
10.2 North America
10.2.1 North America Wind Power Market by Country
10.2.2North America Wind Power Market by Location
10.2.3 North America Wind Power Market by Application
10.2.4 USA
10.2.4.1 USA Wind Power Market by Location
10.2.4.2 USA Wind Power Market by Application
10.2.5 Canada
10.2.5.1 Canada Wind Power Market by Location
10.2.5.2 Canada Wind Power Market by Application
10.2.6 Mexico
10.2.6.1 Mexico Wind Power Market by Location
10.2.6.2 Mexico Wind Power Market by Application
10.3 Europe
10.3.1 Eastern Europe
10.3.1.1 Eastern Europe Wind Power Market by Country
10.3.1.2 Eastern Europe Wind Power Market by Location
10.3.1.3 Eastern Europe Wind Power Market by Application
10.3.1.4 Poland
10.3.1.4.1 Poland Wind Power Market by Location
10.3.1.4.2 Poland Wind Power Market by Application
10.3.1.5 Romania
10.3.1.5.1 Romania Wind Power Market by Location
10.3.1.5.2 Romania Wind Power Market by Application
10.3.1.6 Hungary
10.3.1.6.1 Hungary Wind Power Market by Location
10.3.1.6.2 Hungary Wind Power Market by Application
10.3.1.7 Turkey
10.3.1.7.1 Turkey Wind Power Market by Location
10.3.1.7.2 Turkey Wind Power Market by Application
10.3.1.8 Rest of Eastern Europe
10.3.1.8.1 Rest of Eastern Europe Wind Power Market by Location
10.3.1.8.2 Rest of Eastern Europe Wind Power Market by Application
10.3.2 Western Europe
10.3.2.1 Western Europe Wind Power Market by Country
10.3.2.2 Western Europe Wind Power Market by Location
10.3.2.3 Western Europe Wind Power Market by Application
10.3.2.4 Germany
10.3.2.4.1 Germany Wind Power Market by Location
10.3.2.4.2 Germany Wind Power Market by Application
10.3.2.5 France
10.3.2.5.1 France Wind Power Market by Location
10.3.2.5.2 France Wind Power Market by Application
10.3.2.6 UK
10.3.2.6.1 UK Wind Power Market by Location
10.3.2.6.2 UK Wind Power Market by Application
10.3.2.7 Italy
10.3.2.7.1 Italy Wind Power Market by Location
10.3.2.7.2 Italy Wind Power Market by Application
10.3.2.8 Spain
10.3.2.8.1 Spain Wind Power Market by Location
10.3.2.8.2 Spain Wind Power Market by Application
10.3.2.9 Netherlands
10.3.2.9.1 Netherlands Wind Power Market by Location
10.3.2.9.2 Netherlands Wind Power Market by Application
10.3.2.10 Switzerland
10.3.2.10.1 Switzerland Wind Power Market by Location
10.3.2.10.2 Switzerland Wind Power Market by Application
10.3.2.11 Austria
10.3.2.11.1 Austria Wind Power Market by Location
10.3.2.11.2 Austria Wind Power Market by Application
10.3.2.12 Rest of Western Europe
10.3.2.12.1 Rest of Western Europe Wind Power Market by Location
10.3.2.12.2 Rest of Western Europe Wind Power Market by Application
10.4 Asia-Pacific
10.4.1 Asia Pacific Wind Power Market by Country
10.4.2 Asia Pacific Wind Power Market by Location
10.4.3 Asia Pacific Wind Power Market by Application
10.4.4 China
10.4.4.1 China Wind Power Market by Location
10.4.4.2 China Wind Power Market by Application
10.4.5 India
10.4.5.1 India Wind Power Market by Location
10.4.5.2 India Wind Power Market by Application
10.4.6 Japan
10.4.6.1 Japan Wind Power Market by Location
10.4.6.2 Japan Wind Power Market by Application
10.4.7 South Korea
10.4.7.1 South Korea Wind Power Market by Location
10.4.7.2 South Korea Wind Power Market by Application
10.4.8 Vietnam
10.4.8.1 Vietnam Wind Power Market by Location
10.4.8.2 Vietnam Wind Power Market by Application
10.4.9 Singapore
10.4.9.1 Singapore Wind Power Market by Location
10.4.9.2 Singapore Wind Power Market by Application
10.4.10 Australia
10.4.10.1 Australia Wind Power Market by Location
10.4.10.2 Australia Wind Power Market by Application
10.4.11 Rest of Asia-Pacific
10.4.11.1 Rest of Asia-Pacific Wind Power Market by Location
10.4.11.2 Rest of Asia-Pacific APAC Wind Power Market by Application
10.5 Middle East & Africa
10.5.1 Middle East
10.5.1.1 Middle East Wind Power Market by Country
10.5.1.2 Middle East Wind Power Market by Location
10.5.1.3 Middle East Wind Power Market by Application
10.5.1.4 UAE
10.5.1.4.1 UAE Wind Power Market by Location
10.5.1.4.2 UAE Wind Power Market by Application
10.5.1.5 Egypt
10.5.1.5.1 Egypt Wind Power Market by Location
10.5.1.5.2 Egypt Wind Power Market by Application
10.5.1.6 Saudi Arabia
10.5.1.6.1 Saudi Arabia Wind Power Market by Location
10.5.1.6.2 Saudi Arabia Wind Power Market by Application
10.5.1.7 Qatar
10.5.1.7.1 Qatar Wind Power Market by Location
10.5.1.7.2 Qatar Wind Power Market by Application
10.5.1.8 Rest of Middle East
10.5.1.8.1 Rest of Middle East Wind Power Market by Location
10.5.1.8.2 Rest of Middle East Wind Power Market by Application
10.5.2 Africa
10.5.2.1 Africa Wind Power Market by Country
10.5.2.2 Africa Wind Power Market by Location
10.5.2.3 Africa Wind Power Market by Application
10.5.2.4 Nigeria
10.5.2.4.1 Nigeria Wind Power Market by Location
10.5.2.4.2 Nigeria Wind Power Market by Application
10.5.2.5 South Africa
10.5.2.5.1 South Africa Wind Power Market by Location
10.5.2.5.2 South Africa Wind Power Market by Application
10.5.2.6 Rest of Africa
10.5.2.6.1 Rest of Africa Wind Power Market by Location
10.5.2.6.2 Rest of Africa Wind Power Market by Application
10.6 Latin America
10.6.1 Latin America Wind Power Market by Country
10.6.2 Latin America Wind Power Market by Location
10.6.3 Latin America Wind Power Market by Application
10.6.4 Brazil
10.6.4.1 Brazil Wind Power Market by Location
10.6.4.2 Brazil Africa Wind Power Market by Application
10.6.5 Argentina
10.6.5.1 Argentina Wind Power Market by Location
10.6.5.2 Argentina Wind Power Market by Application
10.6.6 Colombia
10.6.6.1 Colombia Wind Power Market by Location
10.6.6.2 Colombia Wind Power Market by Application
10.6.7 Rest of Latin America
10.6.7.1 Rest of Latin America Wind Power Market by Location
10.6.7.2 Rest of Latin America Wind Power Market by Application

11 Company Profile
11.1 GE Wind
11.1.1 Company Overview
11.1.2 Financials
11.1.3 Product/Services Offered
11.1.4 SWOT Analysis
11.1.5 The SNS View
11.2 Vestas
11.2.1 Company Overview
11.2.2 Financials
11.2.3 Product/Services Offered
11.2.4 SWOT Analysis
11.2.5 The SNS View
11.3 Siemens Wind Power
11.3.1 Company Overview
11.3.2 Financials
11.3.3 Product/Services Offered
11.3.4 SWOT Analysis
11.3.5 The SNS View
11.4 Suzlon Group
11.4 Company Overview
11.4.2 Financials
11.4.3 Product/Services Offered
11.4.4 SWOT Analysis
11.4.5 The SNS View
11.5 Goldwind
11.5.1 Company Overview
11.5.2 Financials
11.5.3 Product/Services Offered
11.5.4 SWOT Analysis
11.5.5 The SNS View
11.6 United Power
11.6.1 Company Overview
11.6.2 Financials
11.6.3 Product/Services Offered
11.6.4 SWOT Analysis
11.6.5 The SNS View
11.7 Acciona
11.7.1 Company Overview
11.7.2 Financials
11.7.3 Product/Services Offered
11.7.4 SWOT Analysis
11.7.5 The SNS View
11.8 Nordex SE
11.8.1 Company Overview
11.8.2 Financials
11.8.3 Product/Services Offered
11.8.4 SWOT Analysis
11.8.5 The SNS View
11.9 Sinovel Wind Group
11.9.1 Company Overview
11.9.2 Financials
11.9.3 Product/ Services Offered
11.9.4 SWOT Analysis
11.9.5 The SNS View
11.10 EDF Renewable Energy
11.10.1 Company Overview
11.10.2 Financials
11.10.3 Product/Services Offered
11.10.4 SWOT Analysis
11.10.5 The SNS View
11.11 ReGen Powertech
11.11.1 Company Overview
11.11.2 Financials
11.11.3 Product/Services Offered
11.11.4 SWOT Analysis
11.11.5 The SNS View
11.12 Vensys Energy
11.12.1 Company Overview
11.12.2 Financials
11.12.3 Product/Services Offered
11.12.4 SWOT Analysis
11.12.5 The SNS View
11.13 ABB Limited
11.13.1 Company Overview
11.13.2 Financials
11.13.3 Product/Services Offered
11.13.4 SWOT Analysis
11.13.5 The SNS View
11.14 NextEra Energy Inc.
11.14.1 Company Overview
11.14.2 Financials
11.14.3 Product/Services Offered
11.14.4 SWOT Analysis
11.14.5 The SNS View
11.15 Northland Power Inc.
11.15.1 Company Overview
11.15.2 Financials
11.15.3 Product/Services Offered
11.15.4 SWOT Analysis
11.15.5 The SNS View
11.16 DONG Energy
11.16.1 Company Overview
11.16.2 Financials
11.16.3 Product/Services Offered
11.16.4 SWOT Analysis
11.16.5 The SNS View

12. Competitive Landscape
12.1 Competitive Bench marking
12.2 Market Share Analysis
12.3 Recent Developments
12.3.1 Industry News
12.3.2 Company News
12.3.3 Mergers & Acquisitions

13. USE Cases and Best Practices

14. Conclusion

An accurate research report requires proper strategizing as well as implementation. There are multiple factors involved in the completion of good and accurate research report and selecting the best methodology to compete the research is the toughest part. Since the research reports we provide play a crucial role in any company’s decision-making process, therefore we at SNS Insider always believe that we should choose the best method which gives us results closer to reality. This allows us to reach at a stage wherein we can provide our clients best and accurate investment to output ratio.

Each report that we prepare takes a timeframe of 350-400 business hours for production. Starting from the selection of titles through a couple of in-depth brain storming session to the final QC process before uploading our titles on our website we dedicate around 350 working hours. The titles are selected based on their current market cap and the foreseen CAGR and growth.


The 5 steps process:

Step 1: Secondary Research:

Secondary Research or Desk Research is as the name suggests is a research process wherein, we collect data through the readily available information. In this process we use various paid and unpaid databases which our team has access to and gather data through the same. This includes examining of listed companies’ annual reports, Journals, SEC filling etc. Apart from this our team has access to various associations across the globe across different industries. Lastly, we have exchange relationships with various university as well as individual libraries.

Secondary Research

Step 2: Primary Research

When we talk about primary research, it is a type of study in which the researchers collect relevant data samples directly, rather than relying on previously collected data.  This type of research is focused on gaining content specific facts that can be sued to solve specific problems. Since the collected data is fresh and first hand therefore it makes the study more accurate and genuine.

We at SNS Insider have divided Primary Research into 2 parts.

Part 1 wherein we interview the KOLs of major players as well as the upcoming ones across various geographic regions. This allows us to have their view over the market scenario and acts as an important tool to come closer to the accurate market numbers. As many as 45 paid and unpaid primary interviews are taken from both the demand and supply side of the industry to make sure we land at an accurate judgement and analysis of the market.

This step involves the triangulation of data wherein our team analyses the interview transcripts, online survey responses and observation of on filed participants. The below mentioned chart should give a better understanding of the part 1 of the primary interview.

Primary Research

Part 2: In this part of primary research the data collected via secondary research and the part 1 of the primary research is validated with the interviews from individual consultants and subject matter experts.

Consultants are those set of people who have at least 12 years of experience and expertise within the industry whereas Subject Matter Experts are those with at least 15 years of experience behind their back within the same space. The data with the help of two main processes i.e., FGDs (Focused Group Discussions) and IDs (Individual Discussions). This gives us a 3rd party nonbiased primary view of the market scenario making it a more dependable one while collation of the data pointers.

Step 3: Data Bank Validation

Once all the information is collected via primary and secondary sources, we run that information for data validation. At our intelligence centre our research heads track a lot of information related to the market which includes the quarterly reports, the daily stock prices, and other relevant information. Our data bank server gets updated every fortnight and that is how the information which we collected using our primary and secondary information is revalidated in real time.

Data Bank Validation

Step 4: QA/QC Process

After all the data collection and validation our team does a final level of quality check and quality assurance to get rid of any unwanted or undesired mistakes. This might include but not limited to getting rid of the any typos, duplication of numbers or missing of any important information. The people involved in this process include technical content writers, research heads and graphics people. Once this process is completed the title gets uploader on our platform for our clients to read it.

Step 5: Final QC/QA Process:

This is the last process and comes when the client has ordered the study. In this process a final QA/QC is done before the study is emailed to the client. Since we believe in giving our clients a good experience of our research studies, therefore, to make sure that we do not lack at our end in any way humanly possible we do a final round of quality check and then dispatch the study to the client.

Start a Conversation

Hi! Click one of our member below to chat on Phone