3D XPoint Technology Market Report Scope & Overview:
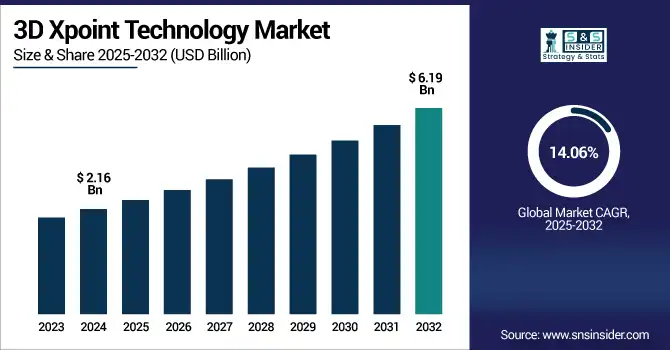
The 3D Xpoint Technology Market size was valued at USD 2.16 Billion in 2024 and is projected to reach USD 6.19 Billion by 2032, growing at a CAGR of 14.06% during 2025-2032. The 3D XPoint technology is offering unique low latency, high endurance & non-volatile memory solution which addresses need of critical application segments. 3D XPoint sits between DRAM and NAND flash in terms of performance, and is widely used in enterprise storage, in-memory computing, AI acceleration and database management. This in turn allows fast boot times, real-time analytics and more efficient servers, all of which have become possible by supporting persistent memory architectures. It offers high throughput for data-heavy workloads in areas like finance, healthcare, cloud computing, and scientific research. While there are few competitors in this niche, 3D XPoint remains relevant especially in use cases where the memory must be extremely fast and endurance beats everything, for example hybrid memory and next-generation computing infrastructure.
Intel ceases shipments of its Optane Persistent Memory 200-series DIMMs in July 2024, but its 3D XPoint-based products enter final phase-out by the end of 2025. While new production has terminated, still-available stock (comprising 128GB restoring 512GB modules) will proceed to be offered through last-time buys until the finish of 2024.
3D XPoint Technology Market Size and Forecast:
-
Market Size in 2024: USD 2.16 Billion
-
Market Size by 2032: USD 6.19 Billion
-
CAGR: 14.06% from 2025 to 2032
-
Base Year: 2024
-
Forecast Period: 2025–2032
-
Historical Data: 2021–2023
To Get more information on 3D Xpoint Technology Market - Request Free Sample Report
The U.S 3D Xpoint Technology Market size was valued at USD 1.49 Billion in 2024 and is projected to reach USD 3.94 Billion by 2032, growing at a CAGR of 12.97% during 2025-2032. This 3D Xpoint Technology Market growth can be attributed to the increasing demand for high speed storage systems for various applications within enterprise IT, cloud computing and real-time analytics. BFSI, healthcare, and government are critical sectors that are increasingly adopting these types of technologies that require persistent memory and low-latency access. AI workloads, database acceleration, and hybrid memory architectures have also landed in the market from integration. Another factor enhancing the growth of the market in the forecast period is a high R&D investment, adoption of efficient data centres, and developments in server technologies.
The 3D Xpoint Technology Market Trends include growing integration of persistent memory in data centers to enhance performance and reduce latency for AI, analytics, and in-memory databases. The shift toward hybrid memory systems combining DRAM and 3D XPoint is expanding due to its superior endurance and speed. Rising demand for real-time computing in sectors like healthcare, BFSI, and telecom is accelerating adoption. Additionally, energy-efficient data storage and reduced total cost of ownership are becoming critical factors, driving interest in 3D XPoint for next-generation enterprise infrastructure solutions.
3D XPoint Technology Market Trends
-
Growing demand for high-performance and low-latency memory solutions in data centers, artificial intelligence (AI), and high-performance computing (HPC) environments is driving adoption of 3D XPoint technology.
-
Increasing deployment of real-time analytics, big data workloads, and edge computing applications is accelerating the need for memory technologies that bridge the gap between DRAM and NAND flash.
-
Rising integration of 3D XPoint-based storage-class memory in enterprise servers and cloud infrastructure is enhancing system responsiveness, scalability, and workload efficiency.
-
Expansion of AI, machine learning, and in-memory computing applications is boosting demand for persistent memory solutions with higher endurance and faster data access speeds.
-
Advancements in non-volatile memory architectures and innovations in next-generation memory technologies are supporting improved performance density and power efficiency.
-
Growing investments in data center modernization and digital transformation initiatives across industries are contributing to increased adoption of advanced memory solutions.
-
Trends toward hybrid memory-storage architectures and next-generation computing platforms are strengthening the role of 3D XPoint technology in enterprise and mission-critical environments.
3D Xpoint Technology Market Drivers:
-
Accelerating Demand for High-Speed, Non-Volatile Memory Technologies
Increasing demand for ultra-fast high-endurance and permanent memory solutions in data centers, AI, high-performance computing (HPC), and enterprise storage is fueling the growth of the global 3D Xpoint Technology Market. Traditional memory architectures are running into performance roadblocks as workloads become increasingly data-centric. 3D XPoint is a Memory, which was used in Critical performance gap between DRAM and NAND With Access speeds similar to DRAM, Write endurance ranging from 1000 times higher than NAND, and Ultra-Low Latency. Strong growth in the speed, scale, and availability of applications demanding speed, scalability, and reliability drive this phenomenal growth as its gives the ability to immediate data processing, enhances system responsiveness, and reduces total latency, which makes it a critical component for next-gen computing infrastructure.
In 2024, Numemory (China) announced its NM101 storage-class memory chip, based on Optane-like phase-change and crossbar tech, with 10× higher speeds and 5× higher endurance compared to NAND. With ¥10B ($70M) funding, aims 10,000 unit/month mass production by end-2025
3D Xpoint Technology Market Restraints:
-
High Production Costs and Manufacturing Complexity Limit Adoption
High production cost and manufacturing complexity of phase change memory is one of the main restraining factors for 3D Xpoint Technology Market. 3D XPoint's complex structure requires highly specialized materials and sophisticated fabrication technologies, which makes it orders of magnitude more costly than traditional NAND or DRAM. This cost hurdle creates a barrier to mass-market scalability, dissuading broad consumer application adoption for local optics. What this means, in practice, is that the high capital expenditure and operational challenge of actually producing 3D XPoint at scale severely limits the number of players who have the capacity to produce 3D XPoint at scale and thus makes it very hard for competitive pricing and market penetration overall.
3D Xpoint Technology Market Opportunities:
-
Rising Demand for High-Speed, Scalable Memory Solutions Fuels Market Opportunity
The high-speed, high-endurance nature of 3D XPoint memory has opened new applications that address the need between DRAM and NAND, which are expected to drive demand for the 3D Xpoint Technology Market. With surging workloads in AI, machine learning, data analytics and high-performance computing across every industry, we need memory solutions that serve up ultra-fast access speeds, low latency, and non-volatility. The 3D XPoint technology also features higher density and increased durability, thus providing perfect opportunities for adoption in areas such as data center, enterprise storage, and edge computing. Its scalable architecture will also allow future innovation in advanced computing and storage hierarchies.
Sandisk is also working on a Project Neo in collaboration with IMEC, which is an interesting 3D Matrix Memory, potentially phase-change based. The initiative, spearheaded by former Intel Optane chief Alper Ilkbahar, is a sign of life for 3D XPoint memory tech.
3D Xpoint Technology Market Challenges:
-
High Development Costs and Integration Complexities Limit 3D XPoint Market Adoption
High production cost and low acceptance of industry in the 3D Xpoint Technology Market are the major round-up challenges. Because the technology requires advanced manufacturing techniques that are often very difficult to reproduce and involve specialized methods of integration, the cost per bit is still higher than NAND and limits the widespread use of the technology to pure economics. Lastly, non-uniform memory access (NUMA) is not widely used, poorly supported with existing memory interfaces, and scalability is limited by an insufficient ecosystem of supporting hardware and software. These barriers deter OEMs and developers, slowing innovation and investment ultimately affecting the technology's commercial viability and holding back its market potential.
3D Xpoint Technology Market Segmentation Outlook:
By Storage Type
In 2024, the Standalone segment accounted for approximately 64% of the 3D Xpoint Technology market share, due to its' ability to operate independently from other memory systems. It provides faster read/write speeds, lower latency, and higher endurance than traditional storage, making it suitable for data centers and high-performance computing environments. It is also preferred in applications demanding high-capacity memory with stable performance like AI, machine learning and big data analytics. These advantages keep catering to its strong footprint in the market with increased demand.
The Hybrid segment is expected to experience the fastest growth in 3D Xpoint Technology market over 2025-2032 with a CAGR of 17.18% , owing to the growing demand for 3D Xpoint memory solutions which have a competitive performance-to-cost ratio advantages over DRAM and NAND. Hybrid architectures provide the capability to easily integrate into current infrastructures, while approaching gains in speed, endurance, and non-volatility. Market momentum is buoyed by their growing use across enterprise storage, AI computing, and next-gen server platforms making them the go-to choice for ever-evolving data-intensive workloads.
By Type
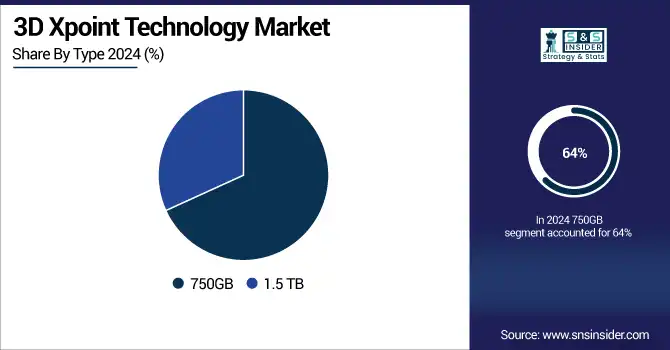
In 2024, the 750GB segment accounted for approximately 64% of the 3D Xpoint Technology market share, owing to the right equation between performance, storage and price. The performance spectrum occupies this capacity range that enjoys massive uptake in the form of enterprise and data center applications requiring both high-speed access and reliability,while ultra-high capacities are not yet deemed necessary. Demand for 750GB solutions due to its compatibility with existing infrastructure and demand from high-performance computing, AI workloads, and low-latency applications has led their integration across varied industry verticals.
The 1.5 TB segment is expected to experience the fastest growth in 3D Xpoint Technology market over 2025-2032 with a CAGR of 20.08%, due to growing requirement for high-capacity and low-latency memory solutions in high-performance computing settings like cloud infrastructure, AI training and big data analytics. This segment is appealing as it will give more speed and longevity for the money support for larger datasets makes it suited for memory-dependent enterprise workloads With performance and scalable solutions being the priority for organizations, we expect the adoption of 1.5TB XPoint modules to significantly increase across various verticals.
By Application
In 2024, the Enterprise Storage segment accounted for approximately 39% of the 3D Xpoint Technology market share, owing to its use in high-performance data centers and server infrastructures. XPoint also provides the ultra-fast performance and high durability for real-time analytics workloads, virtualization and transactions that segment historically does well with. This trend was accelerated by increasing demand from hyperscale cloud developers and enterprises looking for quick and efficient access to data over cost-efficient and scalable storage. With businesses planning to spend even more on digital transformation, enterprise storage remains the single largest application area for 3D XPoint deployments across multiple sectors.
The Automotive segment is expected to experience the fastest growth in 3D Xpoint Technology market over 2025-2032 with a CAGR of 20.08%, owing to increasing adoption of advanced driver assistance systems (ADAS), autonomous driving and in-vehicle infotainment. These applications need ultra-fast data processing and low-latency memory solutions, all areas where 3D XPoint shines. In addition, an increasing requirement for edge computing in vehicles and real-time data analytics is also fueling the demand for high-speed, robust memory such as 3D XPoint, which is primarily deploying in electric and connected vehicles in North America, Europe, and Asia Pacific.
By End User
In 2024, the IT and Telecommunications segment accounted for approximately 37% of the 3D Xpoint Technology market share, due to the growing need for high-speed data access, low-latency performance, and memory-efficient solutions for data centers and communication infrastructure. The sector continues to drive demand for 3D XPoint memory due to a focus on improving areas such as cloud computing, 5G rollout, and big data analytics.' Moreover, with growing digital traffic and network workloads requiring management, the need for scalable, energy-efficient storage has positioned 3D XPoint as the prominent strategic choice within international IT and telecom enterprises.
The Retail segment is expected to experience the fastest growth in 3D Xpoint Technology market over 2025-2032 with a CAGR of 16.62%, driven by increasing demand for real-time data processing, customer analytics, and personalized shopping experiences. As retailers adopt AI-powered tools, point-of-sale systems, and IoT devices, the need for fast, durable, and energy-efficient memory has surged. 3D XPoint’s ability to handle high-speed transactions and support in-memory computing makes it ideal for modern retail environments, improving inventory management, fraud detection, and overall operational efficiency.
3D Xpoint Technology Market Regional Analysis:
North America 3D Xpoint Technology Market Trends
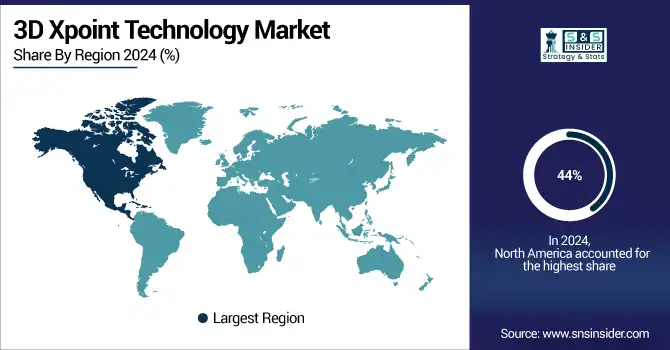
In 2024 North America dominated the 3D Xpoint Technology market and accounted for 44% of revenue share. This leadership is attributed to the region’s strong presence of major technology players, early adoption of next-generation memory solutions, and robust demand from data centers and enterprise storage applications. Significant investments in AI, IoT, and cloud infrastructure have accelerated 3D XPoint deployment across the U.S. and Canada. Additionally, favorable R&D initiatives, government support for advanced computing technologies, and growing reliance on high-speed data processing continue to bolster market growth in the region.
Asia-Pacific 3D Xpoint Technology Market Trends
Asia-Pacific is expected to witness the fastest growth in the 3D Xpoint Technology market over 2025-2032, with a projected CAGR of 15.84%. The scaling is being pushed by rising electronics manufacturing in China, Japan and South Korea as well as from higher interests in high-performance memory in AI, IoT, and 5G applications. Increased government backing for semiconductor innovation, investments in advanced memory R&D, and growing cloud infrastructure adoption will further accelerate regional growth. In addition, the Asia Pacific region is poised to have a competitive edge in the global market due to stronger industry players along with cheaper production capabilities.
Europe 3D Xpoint Technology Market Trends
In 2024, Europe emerged as a promising region in the 3D Xpoint Technology market, due to investments such as data enters, high speed computing requirements, and automotive electronics and industrial automation. Germany, France, and the Netherlands are proactively enhancing their digital infrastructure while ease semiconductor innovation with political policy design methods and R&D investments. Furthermore, Europe's digitization efforts in industries such as healthcare, manufacturing, and energy are contributing to demand for fast, long-lasting, and energy-efficient memory solutions as a key area of regional growth in the years ahead.
LATAM and MEA 3D Xpoint Technology Market Trends
LATAM and MEA are experiencing steady growth in the 3D Xpoint Technology market, supported by expanding IT infrastructure, rising cloud adoption, and digital transformation initiatives. In LATAM, countries like Brazil and Mexico are investing in data center development and industrial digitization. Meanwhile, MEA is witnessing increased adoption of advanced memory technologies in sectors such as telecom, finance, and government. Though the market size remains smaller compared to developed regions, growing technology penetration and favorable policy environments are gradually boosting demand for high-performance memory solutions.
Get Customized Report as per Your Business Requirement - Enquiry Now
3D Xpoint Technology Companies are:
-
Intel Corporation
-
Micron Technology
-
Toshiba Corporation
-
Adesto Technologies Corporation
-
Sidense Corporation
-
Crossbar Inc.
-
Mushkin Inc
-
Samsung Electronics
-
Western Digital Corporation
-
SK Hynix
-
Fujitsu Ltd.
-
Hewlett Packard Enterprise
-
IBM Corporation
-
Seagate Technology Holdings
-
Kingston Technology Corporation
-
Winbond Electronics Corporation
-
Nantero Inc.
-
Everspin Technologies Inc.and Others.
| Report Attributes | Details |
|---|---|
| Market Size in 2024 | USD 2.16 Billion |
| Market Size by 2032 | USD 6.19 Billion |
| CAGR | CAGR of 14.06% From 2024 to 2032 |
| Base Year | 2024 |
| Forecast Period | 2025-2032 |
| Historical Data | 2021-2023 |
| Report Scope & Coverage | Market Size, Segments Analysis, Competitive Landscape, Regional Analysis, DROC & SWOT Analysis, Forecast Outlook |
| Key Segments | • By Storage Type(Standalone and Hybrid) • By Type(750GB and 1.5 TB) • By Application(Consumer Electronics, Enterprise Storage, Automotive, Healthcare, Industrial and Others) • By End User (BFSI, IT and Telecommunications, Retail, Healthcare, Government and Others), |
| Regional Analysis/Coverage | North America (US, Canada), Europe (Germany, UK, France, Italy, Spain, Russia, Poland, Rest of Europe), Asia Pacific (China, India, Japan, South Korea, Australia, ASEAN Countries, Rest of Asia Pacific), Middle East & Africa (UAE, Saudi Arabia, Qatar, South Africa, Rest of Middle East & Africa), Latin America (Brazil, Argentina, Mexico, Colombia, Rest of Latin America). |
| Company Profiles | The 3D Xpoint Technology market Companies are Intel Corporation, Micron Technology, Sandisk Corporation, Toshiba Corporation, Viking Technology, Adesto Technologies Corporation, Sidense Corporation, Crossbar Inc., Mushkin Inc, Samsung Electronics, Western Digital Corporation, SK Hynix, Fujitsu Ltd., Hewlett Packard Enterprise, IBM Corporation, Seagate Technology Holdings, Kingston Technology Corporation, Winbond Electronics Corporation, Nantero Inc., Everspin Technologies Inc.and Others. |
Frequently Asked Questions
Ans: North America dominated the 3D Xpoint Application Market in 2024.
Ans: The “Standalone” segment dominated the 3D Xpoint Application Market
Ans: Rising demand for high-speed, low-latency memory in data centers, AI workloads, and enterprise storage is driving the 3D XPoint Application Market.
Ans: The 3D Xpoint Application Market size was valued at USD 2.16 Billion in 2024 and is projected to reach USD 6.19 Billion by 2032
Ans: The 3D Xpoint Application Market is expected to grow at a CAGR of 14.06% during 2025-2032.
Get in Touch
