NAND Flash Memory Market Size & Growth:
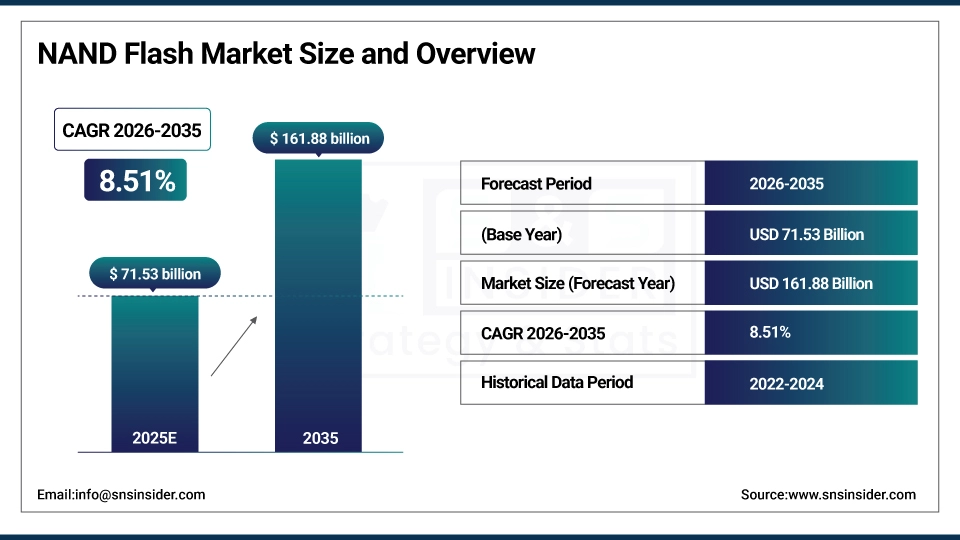
The NAND Flash Memory Market size was valued at USD 71.53 billion in 2025 and is expected to reach USD 161.88 billion by 2035, growing at a CAGR of 8.51% over the forecast period 2026-2035.
NAND Flash Memory Market expanding demand for high-performance storage supported by smartphones, data centers and solid-state drives (SSDs) The boom in smart and intelligent memory to cater to the need for rapid development of AI, 5G, and IoT applications is driving faster, denser and low power Chipset memory solution. Higher purchase and operational density due to more available stack layers in the 3D NAND increases the cost/per bit but able to address different usage scenarios. In addition, increasing adoption of automotive electronics, edge computing, and enterprise storage systems is also expected to fuel market growth. New fabrication and packaging initiatives drive the sustained growth of the market, alongside its continuous demand for reliable, secure, and compact storage capabilities.
In 2024, total global NAND flash shipments exceeded 400billionGB, of which 85% were 3D-stacked NAND; average smartphone NAND density was 256GB, with premium models exceeding 512GB show post-2023 images show post-2023 Net demand for NAND flash memory continues to grow, with a new report claiming that shipments exceeded 400billionGB and average smartphone offers are up to 256GB.
NAND Flash Memory Market Size and Forecast:
-
Market Size in 2025: USD 71.53 Billion
-
Market Size by 2035: USD 161.88 Billion
-
CAGR: 8.51% from 2026 to 2035
-
Base Year: 2025
-
Forecast Period: 2026–2035
-
Historical Data: 2022–2024
To Get more information on NAND Flash Memory Market - Request Free Sample Report
NAND Flash Memory Market Trends
-
Increasing usage of NAND Flash in smartphones, tablets, and other consumer electronics gadgets are aiding the market in achieving optimum CAGR.
-
High-capacity NAND continues to gain traction in enterprise data centers and is being lined up for cloud computing applications.
-
A surge in adoption of NAND in automotive, IoT, and industrial markets is driving further growth.
-
The transition to 3D NAND technology is improving storage density, performance, and cost effectiveness.
-
Continuous ramp in NAND consumption due to increasing use of SSDs vs. HDDs
-
Ongoing development of memory architecture and manufacturing technologies is enhancing scalability and product reliability.
-
Market competition and innovation are being strengthened through strategic partnerships and investments by semiconductor manufacturers
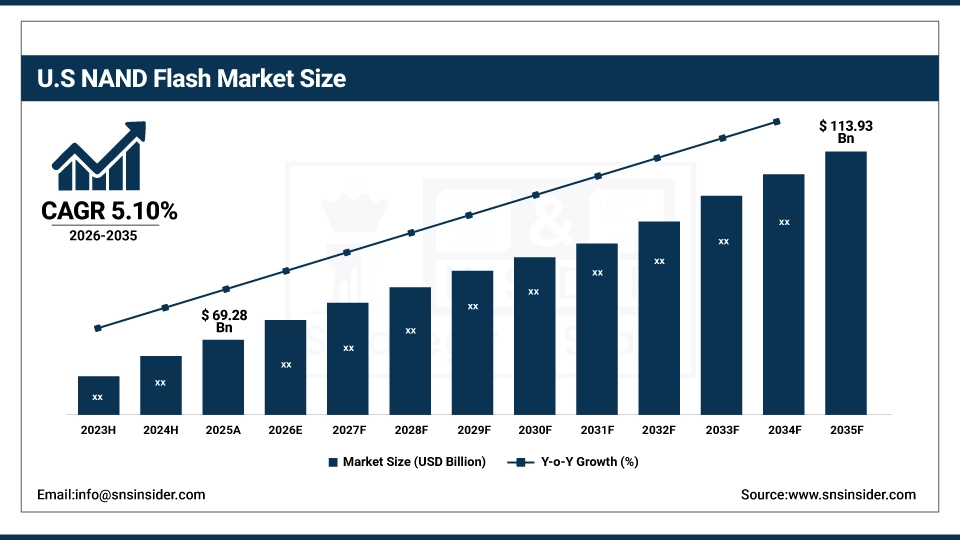
U.S. NAND Flash Memory Market Size Outlook
The U.S. NAND Flash Memory Market size is estimated to be valued at USD 69.28 billion in 2025 and is projected to grow at a CAGR of 5.10%, reaching USD 113.93 billion by 2035. Driven by robust demand from data centers, cloud computing, AI infrastructure, and enterprise applications for high-performance SSDs, along with 5G and IoT (Internet of Things) adoption in mobile devices and edge devices coupled with the ongoing government-backed investments in fab resulting in a boost to domestic supply in the US NAND Flash Memory Market is gradually increasing.
NAND Flash Memory Market Growth Drivers:
- Rising Data Demand Fuels NAND Flash Growth Through AI 5G IoT and Advanced Storage Technologies
An emphasis in growth for the global NAND Flash Memory Market trends stems from the persistent burst of data that is constantly created and absorbed, with the increase in smart phones, laptops and connected devices now contributing significantly to the funneled volume. Of late, a strong demand for NAND is being spearheaded by the growing reliance on data center and enterprise systems CPSSD with a high performance such as those in AI machine learning, 5G infrastructure and IoT applications. In addition, 3D NAND and QLC architectures are helping to deliver greater storage density, read/write speed and lower power consumption needed for consumer and enterprise applications.
In 2024, global smartphone shipments are expected to reach 1.186 billion units, growing 4% YoY, with devices increasingly embedding high-capacity 3D NAND
NAND Flash Memory Market Restraints:
- High Layer 3D NAND Faces Technical Hurdles and Talent Shortage Slowing Innovation and Manufacturing Progress
One of the major factors which is restraining the growth of the NAND Flash Memory Market is the increasing complexities for manufacturing of advanced nodes & high-layer 3D NAND architectures. However, beyond 200+ layers the interconnect reliability, cell-to-cell interference and yield loss take precedence. This is quite hard as to achieve such compact layers while avoiding data retention problem and achieving the same performance as well as endurance level required in such tightly packed layers. Expanding this further, the worldwide demand for semiconductor engineers and technicians creates longer development cycles and limits innovation scalability.
NAND Flash Memory Market Opportunities:
- NAND Flash Gains Momentum with Edge AI Autonomous Systems and Global Push for Semiconductor Independence
The largest potential growth area remains the use of NAND flash in self-driving vehicles, smart factory solutions, and edge compute systems. NAND has already been proven to deliver fast, reliable, low-latency memory that these applications require. Furthermore, the governmental push toward semiconductor self-sufficiency in the U.S., Europe and India also opens up massive room for capacity creation, R&D initiatives, and reduction to long-term strategic growth.
Texas Instruments is investing USD 60billion for seven fabs in Texas and Utah creating 60,000+ jobs to supply chips for vehicles data centers and smartphones.
NAND Flash Memory Market Segmentation Analysis:
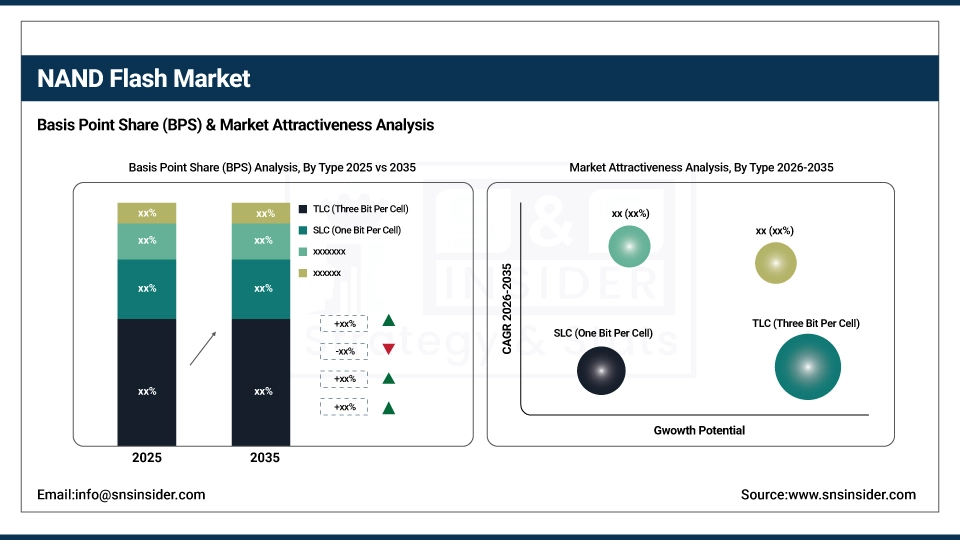
By Type, TLC NAND dominates the NAND Flash Memory Market, QLC NAND is the fastest-growing segment.
In 2025, TLC NAND dominated the market with the widest share a record of 58.6%, as the flash inspector is the best compromise between price, performance and endurance. Even today, it remains the most popular option in diverse consumer and enterprise applications such as smartphones, laptops and data center SSDs. Looking for higher write endurance than QLC and better storage density than MLC, TLC provides a good combination of reliability and efficiency as a high-capacity storage solution with stable performance. TLC continues to dominate NAND flash thanks to its availability and proven technology.
Over the period of 2026–2035, QLC NAND incomparably is anticipated to have the most elevated CAGR due to the compensating solicitation for tremendous ability limit with low cost. With QLC this allows us to store four bits per cell, thus multiplying the data density and lowering cost per bit. Meanwhile, QLC, which is already gaining traction in hyperscale data centers for data-intensive workloads and applications such as AI workloads, edge devices, and cold storage thanks to its cost advantage, is now showing improvements in endurance and reliability.
By Structure, 2-D NAND is the leading segment and expected to grow fastest.
2-D structure is the leading segment and is anticipated to grow at the highest CAGR between 2026 and 2035. While 3D NAND may increasingly hard to see, 2-D NAND still becomes very, very important in smaller amount of applications like embedded systems, USB drive, industrial and stick electronics. It is designed for low-cost devices that need moderate performance, but high reliability because of its simple architecture, low manufacturing complexity, and low cost. 2-D NAND has been kept afloat as the market remains reliant on mature nodes while the performance is stable. Additionally, advances in controller technology and integration with existing systems are broadening its applicability, particularly throughout emerging markets and with memory applications focused on cost-sensitive, long-lasting memory needs.
By Application, Smartphones lead the NAND Flash Memory Market, SSDs are the fastest-growing application segment.
In 2025, smartphones accounted for 38.0% of the total NAND Flash Memory Market due to increased demand for high performance and large capacity storage in high end mobile devices. Such as 5G, AI-enabled apps, better cameras for ultra-high definition stills and video, multimedia, etc have increased storage requirements in smartphones by an order of magnitude. Despite serving the same underlying purpose to facilitate data storage, flash foundries are also feeling the squeeze from an accelerating volume of mobile app-driven data ingestion as well as rising levels of user-generated content also drive application development in higher-density NAND formats specifically TLC and UFS-based modules that help to mitigate bi-partite operation amidst the end-user experience.
The solid-state drive (SSD) segment is projected to experience the highest CAGR from 2026 to 2035, due to emerging demands from data center, cloud and enterprise IT infrastructure. Now that we've added some fuel to the fire of that journey towards booting from SSDs, the reach of HPC and AI: Samsung Where once we were latched to HDDs and their slower performance, higher latency and greater power requirements the NAND flash memory market has reached peak penetration levels now reaching into the decades when it comes to high performance computing, while virtually all consumer class workloads start with SSDs, too of course in AI and other leading edge workloads.
NAND Flash Memory Market Regional Analysis
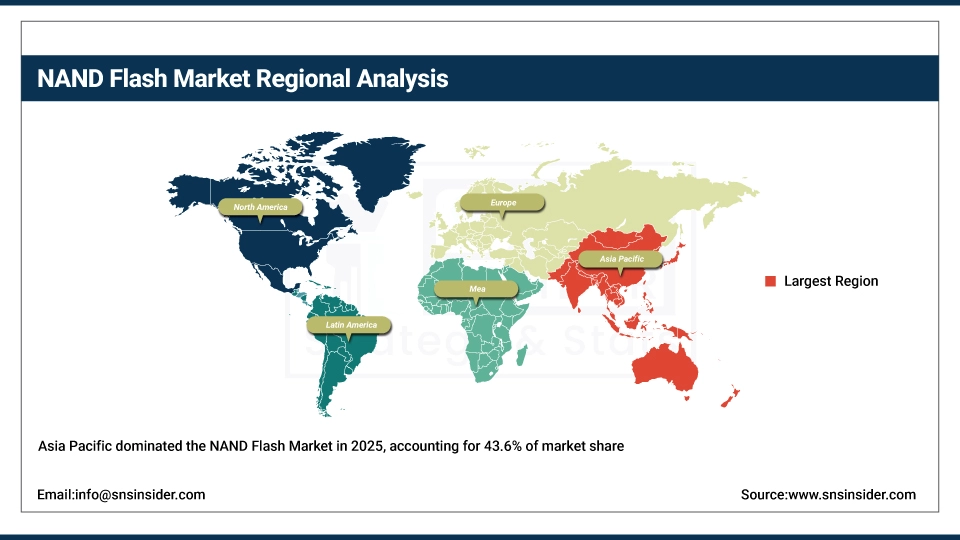
Asia Pacific NAND Flash Memory Market Insights
In 2025, Asia Pacific held the largest share of the market, accounting for 43.6% and is projected to witness the fastest CAGR of 9.03% from 2026 to 2035. The growth can be attributed to the presence of large semiconductor manufacturing centers, strong electronics production, and a rapidly growing consumer base for smartphones, laptops and other connected devices. Solid investments have come into place with cutting volumes, including NAND flash and memory packaging, which both address domestic and export business in the region. Rise in data center, 5G, and power-optimized AI and machine learning application drives demand for high-speed, low-power NAND flash storage. Further, initiatives from governments to strengthen the semiconductor supply chain, establishment of self-dependent technology ecosystems along with R&D investments with the aim of innovation are phasing a key role in advancing the growth across the region. Asia Pacific continues to be one of the nexus for the future of the global NAND Flash Memory Market with a good manufacturing base as well as a developing digital ecosystem.
The vast electronics manufacturing base of China alongside high demand for smartphones and data centers, as well as a favorable government policy supporting the advancement of semiconductor capabilities, allowed China to dominate the Asia Pacific NAND Flash Memory Market.
Get Customized Report as per Your Business Requirement - Enquiry Now
North America NAND Flash Memory Market Insights
The NAND Flash Memory Market in North America is fueled by continued demand from modern data centers, enterprise storage systems and AI-driven infrastructure. The region is supported by established cloud service providers and the fast transition towards SSDs in the consumer and enterprise segments. Investments in semiconductor fabrication facilities, R\&D, and AI-trained applications are the other factor to fuel growth. The region's emphasis on digital transformation, edge and 5G deployment, will also fuel the demand for faster, dependable and energy-efficient NAND flash memory solutions.
North America NAND Flash Memory Market share was led by United States owing to established semiconductor ecosystem, presence of major cloud and data center market, R&D ecosystem, and high AI technology adoption.
Europe NAND Flash Memory Market Insights
The NAND Flash Memory Market in Europe is growing steadily, driven by an increasing demand for use in automotive electronics, industrial automation and smart manufacturing. It is concentrating on ADAS, electric-vehicle, and Industry-4.0 activities three domains that need high-performance and reliable storage. Middle-range reusable launchers, persistent work on semiconductor independence, edge computing, and AI applications are also in support of the market. In addition, the regional growth is also segmented by the high demand-based low latency secured memory pertaining to defense and healthcare.
Middle East & Africa and Latin America NAND Flash Memory Market Insights
The market for NAND flash in Latin America and the Middle East & Africa (MEA) is gradually growing with the increasing digitalization, increasing mobile devices, and burgeoning data center infrastructure. The expansion of e-commerce, online services and cloud services is creating demand for stable storage in Latin America. MEA is seeing the creation of great opportunity driven by MEA-smart city projects, telecom expansion and government-led digital transformation initiatives. And global tech companies have also noticed, seeking to establish themselves locally, as well as their access to data, in both regions.
NAND Flash Memory Market Competitive Landscape:
Kioxia
Kioxia, established in 2019 after Toshiba Memory’s rebranding, is a global leader in flash memory and solid-state drives. CNEX Labs is focused on NAND flash technologies, storage-class memory and enterprise SSDs to enable performance computing and data-driven workloads. Kioxia, the original inventor of flash memory, is focused on delivering the next generation of storage innovations designed for artificial intelligence, cloud and hyperscale data center applications that will improve efficiency, performance and scale across sectors.
In June 2025, Kioxia revealed plans for a cutting-edge SSD delivering 10 million IOPS using XL-Flash (SLC NAND) designed for AI workloads, with samples expected in H2 2026.
SK hynix
SK hynix, founded in 1983, is one of the world’s foremost semiconductor companies and is a DRAM and NAND flash manufacturer. The company provides mobile to AI and data center high-performance memory and storage solutions for next-generation computing serving a broad array of industries. As a global leader in high-density, high-efficiency, and high-speed storage systems through incessant research to develop 4D NAND and various advanced packaging technologies, SK hynix will continue pushing the boundaries of storage innovations and further enhancing the ecosystem of future data storage systems.
In April 2025, SK hynix announced development of 321-layer 4D NAND powering UFS 4.1 storage, launching in Q1 2026.
Micron Technology
Micron Technology, founded in 1978, is a global leader in memory and storage solutions, offering DRAM, NAND, and NOR flash products. For companies such as those in AI, automotive, cloud and mobile industries, the company enables them with high-performance, energy-efficient memory solutions. A leader in breakthrough innovations in semiconductor manufacturing, Micron is advancing speed and reliability in storage technology, further solidifying the company's position as a critical element of the digital economy.
In July 2024 Micron started mass production of its ninth-generation NAND flash, delivering up to 7,000 MB/s read speeds with improved performance. The new G9 NAND powers the Micron 2650 SSD.
NAND Flash Memory Companies are:
-
Samsung
-
Kioxia
-
Western Digital
-
Micron
-
Intel
-
YMTC
-
Kingston
-
Corsair
-
Winbond Electronics Corporation
-
Macronix International Co., Ltd.
-
Transcend Information, Inc.
-
TeamGroup Inc.
-
Seagate Technology Holdings plc
-
Solidigm
-
Apacer Technology Inc.
-
Lexar
-
PNY Technologies Inc.
-
Greenliant Systems
| Report Attributes | Details |
|---|---|
| Market Size in 2025 | USD 71.53 Billion |
| Market Size by 2035 | USD 161.88 Billion |
| CAGR | CAGR of 8.51% From 2026 to 2035 |
| Base Year | 2025 |
| Forecast Period | 2026-2035 |
| Historical Data | 2022-2024 |
| Report Scope & Coverage | Market Size, Segments Analysis, Competitive Landscape, Regional Analysis, DROC & SWOT Analysis, Forecast Outlook |
| Key Segments | • By Type (SLC (One Bit Per Cell), MLC (Two Bit Per Cell), TLC (Three Bit Per Cell), QLC (Quad Level Cell)) • By Structure (2-D Structure, 3-D Structure) • By Application (Smartphone, SSD, Memory Card, Tablet, Other Applications) |
| Regional Analysis/Coverage | North America (US, Canada), Europe (Germany, UK, France, Italy, Spain, Russia, Poland, Rest of Europe), Asia Pacific (China, India, Japan, South Korea, Australia, ASEAN Countries, Rest of Asia Pacific), Middle East & Africa (UAE, Saudi Arabia, Qatar, South Africa, Rest of Middle East & Africa), Latin America (Brazil, Argentina, Mexico, Colombia, Rest of Latin America). |
| Company Profiles | Samsung, SK hynix, Kioxia, Western Digital, Micron, Intel, YMTC, ADATA, Kingston, Corsair, Winbond Electronics Corporation, Macronix International Co., Ltd., Transcend Information, Inc., TeamGroup Inc., Seagate Technology Holdings plc, Solidigm, Apacer Technology Inc., Lexar, PNY Technologies Inc., Greenliant Systems. |
Frequently Asked Questions
Ans: Asia Pacific dominated the NAND Flash Market in 2025.
Ans: The TLC (Three Bit Per Cell) segment dominated the NAND Flash Market in 2025.
Ans: The major growth factor of the NAND Flash Market is the surging demand for high-speed, low-latency storage driven by data-intensive applications such as AI, 5G, IoT, and cloud computing.
Ans: The NAND Flash Market size was valued at USD 71.53 billion in 2025 and is expected to reach USD 161.88 billion by 2035
Ans: The NAND Flash Market is expected to grow at a CAGR of 8.51% from 2026-2035.
Get in Touch
