AI-Driven Retail Theft Deterrence Market Report Scope & Overview:
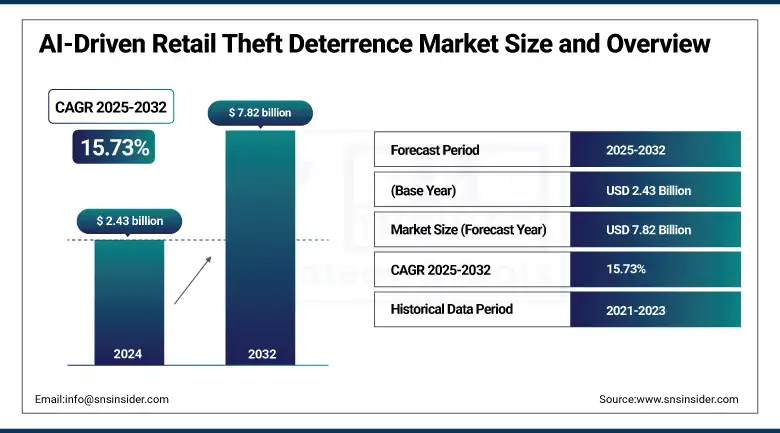
The AI-Driven Retail Theft Deterrence Market size was valued at USD 2.43 billion in 2024 and is expected to reach USD 7.82 billion by 2032, expanding at a CAGR of 15.73% over the forecast period of 2025-2032.
The AI-Driven Retail Theft Deterrence Market is experiencing strong growth as retailers seek innovative solutions to combat shoplifting and fraud. AI applications, such as computer vision, video analytics, and behavior prediction, can mitigate this by spotting suspicious activity in real time. These services are disrupting traditional security services by providing automated, precise, and proactive theft control. Supermarkets have high adoption in the space, as do convenience stores and department stores. Scalability and tracking. It can be scaled up and monitored remotely through the use of cloud-based platforms. Market leaders, North America is dominant, and the Asia Pacific market is growing steadily. Key players are concentrating on technology and incorporating AI in store operations.
To Get more information On AI-Driven Retail Theft Deterrence Market - Request Free Sample Report
According to research, during early 2025, felony-level shoplifting decreased by 26% in New York City thanks to AI-powered retail crime prevention, to was nearly eliminated and SeeChange’s AI-based self-checkout systems enabled supermarkets to cut shrinkage by as much as 50% with advanced loss prevention.
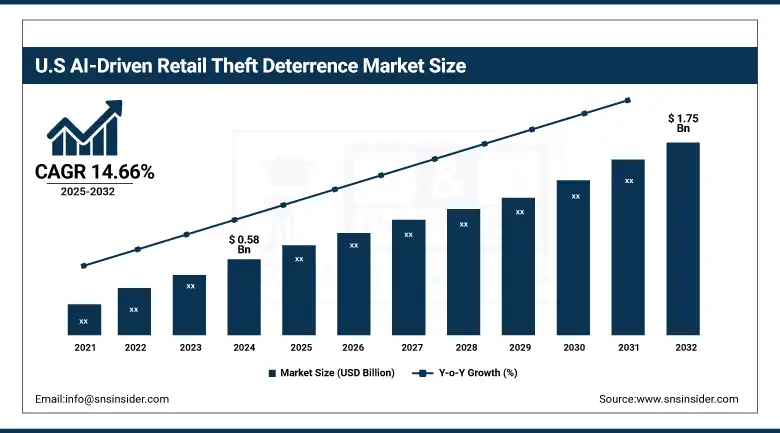
The U.S AI-Driven Retail Theft Deterrence Market size reached USD 0.58 billion in 2024 and is expected to reach USD 1.75 billion in 2032 at a CAGR of 14.66% from 2025 to 2032.
The US is leading the AI-Driven Retail Theft Deterrence Market owing to advanced retail infrastructure, the high rates of shrinkage caused by theft and crimes, and significant technological deployment across the AI-driven retail theft deterrence industry. Retailers utilize AI-based applications that include computer vision, real-time video analytics, and cognitive pattern recognition to prevent and respond to shoplifting, employee theft, and fraud. Supermarket and department store chains are adopting these systems to minimize their losses and to improve overall efficiency. It also helps that leading AI-driven retail theft deterrence market companies and cloud service providers are driving innovation and deployment through retail networks. premium and increasing consumer expectations for safety (see Appendix A) are also drivers of penetration.
Market Dynamics
Drivers:
-
Rising Retail Shrinkage and Labor Shortages Accelerate Demand for AI-Powered Theft Detection Systems.
The retail industry is facing escalating losses due to theft, fraud, and shrinkage, prompting widespread adoption of AI-enabled surveillance and theft deterrence systems. Labor shortages and rising operational costs are also compelling retailers to automate loss prevention efforts using computer vision and behavior analytics. Recent developments include the integration of facial recognition and edge-AI by companies like Everseen and Trigo to detect suspicious behavior in real time.
According to the 2023 NRF Retail Security Survey, U.S. retail shrinkage reached USD112.1 billion in 2022, with 37% attributed to external theft. To combat this, Walmart deployed Everseen's AI vision technology across 1,000+ stores to reduce checkout-related losses.
Restraints:
-
High Implementation Costs and Data Privacy Regulations Hamper Widespread Adoption of AI Surveillance Systems.
The adoption of AI surveillance technologies faces significant restraints due to high upfront investment costs, especially for small and mid-sized retailers. Advanced AI cameras, software integration, and continuous data training require capital-intensive deployments. Moreover, stringent privacy laws such as GDPR and CCPA place limitations on facial recognition, data storage, and real-time surveillance. Retailers must navigate regulatory risks and public concerns over digital surveillance, which can delay or restrict implementation.
Opportunities:
-
Integration of AI with Cloud and IoT Platforms Creates Opportunities for Scalable Theft Prevention Solutions.
The convergence of AI, cloud computing, and IoT is creating significant opportunities for scalable retail security systems. Cloud-based AI platforms enable real-time data analysis, centralized management, and seamless software updates, making theft deterrence accessible to retailers of all sizes. IoT devices like smart shelves, RFID tags, and connected cameras further enhance situational awareness. Companies such as Sensormatic Solutions and Zebra Technologies are leveraging cloud-based analytics to deliver theft pattern insights and inventory intelligence.
Challenges:
-
Lack of Standardization Across AI Platforms Creates Integration and Interoperability Challenges for Retailers.
One of the main challenges is the lack of industry-wide standardization across AI platforms, hardware interfaces, and surveillance software. Retailers often face interoperability issues when integrating AI theft deterrence systems with existing legacy infrastructure. Variability in data formats, analytics protocols, and camera specifications limits cross-compatibility, increasing complexity and implementation costs. The absence of uniform performance benchmarks also hinders the reliable comparison of AI solutions.
Segment Analysis
By Component
Hardware accounts for the majority share of 51.32%, due to widespread deployment of AI-capable cameras, sensors, and edge processors within retail environments. Companies like Zebra Technologies and Sensormatic Solutions introduced next-gen smart cameras incorporating on-device analytics and built-in loss prevention algorithms in 2024. Everseen launched upgraded machine-vision sensors enabling covert detection of concealment in checkout lanes. These hardware innovations support real-time intervention, reduce false positives, and complement software systems addressing rising store shrinkage.
Software is the fastest-growing segment, expanding at a CAGR of 16.53%, as retailers seek scalable AI platforms and behavioral analytics tools. Standard AI launched an advanced behavioural-analysis suite in early 2025, detecting suspicious loitering and item movement. SeeChange Technologies rolled out cloud-enabled analytic software that integrates POS data for pattern recognition across stores. The shift to software-driven intelligence supports automated alerts and inventory insights.
By Deployment Mode
On-premises systems dominate with a 67.38% AI-driven retail theft deterrence market share due to retailers’ preference for local data processing, low latency, and minimal network dependency. In 2024, DeepCam launched an edge-AI appliance capable of instant theft alerts, and FaceFirst introduced localized facial recognition servers for employee theft detection, compliant with privacy laws. The driver here is the need for real-time responses and secure data handling. As retailers aim to reduce shrinkage while safeguarding customer privacy, edge-based deployments remain the backbone, delivering immediate performance without latency or cloud exposure concerns.
Cloud deployment is growing fastest, with a CAGR of 16.45%, driven by demand for centralized analytics, remote monitoring, and scalable updates. In 2024, Auror released a cloud-native theft detection dashboard for real-time, cross-store insights, while Trigo rolled out a platform integrating camera feeds and AI alerts in the cloud, all managed via subscription models. This growth is fueled by the drive for agile implementation, continuous sensor model updates, and the ability to scale theft prevention across multiple store locations.
By Application
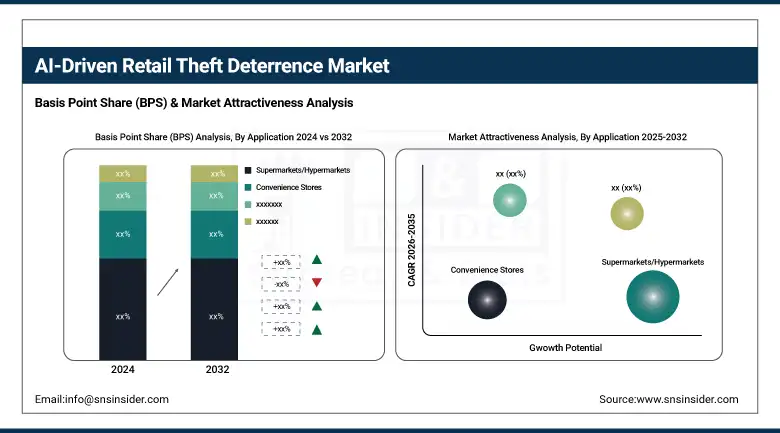
Supermarkets and hypermarkets dominate with 42.37% revenue share, driven by large footprints and high SKU volume. In 2024, Everseen deployed its checkout-optimized vision system in major U.S. supermarket chains, while Sensormatic introduced ceiling-mounted AI sensors across European hypermarkets. The driver is the need to monitor high-traffic zones and reduce checkout fraud. These environments benefit from hybrid hardware-software solutions designed for expansive aisles and multiple entry points.
Convenience stores are the fastest-growing application segment, growing at 16.76%, due to high theft rates and small staff sizes. In 2024, Standard AI rolled out targeted camera systems for back-of-store monitoring, while Zippin piloted mini-AI kiosks for checkout theft monitoring in petrol station marts. Drivers include rising shrinkage, 24/7 operation, and the need for lightweight systems. AI-enabled theft deterrence fits well in compact stores, where manpower is limited. The combination of smaller setup costs and rapid ROI is catalyzing strong AI-driven retail theft deterrence market growth in this segment.
By End-User
Retail chains hold 63.48% of the market, given their scale and unified security requirements. Major chains such as 7-Eleven piloted networked AI theft-detection systems across multiple locations in 2024, tied into centralized monitoring centers. Trigo implemented AI camera networks across grocery franchises to drive consistent detection. Chain-level implementation yields economies of scale, standardized training, and enterprise-grade data-driven insights, the key drivers behind the dominance of retail chains in deploying comprehensive loss prevention strategies.
E-commerce warehouses are experiencing rapid growth at 18.24% CAGR due to their reliance on automation and internal product loss control. In 2024, DeepCam launched shelf-level AI systems in Amazon fulfillment centers to detect product misplacement and theft. SeeChange Technologies introduced robotic-integrated cameras to monitor warehouse aisles in real time. High-value inventory limited onsite staff, and the need for end-to-end surveillance drives demand. As e-commerce logistics scale, AI-powered theft deterrence becomes vital, making warehouses an increasingly important user segment.
Regional Analysis
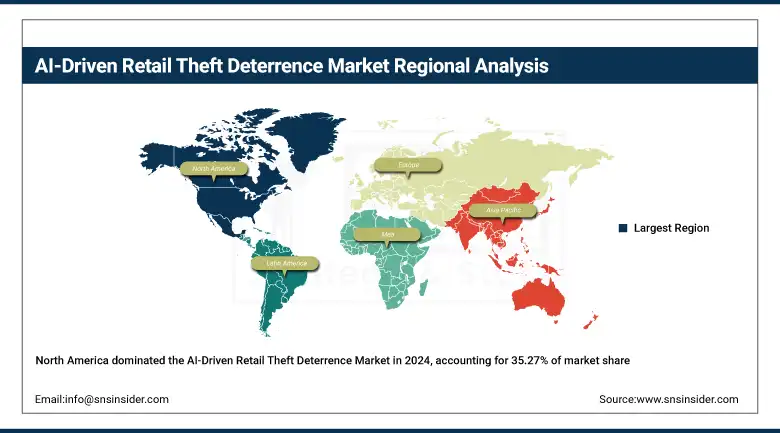
North America dominated the AI-Driven Retail Theft Deterrence Market in 2024, accounting for 35.27% of global revenue. The region benefits from advanced retail infrastructure, early adoption of AI video analytics, and high retail shrinkage awareness. Major retailers are heavily investing in AI systems for theft prediction, facial recognition, and real-time monitoring, particularly across supermarkets and department stores. The United States leads the North American market due to its widespread implementation of smart surveillance and AI-enabled POS integration across retail chains like Walmart, Target, and Kroger.
Get Customized Report as per Your Business Requirement - Enquiry Now
Europe is a mature market witnessing strong AI integration in retail, particularly in Western Europe. Regulatory mandates around retail security and GDPR-compliant surveillance encourage responsible adoption. Retailers in countries like the UK, Germany, and France are deploying AI to reduce organized retail crime and monitor in-store behavior without compromising customer privacy. The United Kingdom dominates due to early adoption of AI retail analytics, supported by smart city initiatives, retail-tech innovation hubs, and government-backed crime prevention grants.
Asia Pacific is the fastest-growing region with a 20.28% share, driven by rapid digital transformation in retail. Emerging economies are adopting AI-enabled surveillance for small-format stores and large malls alike. Retail tech investments are surging in China, Japan, and India, along with government support for AI innovation in urban security and smart commerce. China leads this region, supported by AI-first retail formats, facial recognition uses at checkout, and strong backing from tech giants like Alibaba and SenseTime.
The Middle East & Africa and Latin America are emerging regions in the AI-driven retail theft deterrence space, fueled by growing investments in smart malls, digital retail, and modern surveillance systems. Countries like the UAE and Brazil lead their respective regions with advanced retail infrastructure and rising adoption of AI security solutions to counter increasing shoplifting and fraud incidents.
Key Players
The major key players of the AI-Driven Retail Theft Deterrence Market are Everseen, Standard AI, SeeChange Technologies, Auror, FaceFirst, DeepCam, Trigo, Veesion, Sensormatic Solutions (Johnson Controls), Zebra Technologies, and others.
Key Developments
-
In January 2025, SeeChange, in partnership with Diebold Nixdorf, unveiled a full-store AI loss prevention system at NRF 2025. The solution monitors aisles, checkout, and hazards, claiming to reduce self-checkout shrink by up to 50%.
-
In February 2025, Everseen partnered with Google Cloud to integrate its Vision AI platform, enabling scalable inventory and theft detection across 120,000 edge endpoints and enhancing real-time retail analytics and loss prevention capabilities.
-
In June 2025, Trigo launched an AI-powered loss prevention system using computer vision to compare scanned versus picked items in real time, addressing the retail industry’s estimated USD130 billion in annual theft-related losses.
| Report Attributes | Details |
|---|---|
| Market Size in 2024 | USD 2.43 Billion |
| Market Size by 2032 | USD 7.82 Billion |
| CAGR | CAGR of 15.73% From 2025 to 2032 |
| Base Year | 2024 |
| Forecast Period | 2025-2032 |
| Historical Data | 2021-2023 |
| Report Scope & Coverage | Market Size, Segments Analysis, Competitive Landscape, Regional Analysis, DROC & SWOT Analysis, Forecast Outlook |
| Key Segments | •By Component (Software, Hardware, Services) •By Deployment Mode (On-Premises, Cloud) •By Application (Supermarkets/Hypermarkets, Convenience Stores, Specialty Stores, Department Stores, Others) •By End-User (Retail Chains, Independent Retailers, E-commerce Warehouses, Others) |
| Regional Analysis/Coverage | North America (US, Canada, Mexico), Europe (Germany, France, UK, Italy, Spain, Poland, Turkey, Rest of Europe), Asia Pacific (China, India, Japan, South Korea, Singapore, Australia, Rest of Asia Pacific), Middle East & Africa (UAE, Saudi Arabia, Qatar, South Africa, Rest of Middle East & Africa), Latin America (Brazil, Argentina, Rest of Latin America) |
| Company Profiles | Everseen, Standard AI, SeeChange Technologies, Auror, FaceFirst, DeepCam, Trigo, Veesion, Sensormatic Solutions (Johnson Controls), Zebra Technologies. |
Frequently Asked Questions
Ans: North America dominated the AI-Driven Retail Theft Deterrence Market in 2024, accounting for 35.27% of the global revenue share.
Ans: The Hardware segment, by type (Component), dominated the AI-Driven Retail Theft Deterrence Market, holding a 51.32% revenue share in 2024.
Ans: The key growth driver is the increase in retail shrinkage and labor shortages, which is pushing retailers to adopt AI-powered surveillance and theft prevention tools for real-time behavior detection and inventory protection.
Ans: The market size of the AI-Driven Retail Theft Deterrence Market in 2024 was USD 2.43 billion.
Ans: The AI-Driven Retail Theft Deterrence Market is projected to expand at a CAGR of 15.73% from 2025 to 2032.
Get in Touch
