AI-Enhanced Video Content Accessibility Market Report Scope & Overview:
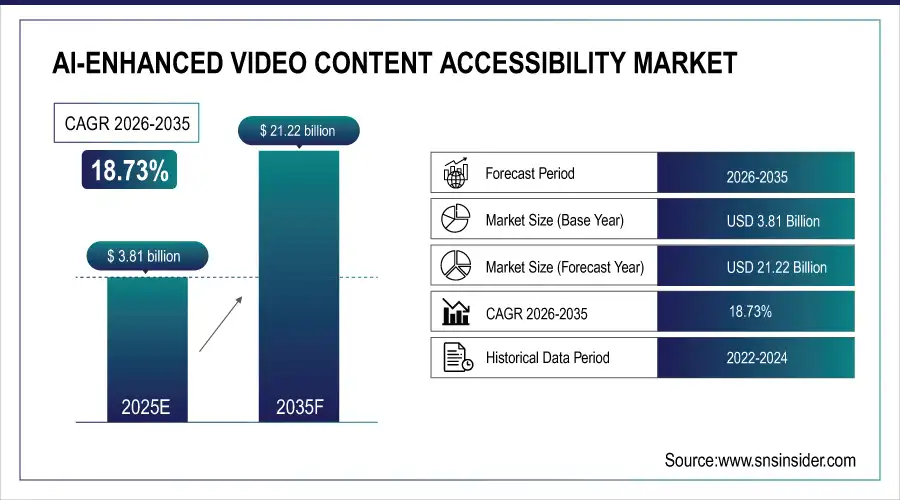
The AI-Enhanced Video Content Accessibility Market was valued at USD 3.81 billion in 2025 and is expected to reach USD 21.22 billion by 2035, growing at a CAGR of 18.73% from 2026-2035.
The AI-Enhanced Video Content Accessibility Market growth is driven by rising demand for inclusive digital content, expanding video consumption across platforms, and stricter accessibility regulations. Advancements in AI-based captioning, speech recognition, sign-language generation, and real-time translation, combined with increased adoption by education, media, enterprises, and governments, are accelerating scalable, cost-efficient accessibility solutions globally.
According to research, as of 2022, video accounted for 65% of global internet traffic, and by Q3 2024, 92.3% of internet users consumed online videos. With 93% of marketers reporting positive ROI in 2025, demand for inclusive video solutions continues to surge.
AI-Enhanced Video Content Accessibility Market Size and Forecast
-
Market Size in 2025: USD 3.81 Billion
-
Market Size by 2035: USD 21.22 Billion
-
CAGR: 18.73% from 2026 to 2035
-
Base Year: 2025
-
Forecast Period: 2026–2035
-
Historical Data: 2022–2024
To Get more information On AI-Enhanced Video Content Accessibility Market - Request Free Sample Report
AI-Enhanced Video Content Accessibility Market Trends
-
Rising demand for inclusive and accessible digital content is driving the AI-enhanced video content accessibility market.
-
Growing adoption of AI-powered tools for automated captioning, audio description, and sign language translation is boosting market growth.
-
Expansion across media, education, corporate training, and government sectors is fueling deployment.
-
Increasing focus on regulatory compliance, accessibility standards, and enhanced user experience is shaping adoption trends.
-
Advancements in natural language processing, computer vision, and speech recognition are improving accuracy and real-time capabilities.
-
Rising consumption of online video content and e-learning platforms is supporting market expansion.
-
Collaborations between AI technology providers, content creators, and accessibility solution firms are accelerating innovation and global adoption.
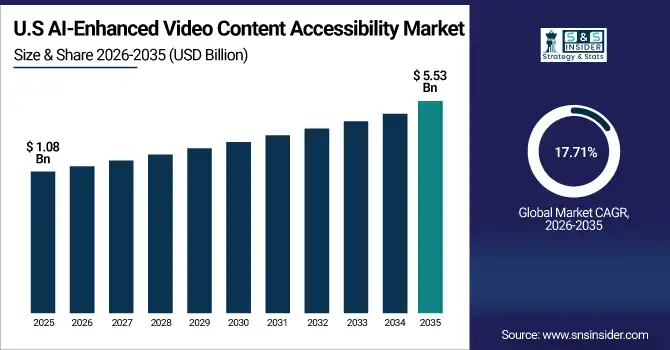
The U.S. AI-Enhanced Video Content Accessibility Market was valued at USD 1.08 billion in 2025 and is expected to reach USD 5.53 billion by 2035, growing at a CAGR of 17.71% from 2026-2035.
The U.S. is leading the AI in the video Content Accessibility Market in developed countries as government legislation in this country forces the stipulation of equivalent digital content access, such as the Americans with Disabilities Act (ADA) and Section 508 Compliance, in both public and private sectors. The country also enjoys the presence of giants such as Google, IBM, and Microsoft, who actively pump money into AI to make accessibility innovations a reality.
AI-Enhanced Video Content Accessibility Market Growth Drivers:
-
Surging Demand for Inclusive Digital Media Across Education, Corporate, and Entertainment Sectors Fuels Market Expansion.
Increasing focus on digital inclusion in major industries, including education, corporate communication, and media, is playing a key role in influencing the demand for AI-integrated video accessibility systems. Organizations are using AI-powered captioning, transcription, and audio description to meet accessibility regulations such as WCAG and ADA. The major AI-enhanced video content accessibility market companies, such as Google and Microsoft, have recently enhanced their AI accessibility APIs, advancing real-time automated solutions increasingly integrated with mainstream media platforms.
According to research, as of 2024, 72% of organizations have adopted AI in at least one business function, reflecting a sharp rise from 50% in 2022. Microsoft leads with 62% of new cloud GenAI case studies, followed by Google (18%) and AWS (16%), highlighting accelerating investments in AI tooling and accessibility integration across enterprise and educational platforms.
AI-Enhanced Video Content Accessibility Market Restraints:
-
High Implementation Costs and Integration Complexities Impede Adoption Across Budget-Constrained Organizations Globally.
Despite technological advancements, a common barrier to the adoption of AI-enabled accessibility tools is the associated high deployment and operational cost. Small organisations are finding it a challenge to incorporate advanced AI tools, primarily because of the immense processing power required, ongoing data training, technical knowledge, and the rest. These barriers limit adoption outside of large enterprises and tech-savvy organizations. Indeed, without solutions that can be scaled and are cost-effective, the growth in the market will be intermittent between regions and sectors.
AI-Enhanced Video Content Accessibility Market Opportunities:
-
Expansion of Regulatory Mandates and Global Accessibility Standards Presents Lucrative Growth Opportunities for Technology Providers.
Governments and international bodies are increasingly enforcing digital accessibility standards, creating a conducive environment for the expansion of AI-enhanced video tools. Regulations such as the European Accessibility Act, the Accessible Canada Act, and India’s RPWD Act are driving mandatory compliance across sectors. This global regulatory alignment is encouraging enterprises to adopt AI-driven captioning and sign-language interpretation solutions proactively. Recent developments include AI platforms offering real-time multilingual accessibility and adaptive features tailored for cognitive disabilities.
AI-Enhanced Video Content Accessibility Market Challenges:
-
Ensuring Accuracy and Cultural Context in AI-Generated Accessibility Features Remains a Critical Industry Challenge.
One of the foremost challenges in this market is maintaining high accuracy in AI-generated captions, audio descriptions, and sign language interpretations. Automated systems often struggle with regional dialects, speech impediments, and complex domain-specific terminology. Additionally, AI models sometimes fail to consider cultural context and tone, which can lead to misinterpretation or insensitive representations, especially in educational or legal content. While many companies are training models using diverse datasets, ensuring consistent performance across languages and geographies remains difficult.
Segmentation Analysis:
By Component
The software segment led in 2025, commanding 67.36% of the market, driven by demand for AI-powered tools as automated captioning, transcription, and sign-language avatars. Key players launched significant innovations. Microsoft expanded its Azure Cognitive Services to enhance live caption accuracy, while Google introduced AI-driven auto-caption features in its Workspace suite. These software platforms integrate seamlessly with video creation environments and support compliance with WCAG and ADA standards.
Services are emerging as the fastest-growing component, with a projected CAGR of 19.66%, fueled by the need for high-quality accessibility that combines AI efficiency with human review. Companies like Rev.com expanded hybrid offerings, pairing AI transcription with professional editing, while 3Play Media introduced managed accessibility services, including real-time Spanish captioning. As media, education, and government organizations confront complex compliance and localization demands, demand for subscription-based accessibility services continues to accelerate.
By Deployment Mode
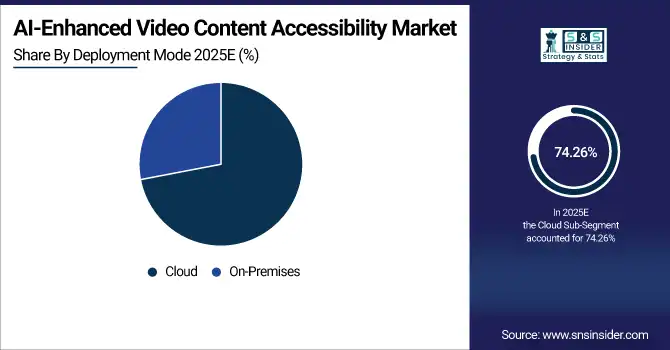
Cloud deployment dominated the market with 74.26% share in 2025, propelled by its scalability and ease of integration into existing workflows. Cloud-based platforms like Veritone expanded AI API offerings for captioning and metadata tagging, and IBM’s Watson Media launched auto-caption services via cloud SDKs. The cloud model drives adoption across sectors, reducing infrastructure costs, enabling real-time processing, and supporting remote collaboration, making it the clear leader in accessibility deployments.
The on-premises segment is growing fastest with a projected CAGR of 19.66%, driven by security and compliance demands from government, corporate, and healthcare clients handling sensitive content. Companies such as Kaltura have enhanced their self-hosted video accessibility plugins to support offline, encrypted captioning and transcription. These private deployments allow organizations to maintain full control over data while still leveraging AI-enhanced accessibility, appealing to use cases where data sovereignty and customization are essential.
By Application
Media & Entertainment led the market in 2025, holding 36.18% of revenue, driven by streaming platforms’ efforts to meet global accessibility mandates and audience reach initiatives. Meta Platforms and Apple introduced AI-based auto-captioning and audio-description tools for video creators, while Netflix scaled automated localization workflows. Continuous releases of AI-powered accessibility features for subtitles and sign-language avatars further fuel investment, making this segment the primary growth engine in the sector.
Education is the fastest-growing application with a projected CAGR of 19.76%, propelled by increased demand for inclusive e-learning content in virtual classrooms and MOOCs. Zendesk recently added AI-captioning and simplified transcription capabilities to its learning management platform, and Rev.com launched EDU-focused accessibility bundles tailored for schools and universities. As remote learning matures post-pandemic, educational institutions increasingly integrate these tools to ensure compliance, enhance student engagement, and support diverse learning needs.
By Accessibility Feature
Captioning led with a 41.37% share in 2025, supported by global regulations and user demand for searchable video content. Google’s Cloud Video Intelligence introduced enhanced caption accuracy for live events, while Veritone launched timestamped speech-to-text capabilities for easier content navigation. These improvements enable automated workflows and enrich metadata, making captioning an indispensable feature across nearly all video accessibility scenarios.
Audio description is the fastest-growing feature, with a CAGR of 20.44%, as content providers aim to serve visually impaired audiences better. Netflix rolled out auto-generated audio descriptions using AI voice models, and IBM Watson Media added audio description as a plugin to its content delivery toolkit. These advances streamline production and compliance, and the trend is fueled by pressure from disability advocates and content platforms prioritizing inclusive design.
By End User
Enterprises lead with a 33.57% share, due to internal video use across training, communications, and marketing. Microsoft Teams and zoom integrated native AI captioning features, and corporate learning platforms embedded accessibility in employee onboarding videos. With legal exposure from accessibility laws and internal inclusion policies, many enterprises implement comprehensive video accessibility suites, leading to sustained growth of this sector.
Educational institutions exhibit the fastest growth (CAGR of 19.91%), driven by regulations like Section 508 and the rise of online learning. Platforms such as Kaltura EDU and Panopto expanded AI-caption and lecture browsing tools, while Rev.com introduced EDU-specific educational packages. As K–12 schools and universities enhance their inclusive digital infrastructure, ensuring video accessibility is vital to meet the needs of diverse student populations and the growing demands of remote learning.
Regional Analysis:
North America AI-Enhanced Video Content Accessibility Market Insights
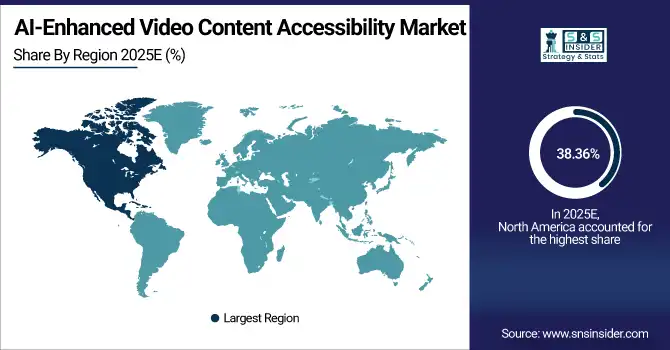
North America holds the dominant position in the market with a share of 38.36% in 2025, driven by strong technological infrastructure, stringent accessibility laws (like the ADA), and a large presence of AI and cloud computing companies. The region also witnesses early adoption of video AI tools across media, enterprise, and educational sectors, enhancing growth opportunities for AI-based accessibility solutions. The United States dominates the region due to robust investment in inclusive digital infrastructure, widespread enterprise-level demand, and regulatory frameworks mandating video accessibility compliance.
Get Customized Report as per Your Business Requirement - Enquiry Now
Asia Pacific AI-Enhanced Video Content Accessibility Market Insights
Asia Pacific is the fastest-growing region, projected to expand at a CAGR of 21.32. This growth is fueled by increasing digital adoption, rising smartphone penetration, and government-led initiatives promoting e-learning and media inclusivity. Rapid expansion of online content platforms and AI innovation hubs also catalyse market growth across emerging economies in the region. China dominates the region owing to its large-scale video streaming platforms, aggressive investments in AI-based video tools, and policy-driven push toward inclusive digital education and broadcasting.
Europe AI-Enhanced Video Content Accessibility Market Insights
Europe represents a mature market with high adoption rates of accessibility technologies across government and educational institutions. The European Accessibility Act (EAA) mandates inclusive video services, prompting broadcasters, OTT platforms, and universities to integrate AI tools like automated captioning and audio description. Public funding and tech collaborations further support the availability of innovation in the region. Germany leads the European market due to its strong media production industry, advanced AI research initiatives, and strict enforcement of digital accessibility regulations in public communication systems.
Middle East & Africa and Latin America AI-Enhanced Video Content Accessibility Market Insights
The Middle East & Africa and Latin America regions are experiencing steady growth in the AI-enhanced video content accessibility market, driven by expanding digital infrastructure, rising demand for inclusive education and public services, and growing adoption of AI tools for captioning, transcription, and translation. The UAE and Brazil lead their respective regions through strong policy support, EdTech investments, and digital transformation initiatives.
AI-Enhanced Video Content Accessibility Market Competitive Landscape:
IBM Corporation
IBM provides enterprise AI, cloud, and automation solutions, helping organizations leverage AI for operational efficiency, accessibility, and analytics. Its Watson AI portfolio enables advanced capabilities including natural language processing, computer vision, and automated insights, applicable across industries such as healthcare, finance, media, and education. IBM emphasizes AI-enhanced accessibility, generative AI workflows, and scalable video solutions to make content inclusive for diverse audiences while maintaining enterprise-grade reliability and integration across digital platforms.
-
2023: IBM offers AI-powered automated closed captioning on IBM Video Streaming, enabling scalable live and on-demand captions using Watson speech-to-text for accessible video content.
-
2024: IBM’s Masters Tournament digital platforms integrated generative AI for dual-language Spanish/English narration and captions, expanding accessibility and engagement for global audiences.
Google LLC
Google develops AI-first products across search, cloud, productivity, and accessibility, focusing on tools that enhance human-computer interaction. Its accessibility initiatives leverage AI for real-time captioning, transcription, and adaptive interfaces. Google’s AI-driven services integrate across Pixel devices, Android, and Workspace platforms, promoting inclusivity and productivity. Google aims to provide seamless accessibility solutions for media, communication, and education while advancing AI capabilities in natural language processing, speech recognition, and contextual understanding for diverse user needs.
-
2024: Google rolled out AI-powered accessibility updates with expanded Live Caption and Live Transcribe language support on Android and Pixel devices, improving real-time video and audio captioning.
Microsoft Corporation
Microsoft delivers software, cloud, and AI-driven productivity solutions, emphasizing accessibility across platforms such as Windows, Office, Teams, and Clipchamp. Its AI features include automated video captioning, text-to-speech, and AI-assisted workflows for diverse users. Microsoft integrates accessibility into enterprise and consumer applications, enabling inclusive digital content creation. Its investments in AI-powered communication tools and accessibility standards aim to make video, collaboration, and productivity solutions usable by all, across languages, devices, and ability levels.
-
2023: Microsoft added automatic video captioning and text-to-speech features in Clipchamp, enhancing accessible video content creation within Windows 11 workflows.
-
2024: Microsoft previewed AI enhancements at the Ability Summit, including Teams sign language views and closed captions, highlighting accessible video communication improvements.
-
2025: Microsoft promoted Clipchamp auto-captions and AI text-to-speech features, enabling multilingual accessible video content creation for broad audiences.
Amazon Web Services (AWS)
AWS provides cloud infrastructure, AI, and machine learning solutions supporting enterprises and media workflows. Its AI services include natural language processing, speech-to-text, and automated captioning tools for accessibility and content personalization. AWS focuses on scalable AI solutions for video, media production, and real-time accessibility, enabling organizations to deliver inclusive, engaging experiences. Its cloud-native approach facilitates integration with media, communications, and AI-driven content platforms worldwide.
-
2024: AWS launched Media Intelligence Solutions, offering AI-driven captioning, localization, and content tagging to improve accessibility and engagement in media workflows.
Apple Inc.
Apple develops consumer electronics, software, and services emphasizing health, fitness, and accessibility. Its wearable and digital platforms, including Apple Watch and iOS, integrate AI features for personalized experiences, including fitness tracking, health monitoring, and content accessibility. Apple leverages AI to enhance accessibility with features such as voice control, captions, and assistive technology across devices. The company prioritizes inclusivity, making multimedia content, fitness data, and user interactions more adaptive for diverse needs globally.
-
2025: Apple announced AI-powered Accessibility Reader and enhanced captions across its ecosystem, improving video content accessibility for diverse users.
3Play Media
3Play Media provides AI-driven video accessibility solutions including automated captioning, transcription, and audio description. It focuses on compliance with accessibility regulations such as ADA and WCAG, serving education, media, and corporate clients. 3Play leverages AI and automation to simplify accessibility workflows, enabling large-scale captioning, transcription, and description services for live and on-demand video content. Its solutions enhance usability, inclusivity, and engagement for all audiences across platforms.
-
2025: 3Play Media launched AI-enabled tools for automated captions, live captioning, and AI audio descriptions to help universities meet ADA Title II compliance by 2026.
Key Players
Some of the AI-Enhanced Video Content Accessibility Market Companies
-
IBM Corporation
-
Google LLC
-
Microsoft Corporation
-
Amazon Web Services (AWS)
-
Apple Inc.
-
Meta Platforms, Inc. (Facebook)
-
Veritone, Inc.
-
Rev.com, Inc.
-
3Play Media
-
Kaltura, Inc.
-
VITAC (A Verbit Company)
-
Ai-Media Technologies Limited
-
Speechmatics
-
Otter.ai
-
Sonix, Inc.
-
CaptionHub
-
Trint Limited
-
Descript, Inc.
-
AppTek
-
Red Bee Media (Ericsson)
| Report Attributes | Details |
|---|---|
|
Market Size in 2025 |
USD 3.81 Billion |
|
Market Size by 2035 |
USD 21.22 Billion |
|
CAGR |
CAGR of 18.73% From 2026 to 2035 |
|
Base Year |
2025 |
|
Forecast Period |
2026-2035 |
|
Historical Data |
2022-2024 |
|
Report Scope & Coverage |
Market Size, Segments Analysis, Competitive Landscape, Regional Analysis, DROC & SWOT Analysis, Forecast Outlook |
|
Key Segments |
•By Component (Software, Hardware, Services) |
|
Regional Analysis/Coverage |
North America (US, Canada, Mexico), Europe (Germany, France, UK, Italy, Spain, Poland, Turkey, Rest of Europe), Asia Pacific (China, India, Japan, South Korea, Singapore, Australia, Rest of Asia Pacific), Middle East & Africa (UAE, Saudi Arabia, Qatar, South Africa, Rest of Middle East & Africa), Latin America (Brazil, Argentina, Rest of Latin America) |
|
Company Profiles |
IBM Corporation, Google LLC, Microsoft Corporation, Amazon Web Services (AWS), Apple Inc., Meta Platforms, Inc., Veritone, Inc., Rev.com, Inc., 3Play Media, Kaltura, Inc. |
Frequently Asked Questions
The AI-enhanced video content accessibility market is expected to expand at a compound annual growth rate (CAGR) of 18.73% from 2026 to 2035.
The AI-Enhanced Video Content Accessibility Market was valued at USD 3.81 billion in 2025 and is expected to reach USD 21.22 billion by 2035.
The primary growth driver is the surging demand for inclusive digital media across the education, corporate, and entertainment sectors, which is fueling the adoption of AI?driven video accessibility tools like captioning, transcription, and audio description.
The Software segment dominated the market by type in 2025 with a 67.36% share. AI-powered accessibility platforms, such as automatic captioning, transcription, and sign-language avatars, continued to drive software’s dominance.
North America dominated the AI-Enhanced Video Content Accessibility Market in 2025, holding a market share of 38.36%, supported by strong infrastructure, regulatory frameworks, and the presence of major technology firms.
Get in Touch
