AI In Environmental Sustainability Market Report Scope & Overview:
The AI In Environmental Sustainability Market was valued at USD 18.65 billion in 2025 and is expected to reach USD 111.70 billion by 2035, growing at a CAGR of 19.6% from 2026-2035.
The market is witnessing significant growth as organizations leverage AI to tackle pressing environmental issues. AI technologies are being deployed to monitor climate patterns, optimize energy usage, manage waste, and protect biodiversity. With rising global emphasis on sustainability and stricter environmental regulations, AI offers actionable insights through data analysis, automation, and forecasting. Applications span industries such as energy, agriculture, transportation, and government.
According to a study, rising environmental concerns have led to increased adoption of AI technologies, with over 60% of sustainability-focused companies integrating AI for energy management and emission reduction. As a result, AI-driven solutions are now deployed in over 40% of global smart city projects. The expansion of IoT and sensor-based monitoring has contributed to a 55% rise in real-time environmental data usage.
AI In Environmental Sustainability Market Size and Forecast
-
Market Size in 2025: USD 18.65 Billion
-
Market Size by 2035: USD 111.70 Billion
-
CAGR: 19.6% from 2026 to 2035
-
Base Year: 2025
-
Forecast Period: 2026–2035
-
Historical Data: 2022–2024

To Get more information On AI In Environmental Sustainability Market - Request Free Sample Report
AI In Environmental Sustainability Market Trends
-
Rising need for climate monitoring, resource optimization, and emission reduction is driving the AI in environmental sustainability market.
-
Growing adoption across energy, agriculture, manufacturing, and smart city initiatives is boosting market growth.
-
Expansion of AI-powered predictive analytics, environmental modeling, and IoT-enabled monitoring is fueling deployment.
-
Increasing focus on carbon footprint reduction, waste management, and regulatory compliance is shaping adoption trends.
-
Advancements in machine learning, big data analytics, and automation are improving decision-making and efficiency.
-
Rising investments in green technologies, renewable energy, and sustainability programs are supporting market expansion.
-
Collaborations between AI providers, governments, and environmental organizations are accelerating innovation and global adoption.
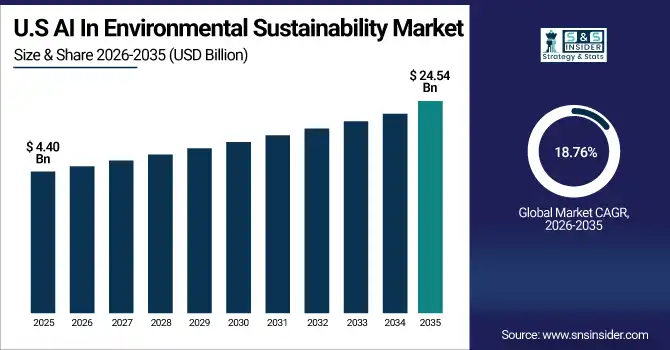
The U.S. AI In Environmental Sustainability Market was valued at USD 4.40 billion in 2025 and is expected to reach USD 24.54 billion by 2035, growing at a CAGR of 18.76% from 2026-2035. The U.S. market is the government's increased investment in clean technologies and AI integration. As a result, over 65% of federal sustainability projects now incorporate AI tools for environmental monitoring. The U.S. dominates the North American market due to its advanced tech infrastructure, presence of leading AI companies, and strong regulatory support, which collectively accelerate adoption across energy, agriculture, and climate resilience sectors.
AI In Environmental Sustainability Market Growth Drivers:
-
Federal Push for Green Innovation and Technological Adoption Drives AI in Environmental Sustainability Market Growth (
The growing global focus on climate action and sustainable development has led to widespread government-led initiatives promoting clean technologies and AI integration. In April 2024, new policies encouraging AI-driven monitoring of carbon emissions and waste management systems were introduced in multiple regions, triggering a wave of innovation. These policy shifts caused rapid investment in environmental AI solutions such as climate modeling, air quality prediction, and automated waste sorting systems. As a result, both public and private sectors began aligning their operations with AI-based sustainability goals, enhancing operational efficiency while reducing environmental impact.
The development of AI-powered forest monitoring tools, introduced in early 2024, enabled real-time tracking of illegal deforestation activities, reducing data lag by over 40%. This initiative illustrated how regulatory support leads to tangible technological advancements that reshape environmental monitoring. Increased demand from industries like energy, manufacturing, and agriculture to adopt environmentally intelligent systems further fuels the momentum, driving market expansion.
AI In Environmental Sustainability Market Restraints:
-
Lack of Standardized Frameworks and Data Privacy Concerns Limit Widespread Adoption of AI in Environmental Sustainability Applications
The absence of harmonized global standards and rising concerns about data privacy have become significant barriers to the adoption of AI in environmental sustainability. Because AI systems rely heavily on massive and diverse datasets for modeling and prediction, inconsistent data governance laws and privacy restrictions across regions create friction. This leads to limited data availability, poor data quality, and inefficiencies in deploying scalable AI tools for environmental use cases. Consequently, companies and governments face delays in implementation and lower trust in AI-driven insights, hindering growth and collaborative innovation in this space. These limitations have a ripple effect, restricting the development of real-time AI systems that could support global initiatives such as climate change mitigation or biodiversity conservation. The lack of interoperability between data systems, coupled with fragmented compliance requirements, causes slower adoption across borders and industries.
AI In Environmental Sustainability Market Opportunities:
-
Rise of Smart Cities and Circular Economy Goals Offers Strategic Opportunity for AI-Based Sustainability Solutions
The global movement toward smart cities and circular economies is creating a significant opportunity for AI in the environmental sustainability market. In March 2025, urban planners and sustainability leaders introduced AI-powered platforms for water conservation, energy optimization, and automated recycling systems. These implementations are a direct result of increased pressure to manage urban growth, resource scarcity, and waste accumulation. As cities transform into digitally connected ecosystems, AI is becoming a critical enabler for achieving real-time monitoring and predictive control of environmental parameters. This shift toward intelligent urban management has accelerated demand for AI-driven technologies capable of supporting sustainable development goals.
For instance, in early 2025, an international smart city pilot program deployed AI to monitor waste management routes and landfill usage, reducing total waste output by 18% within the first quarter. This example underscores the transformative impact of AI when aligned with circular economy principles.
AI In Environmental Sustainability Market Challenges:
-
Technical Complexity and Lack of Skilled Workforce Pose Major Challenges to the Market
The rapid evolution of AI technologies brings with it a major challenge: the high technical complexity and a limited pool of professionals skilled in both AI and environmental sciences. Due to this dual knowledge requirement, many organizations struggle to develop, deploy, and maintain AI systems effectively in real-world sustainability applications. As a result, implementation timelines are delayed, and innovation is constrained. This talent shortage directly affects the quality and scalability of AI solutions in critical areas such as climate modeling, renewable energy forecasting, and biodiversity tracking. Moreover, many environmental stakeholders lack access to high-performance computing resources and advanced software frameworks needed to support complex AI models. T
AI In Environmental Sustainability Market Segment Analysis
By Application
The Climate Change Mitigation segment dominates with a 29% revenue share in 2025 due to rising climate emergencies that drive the demand for AI-based predictive analytics and carbon tracking systems. This surge causes organizations to adopt intelligent emission monitoring and simulation models. Recent product developments include AI-integrated satellite monitoring systems that help identify high-risk zones. These solutions significantly enhance response strategies, aligning directly with the AI in Environmental Sustainability Market's broader goal of global carbon footprint reduction.
The Renewable Energy Optimization segment is growing rapidly at a 22.05% CAGR as increasing reliance on renewables creates a need for smart energy forecasting and load balancing. This demand causes utilities to invest in AI algorithms that predict solar and wind patterns for grid stability. Product development has focused on AI-enabled smart meters and real-time power optimization software, strengthening this segment’s impact and making it a key growth driver for the AI in Environmental Sustainability Market.
By Technology
The Machine Learning segment holds a dominant 37% revenue share in 2025 because of its advanced capabilities in pattern recognition and environmental trend prediction. This dominance is caused by the ability to process vast ecological datasets for resource management and pollution tracking. Recent developments include automated ML models for water quality prediction. As a result, machine learning acts as a core enabler in the AI in Environmental Sustainability Market, powering informed decision-making across multiple environmental sectors.
The Natural Language Processing (NLP) segment is growing at a 24.34% CAGR due to the need to process massive volumes of regulatory and climate literature. This growth causes increased adoption of NLP in interpreting environmental impact reports, legislation, and public sentiment. Developments include AI chatbots for eco-advisory services and NLP engines that summarize sustainability policies. These solutions make complex data actionable, boosting the AI in Environmental Sustainability Market through better transparency and data-driven compliance monitoring.
By End Use
The Government & Public Sector dominates with 31% revenue share in 2025 due to widespread regulatory mandates and environmental policy frameworks that require AI-powered monitoring. This causes authorities to deploy AI for surveillance, early warning systems, and environmental reporting. Recent innovations include AI-powered dashboards for real-time pollution tracking. These advancements streamline decision-making and enhance policy effectiveness, positioning this segment as a cornerstone of the AI in Environmental Sustainability Market’s long-term implementation and expansion.
The Energy & Utilities segment is growing at a 22.68% CAGR driven by increasing pressure to optimize resource usage and minimize emissions. This rising demand causes energy firms to adopt AI tools for consumption analytics and fault prediction. Product advancements include grid optimization software and AI-enabled asset monitoring systems. These innovations directly support cleaner energy operations, making this segment a major contributor to the advancement of the AI in Environmental Sustainability Market.
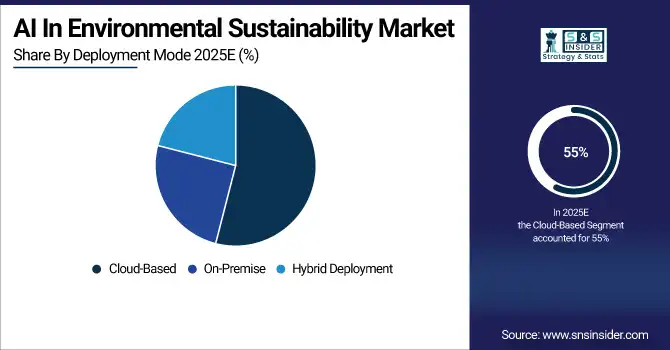
By Deployment Mode
The Cloud-Based segment commands 55% of revenue share in 2025 due to its ability to deliver scalable, cost-effective AI solutions for environmental applications. This demand causes organizations to favor cloud platforms for remote sensing, data processing, and collaborative modeling. Innovations include cloud-based AI tools for satellite image interpretation and ecosystem monitoring. The ease of integration and flexibility of cloud deployment make it an essential driver of the AI in Environmental Sustainability Market’s technological adoption.
The On-Premise segment is growing at a 21.9% CAGR as industries requiring high data security prefer localized AI systems. This preference causes increased investment in on-site infrastructure for sensitive environmental modeling tasks. Product developments include AI servers tailored for in-house climate simulations and regulatory compliance. These secure and customizable solutions cater to sectors with strict data protocols, reinforcing the AI in Environmental Sustainability Market’s reach across regulated and mission-critical environments.
AI In Environmental Sustainability Market Regional Analysis
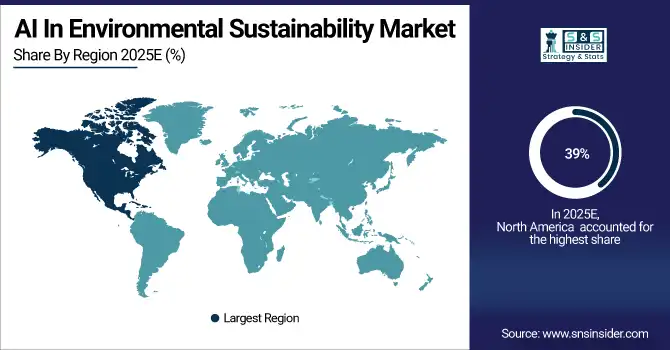
North America AI In Environmental Sustainability Market Insights
North America leads the AI in Environmental Sustainability Market with a 39% share in 2025, driven by advanced technological infrastructure, early AI adoption across industries, and strong government initiatives supporting green innovation. The region’s mature digital ecosystem and demand for predictive environmental analytics have accelerated AI deployment in climate modeling, emissions control, and resource optimization. The United States dominates the North American market due to its extensive R&D investment, active AI startup ecosystem, and policy-driven adoption in energy, agriculture, and public infrastructure sustainability programs.
Get Customized Report as per Your Business Requirement - Enquiry Now
Asia Pacific AI In Environmental Sustainability Market Insights
Asia Pacific is the fastest-growing region with a 22.4% CAGR, fueled by rapid urbanization, climate risks, and government-driven sustainability programs. The region is embracing AI for real-time pollution monitoring, smart waste management, and renewable energy forecasting to tackle escalating environmental challenges. China dominates Asia Pacific due to its aggressive smart city development, investments in AI-backed environmental surveillance, and increasing deployment of intelligent systems for energy optimization, air quality control, and ecosystem restoration across urban and industrial zones.
Europe AI In Environmental Sustainability Market Insights
Europe is witnessing steady growth, supported by strict climate regulations, sustainable policy mandates, and heavy investment in clean technology innovation. The region is expanding AI use in carbon footprint monitoring, smart mobility, and green infrastructure. Germany dominates the European market due to its leadership in renewable energy transition, strong industrial automation base, and increasing reliance on AI for achieving national and EU-wide climate neutrality goals through real-time emissions tracking and optimized resource management.
Middle East & Africa and Latin America AI In Environmental Sustainability Market Insights
The Middle East & Africa and Latin America regions are seeing growing adoption of AI in environmental sustainability, driven by water scarcity, energy efficiency needs, and ecosystem protection efforts. In the Middle East & Africa, South Africa leads due to its use of AI for biodiversity mapping, sustainable agriculture, and early-stage climate risk management. In Latin America, Brazil dominates, supported by AI integration in rainforest monitoring, illegal deforestation detection, and growing demand for climate-smart agriculture and sustainable land use practices.
AI In Environmental Sustainability Market Competitive Landscape:
Microsoft Corporation
Microsoft Corporation is a global technology leader providing software, cloud services, and AI solutions. The company emphasizes sustainable innovation by leveraging AI, data analytics, and cloud infrastructure to drive environmental responsibility. Microsoft invests in carbon-negative strategies, energy-efficient datacenters, and AI-enabled solutions that reduce emissions, conserve resources, and support biodiversity. Its Microsoft Cloud for Sustainability and AI tools empower organizations worldwide to track ESG performance, implement climate-positive strategies, and transition toward more sustainable operations across industries.
-
2024: Microsoft introduced data and AI solutions in Microsoft Cloud for Sustainability, helping organizations accelerate ESG insights, reporting, and governance through advanced analytics capabilities.
-
2024: At ADIPEC 2024, Microsoft showcased AI solutions for energy transition, including predictive emissions reduction, carbon capture AI platforms, and methane remediation insights for hard-to-abate sectors.
Amazon Web Services (AWS)
AWS, a subsidiary of Amazon.com, delivers cloud computing, AI, and infrastructure services at scale. AWS emphasizes sustainable cloud operations by optimizing AI workloads, deploying efficient hardware, and implementing advanced cooling and water management solutions. The company drives environmental stewardship through energy efficiency, recycled water data centers, and water-positive initiatives. AWS enables organizations worldwide to reduce carbon footprints while using AI and cloud services, contributing to decarbonization and sustainability goals across industries and advancing innovation in green computing and operational efficiency.
-
2024: AWS research highlighted that organizations using AI-optimized infrastructure can cut carbon emissions of AI workloads by up to 99% versus on-premises data centers.
-
2025: AWS unveiled Hong Kong’s first recycled water data center, reducing water use for cooling and supporting sustainable cloud and AI operations.
Intel Corporation
Intel Corporation is a global semiconductor and technology company focused on processors, AI solutions, and data-centric computing. Intel integrates sustainability into its operations, R&D, and supply chain, aiming for net-zero greenhouse gas emissions and promoting green computing innovations. Its Climate Transition Action Plan outlines decarbonization strategies, collaboration with suppliers, and research into energy-efficient AI and computing technologies. Intel’s ESG initiatives support global climate goals, advancing environmental responsibility while enabling high-performance computing and AI solutions for enterprise, industrial, and consumer markets.
-
2023: Intel announced plans to reduce greenhouse gas emissions across its value chain, pledging net-zero operational emissions by 2040 and promoting ecosystem-wide sustainability.
Key Players
Some of the AI In Environmental Sustainability Market Companies
-
Microsoft Corporation
-
IBM Corporation
-
Google LLC
-
Amazon Web Services (AWS)
-
Intel Corporation
-
NVIDIA Corporation
-
Siemens AG
-
General Electric (GE)
-
Schneider Electric SE
-
Accenture plc
-
Oracle Corporation
-
Enablon (Wolters Kluwer)
-
SAP SE
-
C3.ai Inc.
-
SAS Institute Inc.
-
ABB Ltd.
-
Wipro Limited
-
Hitachi, Ltd.
-
Cisco Systems, Inc.
-
Envision Energy
| Report Attributes | Details |
|---|---|
| Market Size in 2025 | USD 18.65 Billion |
| Market Size by 2035 | USD 111.70 Billion |
| CAGR | CAGR of 19.6% From 2026 to 2035 |
| Base Year | 2025 |
| Forecast Period | 2026-2035 |
| Historical Data | 2022-2024 |
| Report Scope & Coverage | Market Size, Segments Analysis, Competitive Landscape, Regional Analysis, DROC & SWOT Analysis, Forecast Outlook |
| Key Segments | • By Application (Climate Change Mitigation, Renewable Energy Optimization, Waste Management, Water Resource Management, Biodiversity & Wildlife Monitoring, Precision Agriculture, Air Quality Monitoring, Natural Disaster Prediction & Response) • By Technology (Machine Learning, Computer Vision, Natural Language Processing, Predictive Analytics, Reinforcement Learning) • By End Use (Government & Public Sector, Energy & Utilities, Agriculture, Transportation & Logistics, Manufacturing) • By Deployment Mode (Cloud-Based, On-Premise, Hybrid Deployment) |
| Regional Analysis/Coverage | North America (US, Canada), Europe (Germany, UK, France, Italy, Spain, Russia, Poland, Rest of Europe), Asia Pacific (China, India, Japan, South Korea, Australia, ASEAN Countries, Rest of Asia Pacific), Middle East & Africa (UAE, Saudi Arabia, Qatar, South Africa, Rest of Middle East & Africa), Latin America (Brazil, Argentina, Mexico, Colombia, Rest of Latin America). |
| Company Profiles | Microsoft Corporation, IBM Corporation, Google LLC, Amazon Web Services (AWS), Intel Corporation, NVIDIA Corporation, Siemens AG, General Electric (GE), Schneider Electric SE, Accenture plc, Oracle Corporation, Enablon (Wolters Kluwer), SAP SE, C3.ai Inc., SAS Institute Inc., ABB Ltd., Wipro Limited, Hitachi, Ltd., Cisco Systems, Inc., Envision Energy, and Others. |
Frequently Asked Questions
Ans: North America dominated the AI In Environmental Sustainability Market in 2025.
Ans: The Climate Change Mitigation segment dominated the AI In Environmental Sustainability Market.
Ans: The major growth factor of the AI in Environmental Sustainability Market is the rising demand for real-time data-driven solutions to address climate and environmental challenges.
Ans: The AI In Environmental Sustainability Market was valued at USD 18.65 billion in 2025 and is expected to reach USD 111.70 billion by 2035, growing at a CAGR of 19.6% from 2026-2035.
Ans: The AI In Environmental Sustainability Market is expected to grow at a CAGR of 19.6% during 2026-2035.
Get in Touch
