Product Analytics Market Report Scope & Overview:
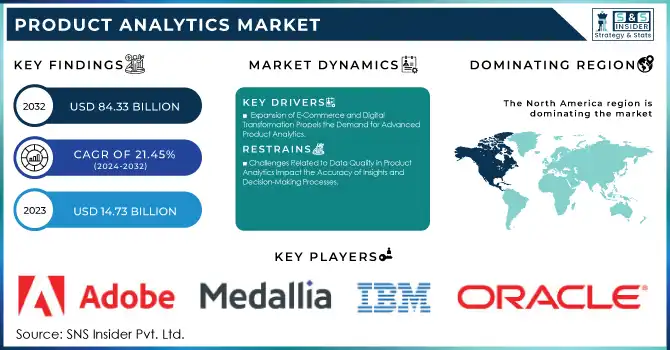
The Product Analytics Market was valued at USD 14.73 billion in 2023 and is expected to reach USD 84.33 billion by 2032, growing at a CAGR of 21.45% from 2024-2032.
To Get More Information on Product Analytics Market - Request Sample Report
The Product Analytics Market is experiencing significant expansion as companies recognize the value of data-driven insights for improving product performance and customer satisfaction. In 2023, 91.9% of companies realized quantifiable benefits from their investments in data and analytics, highlighting their increasing importance in achieving business success. As companies aim to enhance their product offerings, the need for real-time data analytics platforms has increased significantly, particularly in the sectors of e-commerce, retail, and technology. In 2023, more than 75% of companies indicated that they were fostering innovation through data, and half felt they were competing using data and analytics. These platforms allow companies to examine consumer behavior, monitor product utilization, and optimize operations. As the focus shifts to individualized experiences, data analysis becomes essential for innovation and customer contentment.In January 2025, Clarivate introduced DRG Fusion, a modular analytics platform for life sciences organizations, further highlighting the market's expanding reliance on data-driven solutions.
As machine learning and artificial intelligence technologies, the need for advanced product analytics solutions is rising in multiple industries. These technologies allow companies to forecast product trends, spot inefficiencies, and enhance development cycles. In September 2024, Salesforce launched Tableau Einstein, an analytics platform powered by AI that improves CRM functions with real-time insights, predictive analytics, and automated decision-making tools to increase efficiency. The combination of product analytics with enterprise systems, like marketing and supply chain management, improves decision-making. As these tools lower in cost, small and medium-sized businesses are increasingly embracing them, which boosts market growth and enhances business capacities.
The Product Analytics Market offers substantial growth potential as digital transformation continues to advance in various industries. The combination of predictive analytics, automation, and AI-powered insights will define the upcoming stage of market evolution. In February 2024, Medallia introduced four AI-powered innovations—Ask Athena, Intelligent Summaries, Smart Response, and Themes—to enhance and customize customer and employee experiences. Moreover, the growth of Internet of Things devices facilitates real-time data gathering from products in industries such as manufacturing and healthcare, boosting the significance of product analytics and propelling global market growth as companies pursue ongoing innovation and competitive edge.Bottom of Form
Product Analytics Market Market Dynamics
Drivers
-
Expansion of E-Commerce and Digital Transformation Propels the Demand for Advanced Product Analytics
The rapid expansion of e-commerce platforms and the continuous digital evolution in various sectors are greatly enhancing the demand for advanced product analytics. As companies move into the digital world, they need tools that allow for the gathering and examination of large quantities of customer and product information. This change allows organizations to customize their offerings and enhance customer experiences through personalized recommendations and smooth interactions. Additionally, utilizing product analytics allows companies to track product performance instantly, recognize areas for improvement, and confirm that products meet customer expectations. In a rapidly evolving digital market, the information gained from these analytics enables companies to stay competitive, enhance operations, and foster innovation by swiftly adapting to market trends and consumer needs. This trend is crucial for businesses seeking to remain pertinent in the digital era.
-
Technological Advancements in Artificial Intelligence and Machine Learning Revolutionize Product Analytics
Advancements in Artificial Intelligence and Machine Learning is revolutionizing product analytics by allowing businesses to extract valuable insights from large datasets. AI and ML technologies enable predictive analytics, assisting companies in anticipating market trends, consumer behavior, and product effectiveness. These technologies are also vital in improving product development, enabling faster modifications informed by data-driven insights. Through the use of sophisticated algorithms, businesses can better categorize customers, tailor their offerings, and improve pricing strategies. AI and ML facilitate the automation of data analysis, minimizing the time needed for decision-making and enhancing overall operational efficiency. Consequently, companies can make better-informed, prompt decisions that foster product innovation, enhance customer satisfaction, and sustain competitiveness in a rapidly changing market landscape.
Restraints
-
Challenges Related to Data Quality in Product Analytics Impact the Accuracy of Insights and Decision-Making Processes
Inaccurate, incomplete, or inconsistent data is a significant challenge in the product analytics market, as it can lead to misleading insights and poor decision-making. The effectiveness of product analytics solutions heavily relies on the quality of the data being analyzed. When data is unreliable, businesses risk drawing incorrect conclusions, which can negatively impact product development, customer segmentation, and marketing strategies. Data quality issues can arise from various sources, such as improper data collection methods, lack of standardization, or human error during data entry. To ensure accurate and actionable insights, organizations need to invest in data cleansing, validation processes, and quality control measures. Without proper data management, the benefits of product analytics may be severely diminished, hindering companies’ ability to make data-driven decisions and achieve desired business outcomes.
-
High Implementation Costs of Advanced Product Analytics Tools Pose a Barrier to Widespread Adoption
The adoption of advanced product analytics tools comes with significant financial investment, which can be a major hurdle for many businesses, particularly small and medium-sized enterprises. The costs associated with purchasing sophisticated software, upgrading infrastructure, and hiring or training skilled personnel can be prohibitive for organizations with limited budgets. For many SMEs, these financial burdens can outweigh the perceived benefits, limiting their ability to implement product analytics solutions effectively. Furthermore, the ongoing costs of maintaining these systems, such as software updates and data storage, can add to the financial strain. As a result, businesses may struggle to justify the investment in advanced product analytics, slowing down market growth and limiting the accessibility of these powerful tools to a broader range of organizations.
Product Analytics Market Segment Analysis
By Component
The Solution segment dominated the Product Analytics Market with the highest revenue share of about 80% in 2023. This dominance is primarily attributed to the increasing demand for comprehensive analytics tools that enable organizations to gain deep insights into product performance, customer behavior, and market trends. As businesses strive for greater operational efficiency and enhanced product development, the need for sophisticated solutions that integrate with existing systems and deliver actionable insights has led to this segment’s substantial market share.
The Services segment is expected to grow at the fastest CAGR of about 24.45% from 2024 to 2032. This rapid growth is driven by the increasing need for implementation, consulting, and support services as businesses adopt complex product analytics solutions. With organizations seeking guidance in navigating these advanced technologies, the demand for professional services that ensure seamless integration, optimization, and continuous support is surging, positioning this segment as a key driver of the market’s expansion in the coming years.
By Application
The Consumer Engagement segment dominated the Product Analytics Market with the highest revenue share of about 41% in 2023. This dominance can be attributed to the growing emphasis on personalized customer experiences and the need for businesses to understand customer behavior in real-time. With the increasing availability of data and the rise of omnichannel strategies, companies are leveraging advanced analytics to boost customer loyalty, optimize engagement, and improve retention, making this segment a key driver in the market.
The Sales and Marketing segment is expected to grow at the fastest CAGR of about 22.99% from 2024 to 2032. This rapid growth is fueled by businesses’ increasing reliance on data-driven strategies to enhance sales performance and optimize marketing campaigns. Product analytics solutions enable companies to track customer preferences, predict trends, and refine targeted marketing efforts, all of which contribute to higher conversion rates and more efficient sales cycles. As companies look to maximize their return on investment in marketing activities, this segment is set to experience significant expansion in the coming years.
By Mode
The Tracking Data segment dominated the Product Analytics Market with the highest revenue share of about 56% in 2023. This dominance is driven by the growing need for businesses to monitor and collect detailed data on product performance, customer interactions, and operational metrics. As companies strive to optimize product development and improve customer satisfaction, the ability to track and analyze these data points in real-time has become essential, making this segment the cornerstone of product analytics.
The Analyzing Data segment is expected to grow at the fastest CAGR of about 22.70% from 2024 to 2032. This growth is fueled by the increasing importance of actionable insights derived from the vast amounts of tracking data collected. As organizations look to turn raw data into strategic decisions, the demand for advanced analytics tools that process and interpret data efficiently is rising. This trend is propelling the analyzing data segment as businesses seek to gain deeper insights into trends, behaviors, and product performance to stay competitive.
By Vertical
The Retail & E-commerce segment dominated the Product Analytics Market with the highest revenue share of about 27% in 2023. This dominance is primarily due to the rapid growth of online shopping and the increasing need for businesses to enhance customer experiences through personalized product offerings. With the vast amounts of data generated from customer interactions, retailers are leveraging product analytics to track consumer preferences, optimize inventory management, and improve sales strategies, driving significant market share in this sector.
The Media & Entertainment segment is expected to grow at the fastest CAGR of about 29.06% from 2024 to 2032. This rapid growth is fueled by the increasing shift towards digital content consumption and the need for media companies to better understand audience behavior. As consumers increasingly demand personalized content, product analytics tools enable media and entertainment businesses to track user engagement, optimize content recommendations, and enhance monetization strategies, leading to a surge in demand for advanced analytics in this dynamic sector.
Regional Analysis
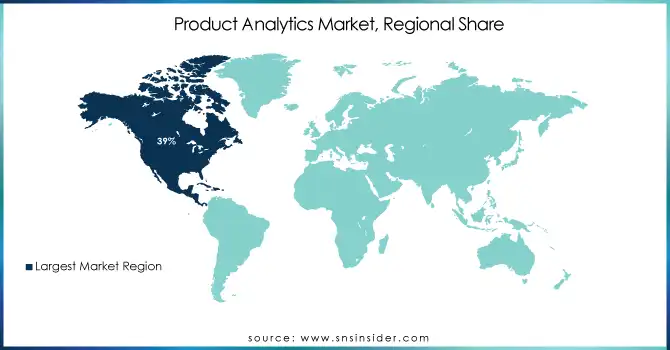
North America dominated the Product Analytics Market with the highest revenue share of about 39% in 2023. This leadership position is largely driven by the region's advanced technological infrastructure, high adoption rates of digital transformation, and the presence of major market players. Companies in North America are increasingly leveraging product analytics to optimize operations, enhance customer experience, and foster innovation, making it a key region for market growth and development.
The Asia Pacific region is expected to grow at the fastest CAGR of about 23.93% from 2024 to 2032. This growth is fueled by the rapid expansion of e-commerce, digitalization, and an increasing focus on data-driven decision-making across industries. As businesses in Asia Pacific accelerate their adoption of advanced product analytics solutions, driven by the rising demand for personalized products and improved customer engagement, the region is poised to become a major player in the market’s expansion over the next decade.
Do You Need any Customization Research on Product Analytics Market - Enquire Now
Key Players
-
Google (Google Analytics, Google Optimize)
-
IBM (IBM Watson Analytics, IBM SPSS Statistics)
-
Oracle (Oracle Analytics Cloud, Oracle Business Intelligence)
-
Adobe (Adobe Analytics, Adobe Target)
-
Salesforce (Salesforce Analytics Cloud, Salesforce Marketing Cloud)
-
Medallia (Medallia Experience Cloud, Medallia Analytics)
-
Veritone (Veritone Discover, Veritone aiWARE)
-
LatentView Analytics (LatentView Data Analytics, LatentView Predictive Analytics)
-
Mixpanel (Mixpanel Analytics, Mixpanel A/B Testing)
-
Amplitude (Amplitude Analytics, Amplitude Experiment)
-
Pendo (Pendo Analytics, Pendo Engage)
-
Kissmetrics (Kissmetrics Analytics, Kissmetrics Insights)
-
Gainsight (Gainsight PX, Gainsight CS)
-
UserIQ (UserIQ Insights, UserIQ Engage)
-
Copper CRM (Copper Analytics, Copper CRM)
-
Heap (Heap Analytics, Heap Data Automation)
-
Plytix (Plytix Analytics, Plytix Product Information Management)
-
Risk Edge Solutions (RiskEdge Advanced Analytics, RiskEdge Predictive Modeling)
-
Woopra (Woopra Analytics, Woopra Insights)
-
Piwik PRO (Piwik PRO Analytics, Piwik PRO Tag Manager)
-
Smartlook (Smartlook Analytics, Smartlook Session Replay)
-
LogRocket (LogRocket Analytics, LogRocket Session Replay)
-
Auryc (Auryc Analytics, Auryc Session Replay)
-
Quantum Metric (Quantum Metric Analytics, Quantum Metric Session Replay)
-
cux.io (CUX Analytics, CUX Session Replay)
-
Refiner (Refiner Analytics, Refiner Survey Tool)
-
InnerTrends (InnerTrends Analytics, InnerTrends Insights)
Recent Developments:
-
In 2024, Google Cloud launched new generative AI-powered tools for data management and analytics, including AlloyDB AI and Gemini models for BigQuery. These capabilities support vector search, unstructured data analysis, and enhanced AI integration, helping businesses improve their analytics and operational efficiency.
-
At the 2024 IBM TechXchange Conference, IBM introduced a range of AI-driven products, including Granite 3.0 AI models for enterprise applications, new features in Watsonx.ai for developers, and the watsonx Code Assistant to enhance developer productivity.
-
At Oracle CloudWorld 2024, Oracle unveiled new AI-powered features for Fusion Data Intelligence, including intelligent applications for HR and supply chain management. These tools aim to help businesses make faster, data-driven decisions by recommending actions and improving overall operational efficiency.
| Report Attributes | Details |
|---|---|
| Market Size in 2023 | USD 14.73 Billion |
| Market Size by 2032 | USD 84.33 Billion |
| CAGR | CAGR of 21.45% From 2024 to 2032 |
| Base Year | 2023 |
| Forecast Period | 2024-2032 |
| Historical Data | 2020-2022 |
| Report Scope & Coverage | Market Size, Segments Analysis, Competitive Landscape, Regional Analysis, DROC & SWOT Analysis, Forecast Outlook |
| Key Segments | • By Component (Solution, Services) • By Deployment (Cloud, On-premises) • By Organization Size (SMEs, Large Enterprises) • By Mode (Tracking Data, Analyzing Data) • By Application (Design and Manufacturing, Sales and Marketing, Consumer Engagement) • By Vertical (BFSI, Retail & E-commerce, IT & Telecommunication, Automotive, Media & Entertainment, Manufacturing, Healthcare & Pharmaceuticals, Energy & Utilities, Others) |
| Regional Analysis/Coverage | North America (US, Canada, Mexico), Europe (Eastern Europe [Poland, Romania, Hungary, Turkey, Rest of Eastern Europe] Western Europe] Germany, France, UK, Italy, Spain, Netherlands, Switzerland, Austria, Rest of Western Europe]), Asia Pacific (China, India, Japan, South Korea, Vietnam, Singapore, Australia, Rest of Asia Pacific), Middle East & Africa (Middle East [UAE, Egypt, Saudi Arabia, Qatar, Rest of Middle East], Africa [Nigeria, South Africa, Rest of Africa], Latin America (Brazil, Argentina, Colombia, Rest of Latin America) |
| Company Profiles | Google, IBM, Oracle, Adobe, Salesforce, Medallia, Veritone, LatentView Analytics, Mixpanel, Amplitude, Pendo, Kissmetrics, Gainsight, UserIQ, Copper CRM, Heap, Plytix, Risk Edge Solutions, Woopra, Piwik PRO, Smartlook, LogRocket, Auryc, Quantum Metric, cux.io, Refiner, InnerTrends. |
| Key Drivers | • Expansion of E-Commerce and Digital Transformation Propels the Demand for Advanced Product Analytics • Technological Advancements in Artificial Intelligence and Machine Learning Revolutionize Product Analytics |
| RESTRAINTS | • Challenges Related to Data Quality in Product Analytics Impact the Accuracy of Insights and Decision-Making Processes • High Implementation Costs of Advanced Product Analytics Tools Pose a Barrier to Widespread Adoption |
Get in Touch
