image

AI Price Optimization Software Market Size, Share & Segmentation By Component (Software, Services), Application (Retail, E-commerce, Travel and Hospitality, Automotive, Others), Deployment Mode (On-Premises, Cloud), Enterprise Size (Small and Medium Enterprises, Large Enterprises), Region | Global Forecast 2025-2032

Date: June 2025 Report Code: SNS/ICT/7608 Page 320

AI Price Optimization Software Market Report Scope & Overview:

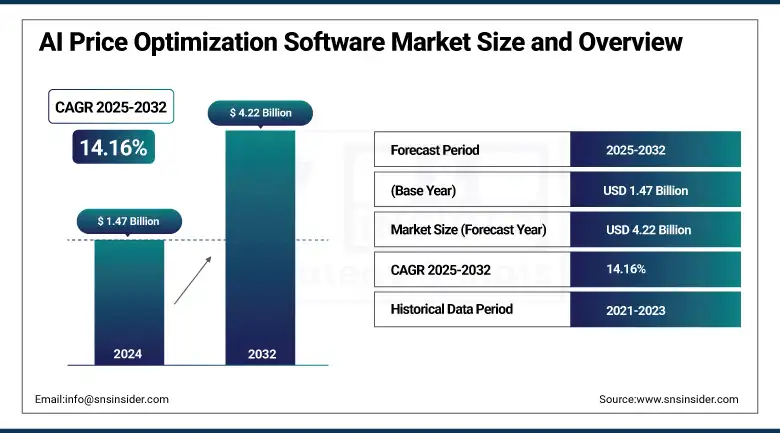
AI Price Optimization Software Market was valued at USD 1.47 billion in 2024 and is expected to reach USD 4.22 billion by 2032, growing at a CAGR of 14.16% from 2025-2032. 

The AI Price Optimization Software Market is expanding due to rising demand for of e-commerce, and personalizing the user experience, the AI Price Optimization Software Market is developing. Businesses analyse data with AI, predict behaviour, and change prices dynamically.  Cloud-based services are often integrated into ERP, CRM, and POS systems to increase these efficiencies. Many important areas of opportunity including retail , travel, automotive, and hospitality, are deploying AI pricing to improve margins, reduce errors, and react quickly to changes in consumer behaviour.

In 2025, Amazon continues to tweak prices every ~10 minutes across millions of SKUs, adjusting based on demand, competitors, stock, and browsing history.

Furthermore, a U.S. Federal Reserve commissioned study reported that 5–10% of firms across various industries expected to implement AI within six months of 2024, with sectors like Information and Professional Services already seeing adoption rates of 27–45%.

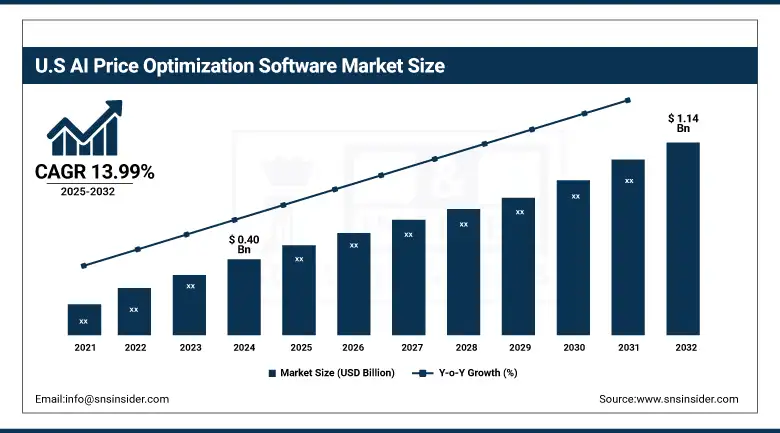
U.S. AI Price Optimization Software Market was valued at USD 0.40 billion in 2024 and is expected to reach USD 1.14 billion by 2032, growing at a CAGR of 13.99% from 2025-2032. 

The U.S AI Price Optimization Software Market is growing as the retail and e-commerce sectors increasingly adopt AI to make pricing decisions. Companies are looking for highly personalized pricing strategies. AI Price Optimization Software offers integration with cloud application platforms, enabling companies to make pricing decisions faster based on customer demand.

Market Dynamics

Drivers

  • Growing demand for real-time dynamic pricing across retail and e-commerce is accelerating the adoption of AI price optimization tools.

Increasing retail and e-commerce demand for dynamic real-time pricing is driving AI price optimization adoption. Companies need flexible pricing solutions to remain competitive in rapidly evolving markets. AI-powered software continuously adjusts prices according to demand, competitor behavior, inventory, and consumer activity. With product life cycles decreasing and price sensitivity increasing, firms employ AI to capture the most revenue and maintain margins. Through examining enormous quantities of data in real-time and price scenario simulation, AI enables companies to provide competitive, profitable pricing in retail, travel, and consumer electronics.

During events or competitive shifts, Amazon may alter prices by as much as 20%, reflecting rapid responsiveness. Additionally, 20–40% of U.S. workers now use AI at work, and firm-level adoption varies from around 5% to nearly 40%, highlighting the growing enterprise-level integration of AI tools.

Restraints

  • Concerns around data privacy, regulatory compliance, and AI model transparency reduce enterprise confidence in price optimization platforms.

As there is increasing regulatory attention and customer demand for data protection, businesses are wary of implementing AI platforms that use sensitive data. Customer data, competitor prices, and market activity are sources of concern about privacy and adherence to regulations such as GDPR and CCPA. Moreover, AI pricing models usually exist in the form of "black boxes" with no possibility to comprehend or audit their decisions. The absence of explainability creates trust problems, particularly in industries like healthcare or finance, where prices' fairness and explainability matter. These issues serve as a limit for wider adoption.

Opportunities

  • Emergence of AI-as-a-Service platforms lowers entry barriers and democratizes access to price optimization capabilities for all business sizes.

Cloud AI-as-a-Service solutions provide enterprises with access to sophisticated price optimization technologies without the expense of large infrastructure investments. Modular, scalable, and simple to integrate, these platforms facilitate the adoption of AI-powered pricing strategies by even small and medium-sized businesses. Through these solutions' flexible pricing models, real-time analytics, and API-based integration, businesses in any industry can enhance competitiveness and decision-making. As these easy-to-use services continue to grow up, adoption is speeding up, opening new possibilities and enabling under-penetrated markets to tap into AI with little IT overhead.

A 2025 survey reveals 82% of small businesses consider AI adoption critical to staying competitive 25% are actively using AI, and over 50% are exploring it, signaling a rapid shift from experimentation to strategic use.

Furthermore, according to the U.S. Chamber of Commerce, 98% of small businesses use at least one AI-enabled tool, and 40% use generative AI up from 23% in 2023 while 91% believe AI will drive future business growth.

Challenges

  • Complexity of integrating AI pricing tools with legacy ERP, CRM, and POS systems delays enterprise implementation timelines.

Large enterprises usually encounter technical issues in implementing AI pricing software into current IT environments. Legacy ERP, CRM, and POS systems are often outdated or incompatible with contemporary AI APIs. Integrating them entails extensive customization, cleansing of data, and redesign of processes, leading to long implementation cycles and greater chances of failure. This makes adoption underhasty, particularly in industries with extended procurement cycles. Technical constraints in integrating real-time data flow among platforms restrict the performance of AI models and reduce market penetration.

Segment Analysis

By Component

The Software segment dominated the AI Price Optimization Software Market in 2024 with approximately 70% revenue share because of its scalability, ease of integration, and high demand for standalone pricing software in industries. Companies are more inclined toward software solutions for their flexibility, analysis of data, and integration with current systems, which minimize operating friction and increase speed of decision-making, so software is the most used solution type for AI-powered pricing strategies worldwide.

The Services segment is expected to expand at the fastest CAGR of 15.99% during 2025–2032 as a result of increasing demand for consulting, deployment, and training services among enterprise AI adopters. Most companies, especially new adopters, need professional expertise to design algorithms, integrate systems, and maximize performance. Managed and professional services also fill internal capability gaps, driving robust growth in this segment over the forecast period.

By Enterprise Size

Large Enterprises led the market in 2024 with a 62% share of revenue, fueled by their solid IT infrastructure, large budgets, and high emphasis on sophisticated pricing analytics. They generally operate on a large scale with complicated product offerings that can be served by dynamic, AI-based pricing strategies. Their willingness to embrace the latest technology and invest in long-term optimization software accounts for their revenue leadership.

Small and Medium Enterprises are poised to expand at the fastest CAGR of 15.22% between 2025–2032, driven by expanding access to cheap, cloud-based pricing platforms for AI. Availability of AI-as-a-Service and scalable subscription plans makes it easy for SMEs to get started. Seeking to remain competitive versus large companies, these organizations are looking for intelligent pricing solutions for improving efficiency, revenue, and customer targeting.

By Application

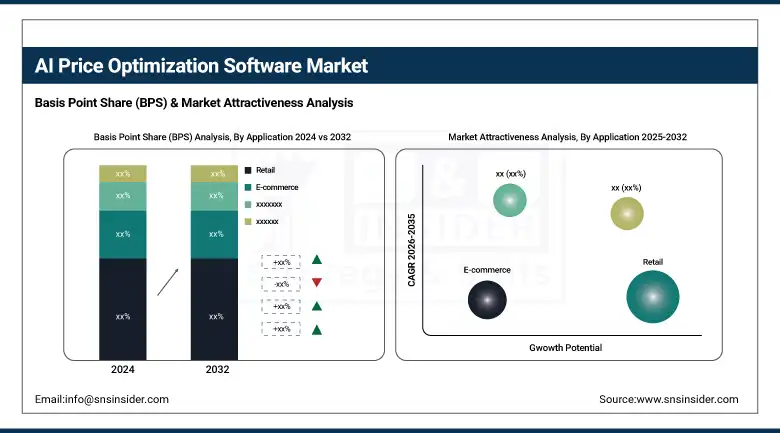
Retail held the largest revenue share of about 31% in 2024 due to its high dependence on demand-based pricing, large product assortments, and frequent promotional cycles. Retailers leverage AI pricing tools to manage markdowns, optimize margins, and respond to competitive pricing in real-time. With significant footfall and omnichannel sales, the retail sector sees AI as essential for maintaining profitability and pricing agility.

E-commerce is expected to grow at the fastest CAGR of 15.94% from 2025–2032, driven by its data-rich environment and need for hyper-dynamic pricing. Online retailers require real-time, personalized pricing to enhance conversion rates and customer retention. The scalability and automation capabilities of AI price optimization tools align well with e-commerce models, enabling rapid adjustments to meet fluctuating demand, competition, and user behavior patterns.

By Deployment Mode

The Cloud segment led the AI Price Optimization Software Market in 2024 with a 63% revenue share and is expected to record the highest CAGR of 14.66% during the period between 2025 and 2032. The reason for this leadership stems from the flexibility, scalability, and affordability of cloud platforms that enable them to reach both large businesses and SMEs. These solutions offer real-time price update capabilities, transparent integration with legacy systems, and remote access, supporting accelerated deployment and wider adoption by multiple industries looking for dynamic, data-enabled price optimization functionality.

Regional Analysis

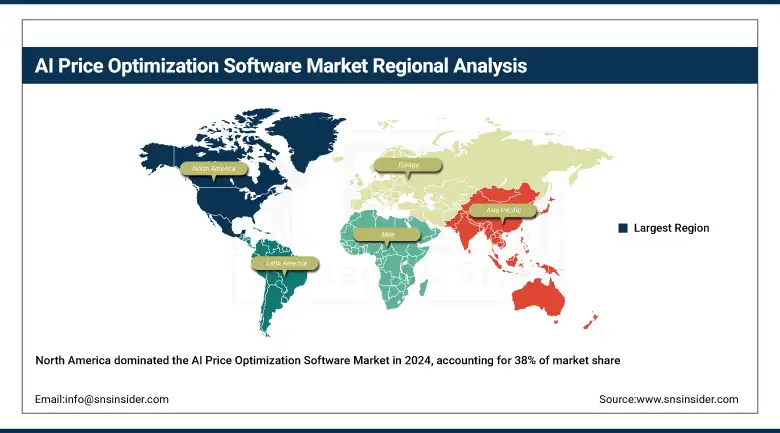
North America led the AI Price Optimization Software Market in 2024 with a 38% revenue share because of early technology adoption, robust presence of AI software vendors, and enterprises' high level of digital maturity. Advanced infrastructure across the region, extensive use of big data, and requirements for real-time pricing strategies by retail, travel, and manufacturing industries all played important roles in leading the region to its position of leadership in the international market.

The United States is leading the AI Price Optimization Software Market owing to its early embracement of AI, sophisticated IT infrastructure, and robust presence of prime vendors.

Asia Pacific is expected to grow at the fastest CAGR of 16.08% from 2025–2032, fueled by fast-paced digitalization, surging e-commerce, and growing AI investments among emerging economies. Companies in nations such as China, India, and Southeast Asia are implementing AI-powered pricing to remain competitive. Government assistance for AI projects and growing cloud infrastructure also support market development, making the region a future demand hotspot.

China is dominating the AI Price Optimization Software Market in Asia Pacific due to rapid digital transformation, massive e-commerce growth, and strong government support for AI technologies.

Europe is experiencing consistent growth in the AI Price Optimization Software Market, supported by growing digital take-up in retail, manufacturing, and logistics industries. Support for AI innovation through regulation and healthy demand for competitive pricing strategies are driving regional growth.

Germany is leading the AI Price Optimization Software Market in Europe because of its robust industrial economy, high-quality digital infrastructure, and corporate-level AI uptake.

The AI Price Optimization Software Market in the Middle East & Africa and Latin America is gradually expanding with the support of widening retail industries, growing digitalization, and rising interest in AI tools to optimize pricing efficiency and operational profitability within emerging economies.

Key Players

Zilliant, Revionics, PROS Holdings, Inc., Vendavo, Pricefx, BlackCurve, Competera, Quicklizard, Perfect Price, Intelligems, Prisync, Skuuudle, Omnia Retail, Dynamic Pricing AI, NetRivals

Recent Developments:

  • In 2025, Revionics introduced conversational analytics to its Retail Pricing AI platform, allowing users to gain real-time insights through natural language queries.

  • In 2023, Vendavo Introduced a new AI‑fueled Price Sensitivity metric in its Deal Price Optimizer, enhancing B2B revenue and profitability.

  • In 2024, Vendavo Launched “Action Adviser,” a SaaS tool offering AI‑powered recommendations to boost margin and profitability.

AI Price Optimization Software Market Report Scope:

Report Attributes Details
Market Size in 2024 USD 1.47 Billion 
Market Size by 2032 USD 4.22 Billion 
CAGR CAGR of 14.16% From 2025 to 2032
Base Year 2024
Forecast Period 2025-2032
Historical Data 2021-2023
Report Scope & Coverage Market Size, Segments Analysis, Competitive Landscape, Regional Analysis, DROC & SWOT Analysis, Forecast Outlook
Key Segments • By Component (Software, Services)
• By Application (Retail, E-commerce, Travel and Hospitality, Automotive, Others)
• By Deployment Mode (On-Premises, Cloud)
• By Enterprise Size (Small and Medium Enterprises, Large Enterprises)
Regional Analysis/Coverage North America (US, Canada, Mexico), Europe (Germany, France, UK, Italy, Spain, Poland, Turkey, Rest of Europe), Asia Pacific (China, India, Japan, South Korea, Singapore, Australia, Rest of Asia Pacific), Middle East & Africa (UAE, Saudi Arabia, Qatar, South Africa, Rest of Middle East & Africa), Latin America (Brazil, Argentina, Rest of Latin America)
Company Profiles Zilliant, Revionics, PROS Holdings, Inc., Vendavo, Pricefx, BlackCurve, Competera, Quicklizard, Perfect Price, Intelligems, Prisync, Skuuudle, Omnia Retail, Dynamic Pricing AI, NetRivals

Frequently Asked Questions

Ans: The AI Price Optimization Software Market is expected to grow at a CAGR of 14.16% from 2025 to 2032, driven by real-time pricing demand.

Ans: In 2024, the AI Price Optimization Software Market was valued at USD 1.47 billion, reflecting rising adoption across retail, travel, and e-commerce sectors.

Ans: The key growth driver is the increasing demand for real-time pricing strategies and AI’s ability to maximize revenue through dynamic, data-driven pricing.

Ans: The Software segment dominated with a 70% revenue share in 2024, due to easy integration, scalability, and growing demand for AI-powered pricing tools.

Ans: North America led the market with a 38% share in 2024, supported by early technology adoption and strong digital infrastructure in the United States.

Table Of Content

1. Introduction

1.1 Market Definition

1.2 Scope (Inclusion and Exclusions)

1.3 Research Assumptions

2. Executive Summary

2.1 Market Overview

2.2 Regional Synopsis

2.3 Competitive Summary

3. Research Methodology

3.1 Top-Down Approach

3.2 Bottom-up Approach

3.3. Data Validation

3.4 Primary Interviews

4. Market Dynamics Impact Analysis

4.1 Market Driving Factors Analysis

4.1.1 Drivers

4.1.2 Restraints

4.1.3 Opportunities

4.1.4 Challenges

4.2 PESTLE Analysis

4.3 Porter’s Five Forces Model

5. Statistical Insights and Trends Reporting

5.1 AI Model Retraining Frequency

5.2 Skew Towards Personalized Pricing

5.3 Volume of Data Processed per Day

5.4 Impact on Price Elasticity Sensitivity

5.5 Data Source Diversity

6. Competitive Landscape

6.1 List of Major Companies By Region

6.2 Market Share Analysis By Region

6.3 Product Benchmarking

6.3.1 Product specifications and features

6.3.2 Pricing

6.4 Strategic Initiatives

6.4.1 Marketing and promotional activities

6.4.2 Distribution and Supply Chain Strategies

6.4.3 Expansion plans and new product launches

6.4.4 Strategic partnerships and collaborations

6.5 Technological Advancements

6.6 Market Positioning and Branding

7. AI Price Optimization Software Market Segmentation By Application

7.1 Chapter Overview

7.2 Retail

7.2.1 Retail Market Trends Analysis (2021-2032)

7.2.2 Retail Market Size Estimates and Forecasts to 2032 (USD Billion)

7.3 Consulting Services

7.3.1 Consulting Services Market Trends Analysis (2021-2032)

7.3.2 Consulting Services Market Size Estimates and Forecasts to 2032 (USD Billion)

7.4 Travel and Hospitality

7.4.1 Travel and Hospitality Market Trends Analysis (2021-2032)

7.4.2 Travel and Hospitality Market Size Estimates and Forecasts to 2032 (USD Billion)

7.5 Automotive

7.5.1 Automotive Market Trends Analysis (2021-2032)

7.5.2 Automotive Market Size Estimates and Forecasts to 2032 (USD Billion)

7.6 Others

7.6.1 Others Market Trends Analysis (2021-2032)

7.6.2 Others Market Size Estimates and Forecasts to 2032 (USD Billion)

8. AI Price Optimization Software Market Segmentation By Component

8.1 Chapter Overview

8.2 Software

8.2.1 Software Market Trends Analysis (2021-2032)

8.2.2 Software Market Size Estimates and Forecasts to 2032 (USD Billion)

8.3 Services

         8.3.1 Services Market Trends Analysis (2021-2032)

8.3.2 Services Market Size Estimates and Forecasts to 2032 (USD Billion)

9. AI Price Optimization Software Market Segmentation By Deployment Mode

9.1 Chapter Overview

9.2 On-Premise

9.2.1 On-Premise Market Trends Analysis (2021-2032)

9.2.2 On-Premise Market Size Estimates and Forecasts to 2032 (USD Billion)

9.3 Cloud

9.3.1 Cloud Market Trends Analysis (2021-2032)

9.3.2 Cloud Market Size Estimates and Forecasts to 2032 (USD Billion)

10. AI Price Optimization Software Market Segmentation By Enterprise Size

10.1 Chapter Overview

10.2 Small and Medium Enterprises

10.2.1 Small and Medium Enterprises Market Trends Analysis (2021-2032)

10.2.2 Small and Medium Enterprises Market Size Estimates and Forecasts to 2032 (USD Billion)

10.3 Large Enterprises

10.3.1 Large Enterprises Market Trend Analysis (2021-2032)

10.3.2 Large Enterprises Market Size Estimates and Forecasts to 2032 (USD Billion)

11. Regional Analysis

11.1 Chapter Overview

11.2 North America

11.2.1 Trend Analysis

11.2.2 North America AI Price Optimization Software Market Estimates and Forecasts by Country (2021-2032) (USD Billion)

11.2.3 North America AI Price Optimization Software Market Estimates and Forecasts By Application (2021-2032) (USD Billion) 

11.2.4 North America AI Price Optimization Software Market Estimates and Forecasts By Component (2021-2032) (USD Billion)

11.2.5 North America AI Price Optimization Software Market Estimates and Forecasts By Deployment Mode (2021-2032) (USD Billion)

11.2.6 North America AI Price Optimization Software Market Estimates and Forecasts By Enterprise Size (2021-2032) (USD Billion)

11.2.7 USA

11.2.7.1 USA AI Price Optimization Software Market Estimates and Forecasts By Application (2021-2032) (USD Billion)

11.2.7.2 USA AI Price Optimization Software Market Estimates and Forecasts By Component (2021-2032) (USD Billion)

11.2.7.3 USA AI Price Optimization Software Market Estimates and Forecasts By Deployment Mode (2021-2032) (USD Billion)

11.2.7.4 USA AI Price Optimization Software Market Estimates and Forecasts By Enterprise Size (2021-2032) (USD Billion)

11.2.8 Canada

11.2.8.1 Canada AI Price Optimization Software Market Estimates and Forecasts By Application (2021-2032) (USD Billion)

11.2.8.2 Canada AI Price Optimization Software Market Estimates and Forecasts By Component (2021-2032) (USD Billion)

11.2.8.3 Canada AI Price Optimization Software Market Estimates and Forecasts By Deployment Mode (2021-2032) (USD Billion)

11.2.8.4 Canada AI Price Optimization Software Market Estimates and Forecasts By Enterprise Size (2021-2032) (USD Billion)

11.2.9 Mexico

11.2.9.1 Mexico AI Price Optimization Software Market Estimates and Forecasts By Application (2021-2032) (USD Billion)

11.2.9.2 Mexico AI Price Optimization Software Market Estimates and Forecasts By Component (2021-2032) (USD Billion)

11.2.9.3 Mexico AI Price Optimization Software Market Estimates and Forecasts By Deployment Mode (2021-2032) (USD Billion)

11.2.9.4 Mexico AI Price Optimization Software Market Estimates and Forecasts By Enterprise Size (2021-2032) (USD Billion)

11.3 Europe

11.3.1 Trend Analysis

11.3.2 Europe AI Price Optimization Software Market Estimates and Forecasts by Country (2021-2032) (USD Billion)

11.3.3 Europe AI Price Optimization Software Market Estimates and Forecasts By Application (2021-2032) (USD Billion) 

11.3.4 Europe AI Price Optimization Software Market Estimates and Forecasts By Component (2021-2032) (USD Billion)

11.3.5 Europe AI Price Optimization Software Market Estimates and Forecasts By Deployment Mode (2021-2032) (USD Billion)

11.3.6 Europe AI Price Optimization Software Market Estimates and Forecasts By Enterprise Size (2021-2032) (USD Billion)

11.3.7 Germany

11.3.7.1 Germany AI Price Optimization Software Market Estimates and Forecasts By Application (2021-2032) (USD Billion)

11.3.7.2 Germany AI Price Optimization Software Market Estimates and Forecasts By Component (2021-2032) (USD Billion)

11.3.7.3 Germany AI Price Optimization Software Market Estimates and Forecasts By Deployment Mode (2021-2032) (USD Billion)

11.3.7.4 Germany AI Price Optimization Software Market Estimates and Forecasts By Enterprise Size (2021-2032) (USD Billion)

11.3.8 France

11.3.8.1 France AI Price Optimization Software Market Estimates and Forecasts By Application (2021-2032) (USD Billion)

11.3.8.2 France AI Price Optimization Software Market Estimates and Forecasts By Component (2021-2032) (USD Billion)

11.3.8.3 France AI Price Optimization Software Market Estimates and Forecasts By Deployment Mode (2021-2032) (USD Billion)

11.3.8.4 France AI Price Optimization Software Market Estimates and Forecasts By Enterprise Size (2021-2032) (USD Billion)

11.3.9 UK

11.3.9.1 UK AI Price Optimization Software Market Estimates and Forecasts By Application (2021-2032) (USD Billion)

11.3.9.2 UK AI Price Optimization Software Market Estimates and Forecasts By Component (2021-2032) (USD Billion)

11.3.9.3 UK AI Price Optimization Software Market Estimates and Forecasts By Deployment Mode (2021-2032) (USD Billion)

11.3.9.4 UK AI Price Optimization Software Market Estimates and Forecasts By Enterprise Size  (2021-2032) (USD Billion)

11.3.10 Italy

11.3.10.1 ItalyAI Price Optimization Software Market Estimates and Forecasts By Application (2021-2032) (USD Billion)

11.3.10.2 Italy AI Price Optimization Software Market Estimates and Forecasts By Component (2021-2032) (USD Billion)

11.3.10.3 Italy AI Price Optimization Software Market Estimates and Forecasts By Deployment Mode (2021-2032) (USD Billion)

11.3.10.4 Italy AI Price Optimization Software Market Estimates and Forecasts By Enterprise Size (2021-2032) (USD Billion)

11.3.11 Spain

11.3.11.1 Spain AI Price Optimization Software Market Estimates and Forecasts By Application (2021-2032) (USD Billion)

11.3.11.2 Spain AI Price Optimization Software Market Estimates and Forecasts By Component (2021-2032) (USD Billion)

11.3.11.3 Spain AI Price Optimization Software Market Estimates and Forecasts By Deployment Mode (2021-2032) (USD Billion)

11.3.11.4 Spain AI Price Optimization Software Market Estimates and Forecasts By Enterprise Size (2021-2032) (USD Billion)

11.3.12 Poland

11.3.12.1 Poland AI Price Optimization Software Market Estimates and Forecasts By Application (2021-2032) (USD Billion)

11.3.12.2 Poland AI Price Optimization Software Market Estimates and Forecasts By Component (2021-2032) (USD Billion)

11.3.12.3 Poland AI Price Optimization Software Market Estimates and Forecasts By Deployment Mode (2021-2032) (USD Billion)

11.3.12.4 Poland AI Price Optimization Software Market Estimates and Forecasts By Enterprise Size (2021-2032) (USD Billion)

11.3.13 Turkey

11.3.13.1 Turkey AI Price Optimization Software Market Estimates and Forecasts By Application (2021-2032) (USD Billion)

11.3.13.2 Turkey AI Price Optimization Software Market Estimates and Forecasts By Component (2021-2032) (USD Billion)

11.3.13.3 Turkey AI Price Optimization Software Market Estimates and Forecasts By Deployment Mode (2021-2032) (USD Billion)

11.3.13.4 Turkey AI Price Optimization Software Market Estimates and Forecasts By Enterprise Size (2021-2032) (USD Billion)

11.3.14 Rest of Europe

11.3.14.1 Rest of Europe AI Price Optimization Software Market Estimates and Forecasts By Application (2021-2032) (USD Billion)

11.3.14.2 Rest of Europe AI Price Optimization Software Market Estimates and Forecasts By Component (2021-2032) (USD Billion)

11.3.14.3 Rest of Europe AI Price Optimization Software Market Estimates and Forecasts By Deployment Mode (2021-2032) (USD Billion)

11.3.14.4 Rest of Europe AI Price Optimization Software Market Estimates and Forecasts By Enterprise Size (2021-2032) (USD Billion)

11.4 Asia Pacific

11.4.1 Trend Analysis

11.4.2 Asia Pacific AI Price Optimization Software Market Estimates and Forecasts by Country (2021-2032) (USD Billion)

11.4.3 Asia Pacific AI Price Optimization Software Market Estimates and Forecasts By Application (2021-2032) (USD Billion) 

11.4.4 Asia Pacific AI Price Optimization Software Market Estimates and Forecasts By Component (2021-2032) (USD Billion)

11.4.5 Asia Pacific AI Price Optimization Software Market Estimates and Forecasts By Deployment Mode (2021-2032) (USD Billion)

11.4.6 Asia Pacific AI Price Optimization Software Market Estimates and Forecasts By Enterprise Size (2021-2032) (USD Billion)

11.4.7 China

11.4.7.1 China AI Price Optimization Software Market Estimates and Forecasts By Application (2021-2032) (USD Billion)

11.4.7.2 China AI Price Optimization Software Market Estimates and Forecasts By Component (2021-2032) (USD Billion)

11.4.7.3 China AI Price Optimization Software Market Estimates and Forecasts By Deployment Mode (2021-2032) (USD Billion)

11.4.7.4 China AI Price Optimization Software Market Estimates and Forecasts By Enterprise Size (2021-2032) (USD Billion)

11.4.8 India

11.4.8.1 India AI Price Optimization Software Market Estimates and Forecasts By Application (2021-2032) (USD Billion)

11.4.8.2 India AI Price Optimization Software Market Estimates and Forecasts By Component (2021-2032) (USD Billion)

11.4.8.3 India AI Price Optimization Software Market Estimates and Forecasts By Deployment Mode (2021-2032) (USD Billion)

11.4.8.4 India AI Price Optimization Software Market Estimates and Forecasts By Enterprise Size (2021-2032) (USD Billion)

11.4.9 Japan

11.4.9.1 Japan AI Price Optimization Software Market Estimates and Forecasts By Application (2021-2032) (USD Billion)

11.4.9.2 Japan AI Price Optimization Software Market Estimates and Forecasts By Component (2021-2032) (USD Billion)

11.4.9.3 Japan AI Price Optimization Software Market Estimates and Forecasts By Deployment Mode (2021-2032) (USD Billion)

11.4.9.4 Japan AI Price Optimization Software Market Estimates and Forecasts By Enterprise Size (2021-2032) (USD Billion)

11.4.10 South Korea

11.4.10.1 South Korea AI Price Optimization Software Market Estimates and Forecasts By Application (2021-2032) (USD Billion)

11.4.10.2 South Korea AI Price Optimization Software Market Estimates and Forecasts By Component (2021-2032) (USD Billion)

11.4.10.3 South Korea AI Price Optimization Software Market Estimates and Forecasts By Deployment Mode (2021-2032) (USD Billion)

11.4.10.4 South Korea AI Price Optimization Software Market Estimates and Forecasts By Enterprise Size (2021-2032) (USD Billion)

11.4.11 Singapore

11.4.11.1 Singapore AI Price Optimization Software Market Estimates and Forecasts By Application (2021-2032) (USD Billion)

11.4.11.2 Singapore AI Price Optimization Software Market Estimates and Forecasts By Component (2021-2032) (USD Billion)

11.4.11.3 Singapore AI Price Optimization Software Market Estimates and Forecasts By Deployment Mode (2021-2032) (USD Billion)

11.4.11.4 Singapore AI Price Optimization Software Market Estimates and Forecasts By Enterprise Size (2021-2032) (USD Billion)

11.4.12 Australia

11.4.12.1 Australia AI Price Optimization Software Market Estimates and Forecasts By Application (2021-2032) (USD Billion)

11.4.12.2 Australia AI Price Optimization Software Market Estimates and Forecasts By Component (2021-2032) (USD Billion)

11.4.12.3 Australia AI Price Optimization Software Market Estimates and Forecasts By Deployment Mode (2021-2032) (USD Billion)

11.4.12.4 Australia AI Price Optimization Software Market Estimates and Forecasts By Enterprise Size (2021-2032) (USD Billion)

11.4.13 Rest of Asia Pacific

11.4.13.1 Rest of Asia Pacific AI Price Optimization Software Market Estimates and Forecasts By Application (2021-2032) (USD Billion)

11.4.13.2 Rest of Asia Pacific AI Price Optimization Software Market Estimates and Forecasts By Component (2021-2032) (USD Billion)

11.4.13.3 Rest of Asia Pacific AI Price Optimization Software Market Estimates and Forecasts By Deployment Mode (2021-2032) (USD Billion)

11.4.13.4 Rest of Asia Pacific AI Price Optimization Software Market Estimates and Forecasts By Enterprise Size (2021-2032) (USD Billion)

11.5 Middle East and Africa

11.5.1 Trend Analysis

11.5.2 Middle East and Africa AI Price Optimization Software Market Estimates and Forecasts by Country (2021-2032) (USD Billion)

11.5.3 Middle East and Africa AI Price Optimization Software Market Estimates and Forecasts By Application (2021-2032) (USD Billion) 

11.5.4 Middle East and Africa AI Price Optimization Software Market Estimates and Forecasts By Component (2021-2032) (USD Billion)

11.5.5 Middle East and Africa AI Price Optimization Software Market Estimates and Forecasts By Deployment Mode (2021-2032) (USD Billion)

11.5.6 Middle East and Africa AI Price Optimization Software Market Estimates and Forecasts By Enterprise Size (2021-2032) (USD Billion)

11.5.7 UAE

11.5.7.1 UAE AI Price Optimization Software Market Estimates and Forecasts By Application (2021-2032) (USD Billion)

11.5.7.2 UAE AI Price Optimization Software Market Estimates and Forecasts By Component (2021-2032) (USD Billion)

11.5.7.3 UAE AI Price Optimization Software Market Estimates and Forecasts By Deployment Mode (2021-2032) (USD Billion)

11.5.7.4 UAE AI Price Optimization Software Market Estimates and Forecasts By Enterprise Size (2021-2032) (USD Billion)

11.5.8 Saudi Arabia

11.5.8.1 Saudi Arabia AI Price Optimization Software Market Estimates and Forecasts By Application (2021-2032) (USD Billion)

11.5.8.2 Saudi Arabia AI Price Optimization Software Market Estimates and Forecasts By Component (2021-2032) (USD Billion)

11.5.8.3 Saudi Arabia AI Price Optimization Software Market Estimates and Forecasts By Deployment Mode (2021-2032) (USD Billion)

11.5.8.4 Saudi Arabia AI Price Optimization Software Market Estimates and Forecasts By Enterprise Size (2021-2032) (USD Billion)

11.5.9 Qatar

                     11.5.9.1 Qatar AI Price Optimization Software Market Estimates and Forecasts By Application (2021-2032) (USD Billion)

11.5.9.2 Qatar AI Price Optimization Software Market Estimates and Forecasts By Component (2021-2032) (USD Billion)

11.5.9.3 Qatar AI Price Optimization Software Market Estimates and Forecasts By Deployment Mode (2021-2032) (USD Billion)

11.5.1.9.4 Qatar AI Price Optimization Software Market Estimates and Forecasts By Enterprise Size (2021-2032) (USD Billion)

11.5.10   South Africa

11.5.10.1 South Africa AI Price Optimization Software Market Estimates and Forecasts By Application (2021-2032) (USD Billion)

11.5.10.2 South Africa AI Price Optimization Software Market Estimates and Forecasts By Component (2021-2032) (USD Billion)

11.5.10.3 South Africa AI Price Optimization Software Market Estimates and Forecasts By Deployment Mode (2021-2032) (USD Billion)

11.5.10.4 South Africa AI Price Optimization Software Market Estimates and Forecasts By Enterprise Size (2021-2032) (USD Billion)

11.5.11 Rest of Middle East & Africa

                    11.5.11.1 Rest of Middle East & Africa AI Price Optimization Software Market Estimates and Forecasts By Application (2021-2032) (USD Billion)

11.5.11.2 Rest of Middle East & Africa  AI Price Optimization Software Market Estimates and Forecasts By Component (2021-2032) (USD Billion)

11.5.11.3 Rest of Middle East & Africa AI Price Optimization Software Market Estimates and Forecasts By Deployment Mode (2021-2032) (USD Billion)

11.5.11.4 Rest of Middle East & Africa AI Price Optimization Software Market Estimates and Forecasts By Enterprise Size (2021-2032) (USD Billion)

11.6 Latin America

11.6.1 Trend Analysis

11.6.2 Latin America AI Price Optimization Software Market Estimates and Forecasts by Country (2021-2032) (USD Billion)

11.6.3 Latin America AI Price Optimization Software Market Estimates and Forecasts By Application (2021-2032) (USD Billion) 

11.6.4 Latin America AI Price Optimization Software Market Estimates and Forecasts By Component (2021-2032) (USD Billion)

11.6.5 Latin America AI Price Optimization Software Market Estimates and Forecasts By Deployment Mode (2021-2032) (USD Billion)

11.6.6 Latin America AI Price Optimization Software Market Estimates and Forecasts By Enterprise Size (2021-2032) (USD Billion)

11.6.7 Brazil

11.6.7.1 Brazil AI Price Optimization Software Market Estimates and Forecasts By Application (2021-2032) (USD Billion)

11.6.7.2 Brazil AI Price Optimization Software Market Estimates and Forecasts By Component (2021-2032) (USD Billion)

11.6.7.3 Brazil AI Price Optimization Software Market Estimates and Forecasts By Deployment Mode (2021-2032) (USD Billion)

11.6.7.4 Brazil AI Price Optimization Software Market Estimates and Forecasts By Enterprise Size (2021-2032) (USD Billion)

11.6.8 Argentina

11.6.8.1 Argentina AI Price Optimization Software Market Estimates and Forecasts By Application (2021-2032) (USD Billion)

11.6.8.2 Argentina AI Price Optimization Software Market Estimates and Forecasts By Component (2021-2032) (USD Billion)

11.6.8.3 Argentina AI Price Optimization Software Market Estimates and Forecasts By Deployment Mode (2021-2032) (USD Billion)

11.6.8.4 Argentina AI Price Optimization Software Market Estimates and Forecasts By Enterprise Size (2021-2032) (USD Billion)

11.6.9 Rest of Latin America

11.6.9.1 Rest of Latin America AI Price Optimization Software Market Estimates and Forecasts By Application (2021-2032) (USD Billion)

11.6.9.2 Rest of Latin America AI Price Optimization Software Market Estimates and Forecasts By Component (2021-2032) (USD Billion)

11.6.9.3 Rest of Latin America AI Price Optimization Software Market Estimates and Forecasts By Deployment Mode (2021-2032) (USD Billion)

11.6.9.4 Rest of Latin America AI Price Optimization Software Market Estimates and Forecasts By Enterprise Size (2021-2032) (USD Billion)

12. Company Profiles

12.1 Zilliant

          12.1.1 Company Overview

12.1.2 Financial

12.1.3 Products/ Services Offered

12.1.4 SWOT Analysis

12.2 Revionics

           12.2.1 Company Overview

12.2.2 Financial

12.2.3 Products/ Services Offered

12.2.4 SWOT Analysis

12.3 PROS Holdings, Inc           

          12.3.1 Company Overview

12.3.2 Financial

12.3.3 Products/ Services Offered

12.3.4 SWOT Analysis

12.4 Vendavo

          12.4.1 Company Overview

12.4.2 Financial

12.4.3 Products/ Services Offered

12.4.4 SWOT Analysis

12.5 Pricefx

          12.5.1 Company Overview

12.5.2 Financial

12.5.3 Products/ Services Offered

12.5.4 SWOT Analysis

12.6 BlackCurve

            12.6.1 Company Overview

12.6.2 Financial

12.6.3 Products/ Services Offered

12.6.4 SWOT Analysis

12.7 Competera

          12.7.1 Company Overview

12.7.2 Financial

12.7.3 Products/ Services Offered

12.7.4 SWOT Analysis

12.8 Quicklizard

12.8.1 Company Overview

12.8.2 Financial

12.8.3 Products/ Services Offered

12.8.4 SWOT Analysis

12.9 Perfect Price

12.9.1 Company Overview

12.9.2 Financial

12.9.3 Products/ Services Offered

12.9.4 SWOT Analysis

12.10 Prisync

12.10.1 Company Overview

12.10.2 Financial

12.10.3 Products/ Services Offered

12.10.4 SWOT Analysis

13. Use Cases and Best Practices

14. Conclusion

An accurate research report requires proper strategizing as well as implementation. There are multiple factors involved in the completion of good and accurate research report and selecting the best methodology to compete the research is the toughest part. Since the research reports we provide play a crucial role in any company’s decision-making process, therefore we at SNS Insider always believe that we should choose the best method which gives us results closer to reality. This allows us to reach at a stage wherein we can provide our clients best and accurate investment to output ratio.

Each report that we prepare takes a timeframe of 350-400 business hours for production. Starting from the selection of titles through a couple of in-depth brain storming session to the final QC process before uploading our titles on our website we dedicate around 350 working hours. The titles are selected based on their current market cap and the foreseen CAGR and growth.


The 5 steps process:

Step 1: Secondary Research:

Secondary Research or Desk Research is as the name suggests is a research process wherein, we collect data through the readily available information. In this process we use various paid and unpaid databases which our team has access to and gather data through the same. This includes examining of listed companies’ annual reports, Journals, SEC filling etc. Apart from this our team has access to various associations across the globe across different industries. Lastly, we have exchange relationships with various university as well as individual libraries.

Secondary Research

Step 2: Primary Research

When we talk about primary research, it is a type of study in which the researchers collect relevant data samples directly, rather than relying on previously collected data.  This type of research is focused on gaining content specific facts that can be sued to solve specific problems. Since the collected data is fresh and first hand therefore it makes the study more accurate and genuine.

We at SNS Insider have divided Primary Research into 2 parts.

Part 1 wherein we interview the KOLs of major players as well as the upcoming ones across various geographic regions. This allows us to have their view over the market scenario and acts as an important tool to come closer to the accurate market numbers. As many as 45 paid and unpaid primary interviews are taken from both the demand and supply side of the industry to make sure we land at an accurate judgement and analysis of the market.

This step involves the triangulation of data wherein our team analyses the interview transcripts, online survey responses and observation of on filed participants. The below mentioned chart should give a better understanding of the part 1 of the primary interview.

Primary Research

Part 2: In this part of primary research the data collected via secondary research and the part 1 of the primary research is validated with the interviews from individual consultants and subject matter experts.

Consultants are those set of people who have at least 12 years of experience and expertise within the industry whereas Subject Matter Experts are those with at least 15 years of experience behind their back within the same space. The data with the help of two main processes i.e., FGDs (Focused Group Discussions) and IDs (Individual Discussions). This gives us a 3rd party nonbiased primary view of the market scenario making it a more dependable one while collation of the data pointers.

Step 3: Data Bank Validation

Once all the information is collected via primary and secondary sources, we run that information for data validation. At our intelligence centre our research heads track a lot of information related to the market which includes the quarterly reports, the daily stock prices, and other relevant information. Our data bank server gets updated every fortnight and that is how the information which we collected using our primary and secondary information is revalidated in real time.

Data Bank Validation

Step 4: QA/QC Process

After all the data collection and validation our team does a final level of quality check and quality assurance to get rid of any unwanted or undesired mistakes. This might include but not limited to getting rid of the any typos, duplication of numbers or missing of any important information. The people involved in this process include technical content writers, research heads and graphics people. Once this process is completed the title gets uploader on our platform for our clients to read it.

Step 5: Final QC/QA Process:

This is the last process and comes when the client has ordered the study. In this process a final QA/QC is done before the study is emailed to the client. Since we believe in giving our clients a good experience of our research studies, therefore, to make sure that we do not lack at our end in any way humanly possible we do a final round of quality check and then dispatch the study to the client.

Key Segments: 

By Component

  • Software

  • Services

By Application

  • Retail

  • E-commerce

  • Travel and Hospitality

  • Automotive

  • Others

By Deployment Mode

  • On-Premises

  • Cloud

By Enterprise Size

  • Small and Medium Enterprises

  • Large Enterprises


Request for Segment Customization as per your Business Requirement: Segment Customization Request

Regional Coverage: 

North America

  • US

  • Canada

  • Mexico

Europe

  • Germany

  • France

  • UK

  • Italy

  • Spain

  • Poland

  • Turkey

  • Rest of Europe

Asia Pacific

  • China

  • India

  • Japan

  • South Korea

  • Singapore

  • Australia

  • Rest of Asia Pacific

Middle East & Africa

  • UAE

  • Saudi Arabia

  • Qatar

  • South Africa

  • Rest of Middle East & Africa

Latin America

  • Brazil

  • Argentina

  • Rest of Latin America

Request for Country Level Research Report: Country Level Customization Request

Available Customization 

With the given market data, SNS Insider offers customization as per the company’s specific needs. The following customization options are available for the report: 

  • Detailed Volume Analysis 

  • Criss-Cross segment analysis (e.g. Product X Application) 

  • Competitive Product Benchmarking 

  • Geographic Analysis 

  • Additional countries in any of the regions 

  • Customized Data Representation 

  • Detailed analysis and profiling of additional market players

Explore Key Insights.


  • Analyzes market trends, forecasts, and regional dynamics
  • Covers core offerings, innovations, and industry use cases
  • Profiles major players, value chains, and strategic developments
  • Highlights innovation trends, regulatory impacts, and growth opportunities
Request an Analyst Call