E-tailing Solutions Market Report Scope & Overview:
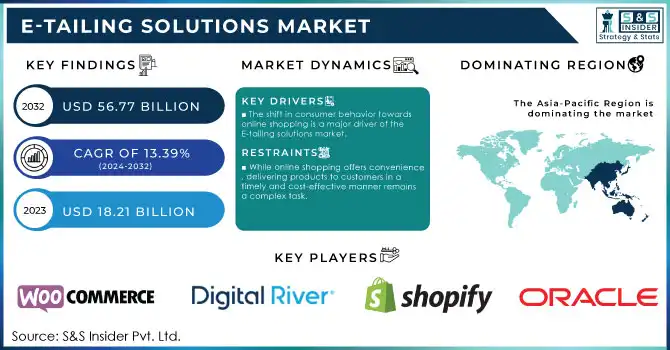
The E-tailing Solutions Market size was valued at USD 18.21 Billion in 2023 and is expected to reach USD 56.77 Billion by 2032 and grow at a CAGR of 13.39% over the forecast period 2024-2032.
The E-tailing solutions market has experienced rapid growth in recent years, driven by the shift in consumer behavior toward online shopping. As e-commerce platforms continue to dominate, the demand for e-tailing tools and solutions that enhance the customer experience is higher than ever, with 20.1% of retail purchases occurring online in 2024, the digital transformation of retail is undeniable. Major players such as Amazon, holding 37.6% of the market share, underscore the competition within the e-tailing space, along with Walmart, Apple, and eBay, who have also captured substantial portions of the market. These e-commerce giants have reshaped business models, driving the adoption of advanced e-tailing solutions that enable seamless shopping experiences across multiple devices and channels. The influence of Amazon, AliExpress, and other platforms with high global traffic highlights the need for scalable, secure e-commerce infrastructure, optimized for high volumes of traffic and robust payment systems. As consumer demand grows, businesses require e-tailing platforms capable of integrating with backend systems for inventory management, shipping, and customer support.
E-tailing Solutions Market Size and Forecast:
-
Market Size in 2023: USD 18.21 Billion
-
Market Size by 2032: USD 56.77 Billion
-
CAGR: 13.39% from 2024 to 2032
-
Base Year: 2023
-
Forecast Period: 2024–2032
-
Historical Data: 2021–2022
To Get More Information on E-tailing Solutions Market - Request Sample Report
Personalization is a key trend in the e-tailing market. By leveraging customer data and machine learning algorithms, businesses can provide personalized shopping experiences, offering tailored product recommendations based on purchase history and user preferences. This not only improves the user experience but also boosts conversion rates. Additionally, advanced Customer Relationship Management (CRM) tools integrated into e-tailing solutions help businesses engage with customers through personalized emails, push notifications, and AI-driven chatbots for real-time support, ensuring higher levels of customer satisfaction and loyalty.
E-tailing Solutions Market Trends
-
Rapid expansion of online retail and increasing internet penetration are significantly driving demand for advanced e-tailing platforms and integrated digital commerce solutions.
-
Growing adoption of omnichannel retail strategies is encouraging retailers to implement unified commerce systems that integrate online, mobile, and in-store operations.
-
Advancements in AI-powered recommendation engines, chatbots, and personalized marketing tools are enhancing customer experience and boosting conversion rates.
-
Rising demand for cloud-based e-commerce platforms is enabling scalability, flexibility, and cost-efficient deployment for small and medium enterprises.
-
Increasing use of data analytics and customer behavior tracking tools is helping businesses optimize inventory management, pricing strategies, and targeted promotions.
-
Expansion of digital payment gateways, buy-now-pay-later (BNPL) services, and secure transaction technologies is strengthening consumer trust in online shopping.
-
Growing cross-border e-commerce activities and last-mile delivery innovations are improving logistics efficiency and expanding global market reach for e-tailers.
E-tailing Solutions Market Drivers
-
The shift in consumer behavior towards online shopping is a major driver of the E-tailing solutions market.
In recent years, consumers have increasingly preferred shopping online due to the convenience, variety, and competitive pricing that digital platforms offer. The growing use of smartphones and mobile applications has made shopping more accessible and easier than ever. People can now shop from anywhere at any time, without being limited by physical store hours or geographic location. Consumers are also increasingly drawn to the personalized shopping experience that online platforms offer. E-tailers like Shopify use advanced algorithms to track browsing habits and offer tailored product recommendations, making shopping more relevant to individual tastes and preferences. The ability to compare prices across different platforms, read customer reviews, and access a broader selection of products further fuels the demand for online shopping. As a result, both B2C and B2B companies are investing heavily in E-tailing solutions to meet the evolving expectations of consumers.
-
The rapid growth of internet penetration and smartphone usage has played a crucial role in the rise of E-tailing solutions.
As the internet becomes more widely accessible across the globe, consumers in both developed and emerging markets are increasingly engaging in online shopping. Internet access is no longer a luxury but a necessity, with people from different demographic groups regularly using the web for shopping, social interaction, and entertainment. The adoption of smartphones has further accelerated this trend. Mobile commerce (M-commerce) is growing rapidly as consumers use their smartphones to browse products, make purchases, and even track deliveries. This shift has forced traditional brick-and-mortar retailers to adapt, offering mobile-friendly websites and applications to attract consumers who prefer shopping on their mobile devices. For example, Amazon's mobile app has revolutionized the shopping experience, allowing users to browse, purchase, and track deliveries seamlessly. Mobile apps also allow retailers to stay connected with customers through push notifications, special offers, and loyalty programs, creating a more personalized and engaging experience.
E-tailing Solutions Market Restraints
-
While online shopping offers convenience, delivering products to customers in a timely and cost-effective manner remains a complex task.
The last-mile delivery process, which involves transporting goods from distribution centers to customers’ doorsteps, is often the most expensive and inefficient part of the supply chain. For e-tailers, managing inventory, ensuring accurate stock levels, and coordinating deliveries across a large geographic area can be daunting. Delays in delivery, especially during peak seasons or in remote locations, can lead to customer dissatisfaction and increased operational costs. Consumers today expect fast, affordable, and reliable shipping, and any failure to meet these expectations can result in negative reviews and lost business. Furthermore, the environmental impact of frequent deliveries, including packaging waste and carbon emissions, has come under scrutiny. E-tailers are under pressure to find sustainable and eco-friendly delivery solutions, which can add complexity and costs to their operations. As e-commerce continues to grow, addressing these logistics challenges will remain a key concern for E-tailing solutions.
E-tailing Solutions Market Segmentation Analysis
By Solution
E-commerce platforms dominated the market with a market share of over 35% in 2023. These platforms offer retailers the framework to establish and oversee their online shops, incorporating payment gateways, product listings, customer administration, and shipping resources. Their scalability and compatibility with additional tools have rendered them a favored option for businesses looking to enhance their digital retail activities. Businesses like Shopify and WooCommerce have assisted both small and large retailers in creating and enhancing their online presence smoothly and effectively.
The E-commerce APIs segment is to expand rapidly during 2024-2032 because of the rising demand for businesses to incorporate different features like payment processing, customer data management, and inventory management. APIs facilitate smooth connections among various software and platforms, simplifying the process for businesses to improve their current systems or develop tailored solutions. Rapidly expanding firms such as Elastic Path and Sitecore lead the way by providing customized APIs that assist businesses in incorporating different third-party solutions into their e-commerce platforms.
By End-User
Fashion & Apparel dominated with a 30% market share in 2023 in the e-tailing solutions market. Top companies such as Zalando and ASOS utilize sophisticated e-commerce solutions to provide tailored shopping experiences, immediate stock information, and quick delivery options. Moreover, fashion companies such as Nike and H&M utilize AI and data analysis to enhance customer interaction and improve supply chain efficiency. The incorporation of social media platforms and virtual fitting features has improved the shopping experience, allowing this sector to lead the e-tailing market.
Food & beverages are anticipated to have the fastest growth rate during 2024-2032. Businesses such as Instacart and Amazon Fresh are spearheading this transformation by offering convenient online shopping platforms for grocery and fresh food deliveries. Applications from Walmart and Tesco provide functionalities such as order tracking, product personalization, and quick delivery, enhancing the accessibility of online grocery shopping. The expansion of subscription-based services, like Blue Apron, which provides meal kits, is further enhancing the industry.
E-tailing Solutions Market Regional Analysis
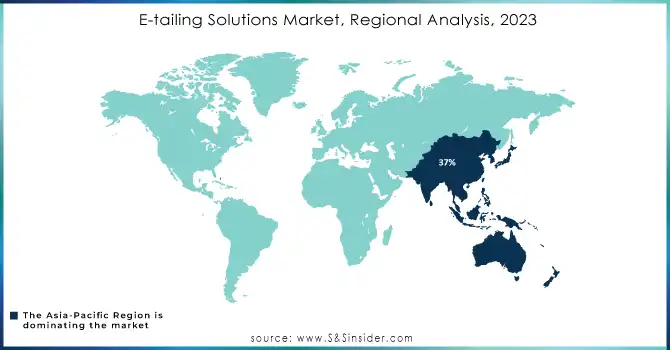
In 2023, Asia-Pacific dominated the e-tailing solutions market, accounting for 37% of the market share, due to swift digital adoption, rising mobile and internet usage, and a strong e-commerce framework. Significant economies such as China, India, and Japan have experienced substantial growth in online retail, due to a growing middle-class demographic and rising disposable income levels. Firms such as Alibaba, JD.com, and Flipkart utilize e-tailing solutions to optimize order processing, manage inventory in real-time, and improve customer experiences.
North America is expected to experience the fastest growth rate in the e-tailing solutions market from 2024 to 2032. Factors driving growth encompass extensive smartphone usage, consumer preferences for the convenience of online shopping, and the technological framework backing sophisticated e-commerce solutions. Major companies such as Amazon, Walmart, and Shopify propel growth by persistently innovating in e-commerce, especially utilizing AR/VR for immersive shopping experiences, AI for predictive analytics, and strong omnichannel integration.
Do You Need any Customization Research on E-tailing Solutions Market - Inquire Now
E-tailing Solutions Market Key Players
The major key players in the e-tailing solutions market are:
-
Shopify Inc. (Shopify Plus, Shopify Payments)
-
Salesforce.com, Inc. (Salesforce Commerce Cloud, Salesforce Order Management)
-
Oracle (Oracle Commerce, Oracle CX Cloud)
-
Digital River, Inc. (Digital River Global Payments, Digital River Monetization)
-
WooCommerce (WooCommerce Payments, WooCommerce Subscriptions)
-
BigCommerce Pty. Ltd. (BigCommerce Enterprise, BigCommerce Multi-Storefront)
-
Adobe (Adobe Commerce, Adobe Experience Manager)
-
eComchain (eComchain Enterprise, eComchain Marketplace)
-
Elastic Path Software Inc. (Elastic Path Commerce Cloud, Elastic Path for B2B)
-
Sitecore (Sitecore Experience Platform, Sitecore Commerce)
-
Magento (Adobe) (Magento Open Source, Magento Commerce)
-
PrestaShop (PrestaShop Cloud, PrestaShop Modules)
-
VTEX (VTEX Commerce, VTEX OMS)
-
SAP Commerce (SAP Commerce Cloud, SAP Marketing Cloud)
-
Kibo Commerce (Kibo Commerce Cloud, Kibo OMS)
-
Lightspeed (Lightspeed Retail, Lightspeed eCommerce)
-
Zyro (Zyro Website Builder, Zyro E-commerce)
-
3dcart (Shift4Shop) (3dcart Online Store, 3dcart Payment Gateway)
-
Volusion (Volusion Online Store, Volusion Analytics)
-
Big Cartel (Big Cartel Starter, Big Cartel Pro)
Software providers to these key players:
-
Amazon Web Services (AWS) – provides cloud infrastructure and hosting.
-
Stripe – provides payment gateway services.
-
PayPal – provides payment solutions for e-commerce transactions.
-
Square – provides point-of-sale and payment solutions.
-
Zendesk – offers customer service software.
-
Microsoft – offers cloud services via Azure, as well as enterprise software like Dynamics 365.
-
Google Cloud – offers cloud computing solutions.
-
HubSpot – provides marketing automation and CRM software.
-
Akeneo – offers Product Information Management (PIM) solutions.
-
ChannelAdvisor – provides e-commerce channel management software.
Recent Developments
-
March 2023: Shopify Inc. launched Shopify Payments to offer better point-of-sale and payment processing tools for e-commerce businesses.
-
June 2023: BigCommerce, a prominent Open SaaS e-commerce platform for both rapidly growing and established B2C and B2B brands, has today revealed that it is enhancing its multi-storefront (MSF) capabilities to increase merchants' ability to connect with and sell to consumers no matter their location, language, or currency.
-
June 2024: Oracle and Shopify are dedicated to improving the customer experience by providing data-driven, integrated commerce solutions. Joint customers can now customize real-time shopping experiences and focused campaigns, alongside utilizing AI-driven recommendations and deals that are likely to engage and enhance conversions.
| Report Attributes | Details |
|---|---|
| Market Size in 2023 | USD 18.21 Billion |
| Market Size by 2032 | USD 56.27 Billion |
| CAGR | CAGR of 13.39% From 2024 to 2032 |
| Base Year | 2023 |
| Forecast Period | 2024-2032 |
| Historical Data | 2020-2022 |
| Report Scope & Coverage | Market Size, Segments Analysis, Competitive Landscape, Regional Analysis, DROC & SWOT Analysis, Forecast Outlook |
| Key Segments | • By Solution (E-commerce Platform, E-commerce APIs, Services) • By End-User (Food & Beverages, Fashion & Apparel, Health & Beauty, Electronics, Automotive, Home & Furniture, Others) |
| Regional Analysis/Coverage | North America (US, Canada, Mexico), Europe (Eastern Europe [Poland, Romania, Hungary, Turkey, Rest of Eastern Europe] Western Europe] Germany, France, UK, Italy, Spain, Netherlands, Switzerland, Austria, Rest of Western Europe]), Asia Pacific (China, India, Japan, South Korea, Vietnam, Singapore, Australia, Rest of Asia Pacific), Middle East & Africa (Middle East [UAE, Egypt, Saudi Arabia, Qatar, Rest of Middle East], Africa [Nigeria, South Africa, Rest of Africa], Latin America (Brazil, Argentina, Colombia, Rest of Latin America) |
| Company Profiles | Shopify Inc., Salesforce.com, Inc., Oracle, Digital River, Inc., WooCommerce, BigCommerce Pty. Ltd., Adobe, eComchain, Elastic Path Software Inc., Sitecore, Magento, PrestaShop, VTEX, SAP Commerce, Kibo Commerce, Lightspeed, Zyro, 3dcart, Volusion, Big Cartel |
| Key Drivers | • The shift in consumer behavior towards online shopping is a major driver of the E-tailing solutions market. • The rapid growth of internet penetration and smartphone usage has played a crucial role in the rise of E-tailing solutions. |
| RESTRAINTS | • While online shopping offers convenience, delivering products to customers in a timely and cost-effective manner remains a complex task. |
Frequently Asked Questions
North America dominated the E-tailing Solutions Market in 2023.
The E-commerce platform segment dominated the E-tailing Solutions Market.
The shift in consumer behavior towards online shopping is a major driver of the E-tailing solutions market.
E-tailing Solutions Market size was USD 18.21 Billion in 2023 and is expected to Reach USD 56.27 Billion by 2032.
The E-tailing Solutions Market is expected to grow at a CAGR of 13.39% during 2024-2032.
Get in Touch
