Alternative Legal Service Providers Market Report Scope & Overview:
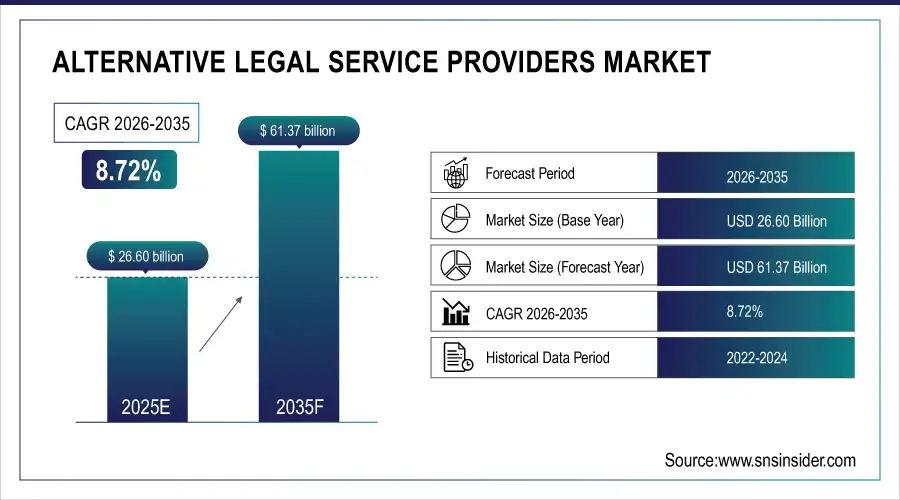
Alternative Legal Service Providers Market was valued at USD 26.60 billion in 2025 and is expected to reach USD 61.37 billion by 2035, growing at a CAGR of 8.72% from 2026-2035.
The growth of the Alternative Legal Service Providers (ALSP) market is driven by rising demand for cost-efficient legal solutions, increasing adoption of legal process outsourcing, and the expanding use of advanced legal technologies such as AI, machine learning, and automation. Corporations and law firms are increasingly turning to ALSPs for specialized services including document review, e-discovery, contract management, and regulatory compliance to reduce operational costs and enhance efficiency.
In June 2025, Axiom incorporated Legora, a collaborative AI platform, into its Tech+Talent portfolio, enabling in-house legal teams to analyze large volumes of documents up to 75% faster and at approximately 50% lower cost, delivering results in days rather than weeks.
Alternative Legal Service Providers Market Size and Forecast
-
Market Size in 2025: USD 26.60 Billion
-
Market Size by 2035: USD 61.37 Billion
-
CAGR: 8.72% from 2026 to 2035
-
Base Year: 2025
-
Forecast Period: 2026–2035
-
Historical Data: 2022–2024
To Get more information On Alternative Legal Service Providers Market - Request Free Sample Report
Alternative Legal Service Providers Market Trends
-
Rising demand for cost-effective and flexible legal solutions is driving the alternative legal service providers (ALSP) market.
-
Growing adoption of technology-enabled services such as contract management, e-discovery, and legal research is boosting market growth.
-
Expansion across corporate legal departments, law firms, and regulatory compliance sectors is fueling deployment.
-
Increasing focus on operational efficiency, faster turnaround, and access to specialized expertise is shaping adoption trends.
-
Advancements in AI, automation, and analytics are enhancing service accuracy and productivity.
-
Rising pressure to reduce legal costs and improve scalability is supporting market expansion.
-
Collaborations between ALSPs, law firms, and corporate clients are accelerating innovation and global adoption.
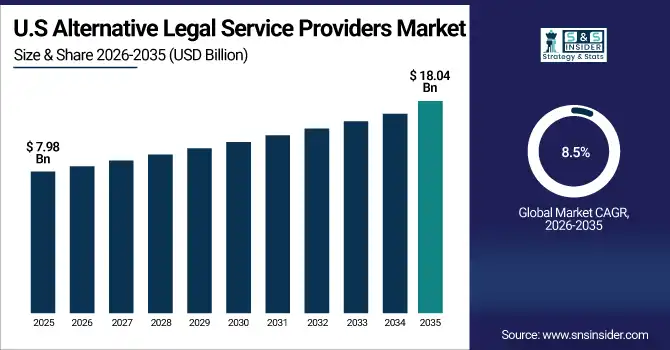
U.S. Alternative Legal Service Providers Market was valued at USD 7.98 billion in 2025 and is expected to reach USD 18.04 billion by 2035, growing at a CAGR of 8.5% from 2026-2035.
The ALSP market is growing due to rising demand for cost-effective legal services, increased outsourcing by law firms and corporates, adoption of legal tech solutions, and the need for scalable, specialized support in areas like compliance, litigation, and contract management.
Alternative Legal Service Providers Market Growth Drivers:
-
Increased adoption of legal technology platforms is enhancing delivery capabilities and expanding the scope of Alternative Legal Service Providers.
The integration of AI, machine learning, contract analytics, and cloud-based legal platforms has transformed how ALSPs deliver services. These technologies allow for faster, more accurate, and scalable legal work, from document automation to eDiscovery processes. This digitization significantly improves turnaround time, accuracy, and cost-effectiveness. ALSPs can now support high-volume legal processes with minimal manual intervention, increasing appeal to clients looking for efficiency and agility. As legal departments become more tech-savvy, the reliance on ALSPs for technology-enabled solutions will continue to grow in both litigation and transactional service domains.
-
A study published in July 2025 revealed that, despite a 33% average increase in AI budgets across legal departments, only 20% of teams report “AI maturity”. Yet nearly all are racing to adopt AI, often without basic safeguards a competency gap that opens the door for ALSPs offering technology-linked, risk-managed solutions.
Alternative Legal Service Providers Market Restraints
-
Regulatory uncertainties and compliance complexities restrict full-scale adoption of Alternative Legal Service Providers in highly regulated jurisdictions.
In many countries, laws governing the unauthorized practice of law restrict the range of services that ALSPs can legally provide. Regulatory barriers prevent ALSPs from engaging in core legal advisory roles, especially in jurisdictions where only licensed attorneys may practice law. This fragmentation in legal frameworks creates compliance risks for both ALSPs and their clients. The inconsistency across global regulatory environments hinders seamless service delivery and scalability, particularly in cross-border matters. These legal constraints slow down the full potential expansion of ALSPs despite market readiness and client interest in outsourcing broader legal functions.
Alternative Legal Service Providers Market Opportunities
-
Increasing legal demand from startups and SMEs fuels the adoption of affordable and scalable Alternative Legal Service Provider solutions.
Startups and small businesses face growing legal needs but often lack the budget for premium legal firms. ALSPs fill this gap by offering modular, tech-enabled legal services that are affordable and adaptable to growth. Services such as contract automation, IP registration, compliance documentation, and online dispute resolution are particularly attractive to this segment. The global expansion of digital startups has made legal agility essential, and ALSPs provide the speed and flexibility required. With tailored pricing models and on-demand expertise, ALSPs can scale alongside these businesses, driving long-term market opportunity in the SME sector.
Alternative Legal Service Providers Market Challenges
-
Lack of standardization in service quality and delivery across Alternative Legal Service Providers creates reliability concerns for enterprise clients.
The fragmented and evolving nature of the ALSP market results in wide disparities in service standards, methodologies, and quality controls. Unlike traditional law firms with structured governance and uniform processes, many ALSPs vary significantly in training, tools, and compliance protocols. This inconsistency poses a risk to enterprise clients that need predictable outcomes, especially in high-volume or regulated work. Without industry-wide benchmarks or accreditation systems, clients struggle to evaluate and trust new ALSP entrants. These inconsistencies limit repeat business and restrict ALSPs from scaling into enterprise-level mandates across industries and geographies.
Alternative Legal Service Providers Market Segment Analysis
By End-User
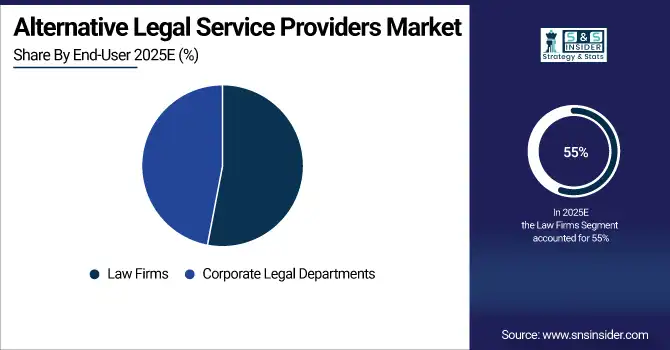
Law firms held the largest revenue share of about 55% in 2025 due to their strong integration of ALSPs for support functions like eDiscovery, document review, and legal research. Many firms use ALSPs to increase efficiency while retaining control over client relationships. Their established infrastructure, brand trust, and client access allow seamless ALSP collaboration, making them the leading contributors to market revenues.
Corporate legal departments are projected to grow at the fastest CAGR of 9.57% from 2026 to 2035 as companies increasingly seek cost-effective, scalable legal solutions. ALSPs provide in-house teams with flexible legal support, allowing them to manage rising workloads without expanding internal staff. Growing pressure to reduce legal spend and improve operational efficiency is accelerating ALSP adoption among corporate clients across industries.
By Services
Litigation accounted for the largest revenue share of around 30% in 2025 due to the high volume of legal documentation, discovery, and case analysis work involved. ALSPs offer significant value in litigation support by streamlining data-intensive tasks using advanced technology and large-scale resources. Law firms and corporate legal teams increasingly outsource these tasks to reduce time, costs, and risks associated with legal proceedings.
Taxation is expected to grow at the fastest CAGR of 11.05% from 2026 to 2035 as companies seek specialized support for evolving global tax regulations and compliance requirements. ALSPs provide scalable, cost-effective tax advisory and documentation services, particularly in cross-border transactions and digital economy issues. The growing complexity of tax laws makes outsourced legal tax support a high-growth area within the ALSP market.
By Billing Type
Hourly billing held the largest revenue share of approximately 59% in 2025 as it remains the most familiar and widely accepted pricing model in legal services. It offers flexibility in billing for complex or unpredictable projects, making it preferable for both law firms and ALSPs. Clients and providers often default to this model for litigation and ongoing legal advisory services that lack defined scopes.
Flat fee billing is anticipated to grow at the fastest CAGR of 10.38% from 2026 to 2035 as clients increasingly demand transparency and cost predictability. ALSPs offering fixed-price services for routine legal tasks—such as contract drafting, compliance reporting, or regulatory filings appeal to cost-sensitive clients. The shift toward value-based pricing aligns with broader trends in procurement and legal service innovation, driving segment growth.
By Provider Type
Independent ALSPs dominated the market with the highest revenue share of 79% in 2025 due to their broad service offerings, flexibility, and global delivery capabilities. These providers operate outside traditional law firms or corporate departments, enabling them to specialize in scalable services like legal process outsourcing, contract management, and litigation support. Their agility and innovation have positioned them as market leaders across multiple legal domains.
Captive LPOs are expected to grow at the fastest CAGR of 12.78% from 2026 to 2035, driven by large corporations building in-house legal outsourcing units to control quality and reduce dependency on external vendors. These captive units allow businesses to centralize repetitive legal tasks while maintaining confidentiality and compliance. As companies scale globally, the demand for internalized, cost-efficient legal support systems is accelerating.
Alternative Legal Service Providers Market Regional Outlook
North America Alternative Legal Service Providers Market Insights
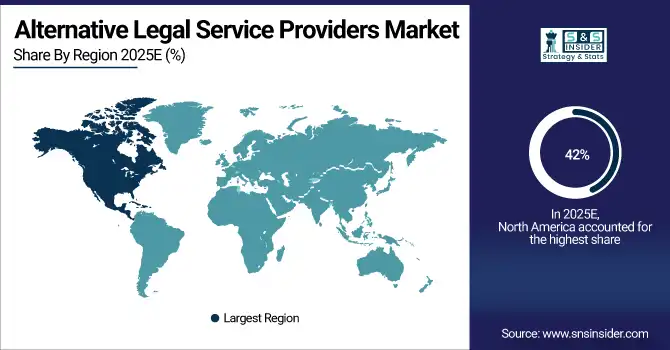
North America held the highest revenue share of approximately 42% in 2025 due to the early adoption of legal technology, a mature legal industry, and widespread use of ALSPs by large law firms and corporate legal departments. The region's advanced regulatory frameworks, demand for cost efficiency, and high litigation volume have driven consistent integration of ALSPs across various legal functions, solidifying its market leadership.
Get Customized Report as per Your Business Requirement - Enquiry Now
The United States is dominating the Alternative Legal Service Providers market due to its large legal industry, early technology adoption, and high corporate legal demand.
Asia Pacific Alternative Legal Service Providers Market Insights
Asia Pacific is projected to grow at the fastest CAGR of 11.10% from 2026 to 2035, fueled by rapid economic development, rising cross-border business activity, and digital transformation of legal services. Expanding corporate sectors in India, China, and Southeast Asia are increasingly adopting ALSPs to manage growing legal workloads cost-effectively. The availability of skilled legal process outsourcing talent also boosts regional growth potential significantly.
India is dominating the Alternative Legal Service Providers market in Asia Pacific due to its large pool of skilled legal professionals and cost-effective outsourcing capabilities.
Europe Alternative Legal Service Providers Market Insights
Europe is witnessing steady growth in the Alternative Legal Service Providers market due to increasing demand for cost-efficient legal solutions, adoption of legal technologies, and regulatory pressure driving law firms and corporate departments to outsource standardized and repetitive legal tasks.
The United Kingdom is dominating the Alternative Legal Service Providers market in Europe, driven by its mature legal sector and strong demand for outsourced legal solutions.
Europe Alternative Legal Service Providers Market Insights
Middle East & Africa and Latin America are experiencing gradual adoption of Alternative Legal Service Providers, driven by growing legal process outsourcing, regulatory reforms, and increasing corporate demand for affordable legal solutions, despite challenges related to market maturity and infrastructure development.
Alternative Legal Service Providers Market Competitive Landscape:
Axiom Law
Axiom Law is a leading Alternative Legal Service Provider (ALSP) offering flexible, on-demand legal expertise to in-house legal teams globally. It delivers large-scale projects, contract management, and legal talent solutions that reduce costs and increase efficiency compared to traditional law firms. Axiom combines technology, law firm-quality supervision, and a digital talent marketplace to streamline legal operations and scale services across corporate clients.
-
2024: Axiom completed over 250 large legal projects, expanding law firm-style supervision to help in-house teams scale efficiently.
-
2024: The firm engaged in nearly 2,000 client projects, leveraging its ALSP offerings for talent, recruitment, and large legal initiatives.
-
2025: Axiom launched Axiom Self‑Service, a digital legal talent marketplace allowing direct hiring without intermediaries.
Lawyers On Demand (LOD) / Consilio
Lawyers On Demand (LOD), now integrated under Consilio, is a global provider of flexible legal talent and managed legal services. The firm offers on-demand lawyers, document review, compliance support, and legal project management solutions to corporate clients seeking scalable, efficient alternatives to traditional law firms. LOD leverages technology, strategic resourcing, and global staffing to meet dynamic corporate legal needs.
-
2024: Consilio rebranded and integrated LOD’s flex talent solutions, expanding global legal staffing and flexible services delivery.
Elevate Services, Inc.
Elevate Services, Inc. is a global ALSP providing legal technology, managed services, and consulting solutions. The company combines AI-driven workflows, document review, compliance services, and strategic legal operations support to enhance corporate legal efficiency. Elevate focuses on European and North American markets, offering scalable solutions for law departments while expanding capabilities through strategic acquisitions and technology integration.
-
2025: Elevate acquired Dutch ALSP Legadex, its fourth acquisition since May 2024, enhancing legal tech and managed services across Europe.
Key Players
Some of the Alternative Legal Service Providers Market Companies
-
Elevate Services, Inc.
-
Integreon Managed Solutions Limited
-
Lawyers On Demand (LOD)
-
QuisLex, Inc.
-
Morae Global Corporation
-
Obelisk Support Solutions Limited
-
KPMG
-
Ernst & Young Global Limited
-
UnitedLex Corporation
-
Allen & Overy (Peerpoint)
-
Consilio
-
Epiq Systems, Inc.
-
LegalZoom
-
Mindcrest
-
Konexo (Eversheds Sutherland)
-
NOVA8
-
Pangea3 (EY-backed)
-
TLB (The Law Boutique)
| Report Attributes | Details |
|---|---|
| Market Size in 2025 | USD 26.60 Billion |
| Market Size by 2035 | USD 61.37 Billion |
| CAGR | CAGR of 8.72% From 2026 to 2035 |
| Base Year | 2025 |
| Forecast Period | 2026-2035 |
| Historical Data | 2022-2024 |
| Report Scope & Coverage | Market Size, Segments Analysis, Competitive Landscape, Regional Analysis, DROC & SWOT Analysis, Forecast Outlook |
| Key Segments | • By Services (Taxation, Real Estate, Litigation, Bankruptcy, Labor/Employment, Corporate) • By Billing Type (Hourly Billing, Flat Fee Billing, Contingency Fee Billing, Subscription Billing) • By Provider Type (Big Four, Independent ALSPs, Captive LPOs, Staffing Agencies) • By End-User (Law Firms, Corporate Legal Departments) |
| Regional Analysis/Coverage | North America (US, Canada), Europe (Germany, UK, France, Italy, Spain, Russia, Poland, Rest of Europe), Asia Pacific (China, India, Japan, South Korea, Australia, ASEAN Countries, Rest of Asia Pacific), Middle East & Africa (UAE, Saudi Arabia, Qatar, South Africa, Rest of Middle East & Africa), Latin America (Brazil, Argentina, Mexico, Colombia, Rest of Latin America). |
| Company Profiles | Axiom Law, Elevate Services, Inc., Integreon Managed Solutions Limited, Lawyers On Demand (LOD), QuisLex, Inc., Morae Global Corporation, Obelisk Support Solutions Limited, KPMG, Ernst & Young Global Limited, UnitedLex Corporation, Allen & Overy (Peerpoint), Consilio, Epiq Systems, Inc., LegalZoom, Mindcrest, Konexo (Eversheds Sutherland), KorumLegal, NOVA8, Pangea3 (EY-backed), TLB (The Law Boutique) |
Frequently Asked Questions
Ans: North America led the market in 2025 with 42% share, driven by early legal tech adoption and high demand from legal departments and firms.
Ans: Law firms dominated the market in 2025 with a 55% revenue share due to strong ALSP integration for support services and client retention.
Ans: The market is primarily driven by increasing demand for affordable legal solutions, legal tech adoption, and growth in legal process outsourcing.
Ans: Alternative Legal Service Providers Market was valued at USD 26.60 billion in 2025 and is expected to reach USD 61.37 billion by 2035, growing at a CAGR of 8.72% from 2026-2035.
Ans: The Alternative Legal Service Providers Market is expected to grow at a CAGR of 8.72% from 2026 to 2035 due to rising global demand.
Get in Touch
