Computer Vision Image Software Market Report Scope & Overview:
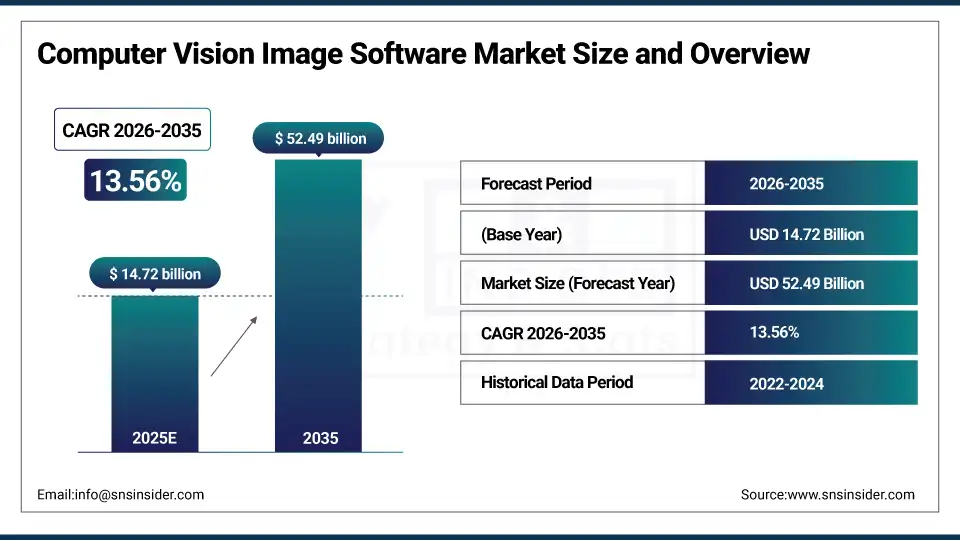
The Computer Vision Image Software Market size was valued at USD 14.72 billion in 2025 and is expected to reach USD 52.49 billion by 2035, expanding at a CAGR of 13.56% over the forecast period of 2026-2035.
The global computer vision image software market trend is a growing demand for AI-powered visual intelligence solutions such as image recognition platforms, deep learning-based object detection systems, and real-time video analytics software as the growth of the market is driven by increasing adoption of machine learning algorithms, rising deployment of GPU-accelerated computing infrastructure, and enterprise demand for automated visual inspection and quality control capabilities. This trend is also driven by a growing adoption of cloud-native deployment models and the growing focus on intelligent automation across industry verticals as technology providers become more focused on delivering scalable, pre-trained computer vision APIs and are more willing to invest in edge computing and neural network optimization technologies, resulting in growth in the domestic and international market for on-premises and cloud-based computer vision image software solutions.
For instance, in February 2025, the increasing demand for AI-powered inspection capabilities from enterprises have caused 31% increase in the computer vision image software deployments across the U.S. manufacturing facilities, further augmenting the automated defect detection adoption and also decreasing production line downtime.
Computer Vision Image Software Market Size and Forecast:
-
Market Size in 2025: USD 14.72 billion
-
Market Size by 2035: USD 52.49 billion
-
CAGR: 13.56% from 2026 to 2035
-
Base Year: 2025
-
Forecast Period: 2026–2035
-
Historical Data: 2022–2024
To Get more information On Computer Vision Image Software Market - Request Free Sample Report
Computer Vision Image Software Market Trends
-
Computer vision image software solutions are being adopted because enterprises demand automated visual inspection, real-time object detection, and AI-driven image classification across manufacturing, healthcare, and retail operations.
-
Customized deep learning models based on industry-specific image datasets, application requirements, and deployment environments to improve visual recognition accuracy and operational efficiency.
-
The development of edge-based computer vision inference engines, no-code vision platforms, and pre-trained foundation models to reduce deployment complexity and accelerate time-to-production for enterprise visual intelligence applications.
-
Multimodal AI integration, generative synthetic data pipelines, and automated model retraining workflows are all available to ensure continuous improvement of computer vision accuracy and adaptation to evolving real-world visual conditions.
-
Increased demand for cloud-based vision APIs, mobile-optimized image processing frameworks and self-service model training platforms to enhance deployment flexibility, scalability, and data security across distributed enterprise environments.
-
Collaboration between computer vision software vendors, cloud hyperscalers, and hardware manufacturers to develop integrated visual intelligence platforms and improve standards of interoperability across heterogeneous enterprise IT ecosystems.
-
NIST, FDA, and FTC promoting standards for algorithmic transparency, GDPR and CCPA compliance, biometric data governance requirements, and responsible AI deployment guidelines for computer vision systems.
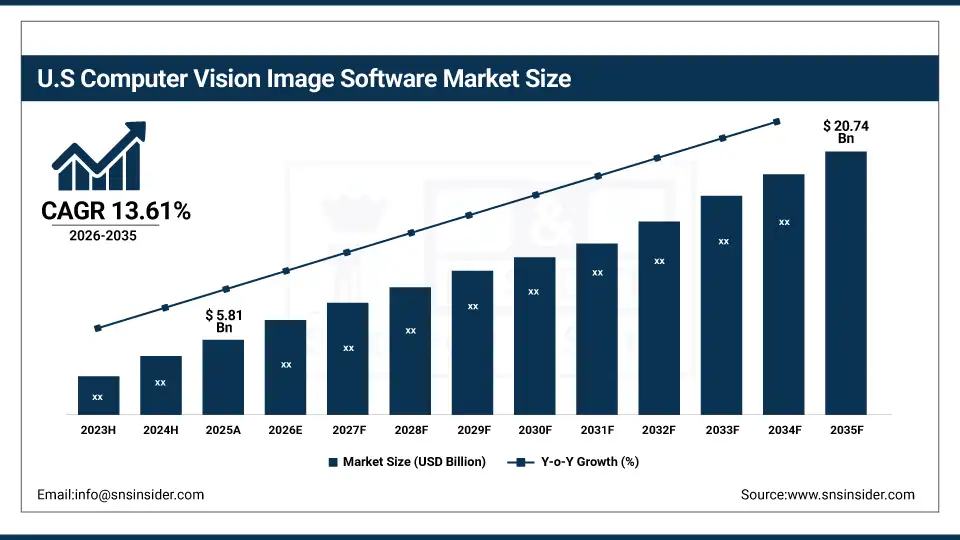
The U.S. Computer Vision Image Software Market is estimated at USD 5.81 billion in 2025 and is expected to reach USD 20.74 billion by 2035, growing at a CAGR of 13.61% from 2026-2035. Among regions, United States serves as the largest computer vision image software market share holder owing to presence of prominent overall AI research institutions, high enterprise adoption for machine learning fueled automation, and developed cloud computing infrastructure in the healthcare, automotive, defense, and manufacturing industries. Government investments in national AI competitiveness strategies, high levels of enterprise technology spending, and increased venture capital funding for computer vision startups help to drive growth in the market. Also, the U.S. is the largest regional market in the world, due to the robust ecosystem of established software vendors and the rapid adoption of cloud-based and edge-based computer vision image software solutions.
Computer Vision Image Software Market Growth Drivers:
-
Rising Adoption of AI and Deep Learning Technologies is Driving the Computer Vision Image Software Market Growth
Rising adoption of AI and deep learning technologies takes the center stage as a growth driver for the computer vision image software market share, and is driven by the rapid advancement of convolutional neural network architectures, transformer-based vision foundation models, and GPU-accelerated model training pipelines for enhanced image classification, object detection, and semantic segmentation accuracy. These solutions for industrial visual inspection and enterprise automation are driving the base of the market, the penetration of on-premises & cloud-based markets, and adding to the overall market share globally.
For instance, in August 2024, AI-integrated computer vision image software solutions accounted for ~71% of the total U.S. enterprise visual inspection technology investments, reflecting growing institutional preference and expanding market share.
Computer Vision Image Software Market Restraints:
-
High Implementation Costs and Data Privacy Concerns are Hampering the Computer Vision Image Software Market Growth
High implementation costs and data privacy concerns also restrict the computer vision image software market growth, as a large number of enterprises that have access to computer vision platforms remain limited in deployment scale or face difficulties meeting the capital expenditure requirements for GPU infrastructure, high-resolution imaging hardware, and specialized AI engineering talent. This might lead to underutilization, limited scalability, and reduced return on investment for organizations across cost-sensitive sectors. As a result, adoption rates suffer, and market growth is stunted in regions where regulatory scrutiny on biometric data collection is prevalent and enterprise AI readiness is limited.
Computer Vision Image Software Market Opportunities:
-
Healthcare Diagnostics and Autonomous Vehicle Applications Drive Future Growth Opportunities for the Computer Vision Image Software Market
The opportunity in the healthcare diagnostics and autonomous vehicle applications in the computer vision image software market is in the form of AI-assisted radiology platforms, digital pathology image analysis tools, and camera perception systems for self-driving vehicles. These solutions provide for early disease detection, individualized diagnostic accuracy improvements, and real-time scene understanding for autonomous navigation. Through enhanced clinical decision support, surgical robotics integration, and operational safety improvements, particularly in areas with precision medicine and autonomous mobility development needs, these technologies may improve patient outcomes, reduce diagnostic errors, and expand the market.
For instance, in November 2024, the U.S. FDA authorized 47 AI-powered medical imaging and computer vision diagnostic software applications, representing a 38% increase over the prior year and highlighting rising regulatory acceptance and increasing demand for clinical computer vision image software solutions.
Computer Vision Image Software Market Segment Analysis
-
By component, software held the largest share of around 67.43% in 2025E, and the services segment is expected to register the highest growth with a CAGR of 14.21%.
-
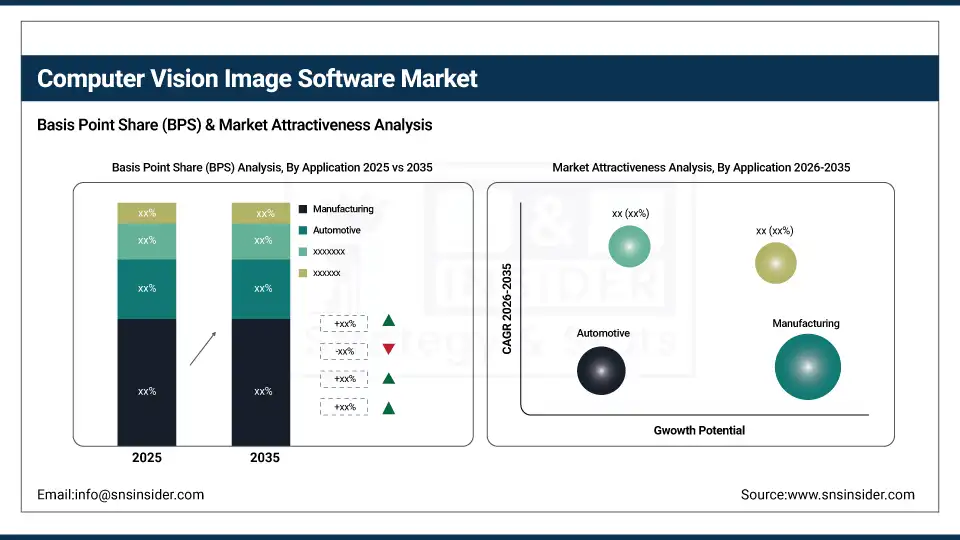
By application, the manufacturing segment dominated the market with approximately 29.18% share in 2025E, while the healthcare segment is expected to register the highest growth with a CAGR of 15.34%.
-
By deployment mode, the cloud segment dominated the market with approximately 61.27% share in 2025E, and the on-premises segment is expected to register steady growth driven by data security and latency-sensitive industrial requirements.
-
By enterprise size, large enterprises accounted for the leading share of nearly 72.54% in 2025E, and the small and medium enterprises segment is expected to register the highest growth driven by affordable SaaS-based computer vision platforms.
-
By end-user, the manufacturing segment accounted for the leading share of nearly 27.36% in 2025E, and is expected to register the highest growth with a CAGR of 14.87%.
By Component, Software Leads the Market, While Services Registers Fastest Growth
The software segment accounted for the highest revenue share of approximately 67.43% in 2025, owing to the rapid proliferation of pre-trained deep learning models, cloud-native computer vision APIs, and AutoML-based image recognition platforms that enable scalable deployment across diverse enterprise use cases with minimal customization overhead. Emerging trends, including increasing requirements for turnkey visual intelligence software suites and regulatory emphasis on auditable AI model governance. In comparison, the services segment is anticipated to achieve the highest CAGR of nearly 14.21% during the 2026–2035 period, driven by the rising enterprise demand for professional implementation services, model fine-tuning, and system integration support. Drivers include growing adoption among organizations deploying industry-specific computer vision workflows, the preference for managed computer vision-as-a-service offerings.
By Application, the Manufacturing Segment dominates, while the Healthcare Segment Shows Rapid Growth
By 2025, the manufacturing application segment contributed the largest revenue share of 29.18% due to its widespread adoption of AI-powered automated visual inspection systems, robotic guidance software, and defect detection platforms across automotive, electronics, and consumer goods production environments. Growing reliance on Industry 4.0 automation frameworks coupled with increasing quality assurance mandates, manufacturers are increasingly deploying computer vision image software to minimize defect rates and maximize operational throughput. The healthcare segment is projected to grow at the highest CAGR of about 15.34% between 2026 and 2035 due to the growing deployment of FDA-authorized AI diagnostic imaging platforms, digital pathology solutions, and surgical robotics computer vision integration. Some of the reasons include increasing hospital investments in intelligent clinical workflow automation, expanding coverage of AI-powered medical imaging reimbursement, and healthcare organizations' preference for validated clinical-grade image recognition software.
By Deployment Mode, Cloud Leads, and On-Premises Registers Steady Growth
The cloud segment accounted for the largest share of the computer vision image software market with about 61.27%, owing to its superior scalability, elastic compute resource provisioning, and availability of pre-integrated vision APIs from major cloud hyperscalers including AWS Rekognition, Google Cloud Vision, and Azure Computer Vision. Reasons driving the cloud segment include increasing enterprise migration of visual intelligence workloads to reduce infrastructure costs and accelerate deployment timelines. In addition, the on-premises segment maintains steady growth throughout the forecast period of 2026–2035, as industrial manufacturers, defense agencies, and financial institutions require low-latency real-time image processing, data sovereignty compliance, and air-gapped deployment configurations that cannot be supported by external cloud environments. Stringent regulatory mandates for sensitive visual data governance and the need for deterministic inference performance continue to drive continued investment.
By Enterprise Size, Large Enterprises Lead, and SMEs Register Fastest Growth
The large enterprises segment accounted for the largest share of the computer vision image software market with about 72.54%, owing to their greater capital capacity to invest in custom computer vision development, dedicated AI infrastructure, and enterprise-grade integration with existing ERP, MES, and supply chain management systems. Reasons driving the large enterprise segment include complex multi-site deployment requirements and advanced performance benchmarking obligations. In addition, the small and medium enterprises segment is slated to grow at the fastest rate throughout the forecast period of 2026–2035, as growing availability of affordable subscription-based computer vision SaaS platforms, pre-built industry-specific vision models, and low-code deployment tools democratize access to advanced image recognition capabilities. Increased availability of pay-as-you-go vision APIs and growing awareness of computer vision ROI among SME operators drive continued investment.
By End-User, Manufacturing Leads, and Registers Fastest Growth
The manufacturing end-user segment accounted for the largest share of the computer vision image software market with about 27.36%, owing to its direct reliance on automated visual quality control, predictive maintenance monitoring, and robotic guidance systems that require continuous real-time image analysis and machine vision capabilities. Reasons driving the manufacturing segment include accelerating Industry 4.0 adoption and rising smart factory investment priorities. In addition, it is slated to grow at the fastest rate with a CAGR of around 14.87% throughout the forecast period of 2026–2035, as production facilities, logistics operators, and industrial automation integrators seek comprehensive computer vision image software platforms, digital twin compatibility, and AI-powered quality management capabilities. Increased focus on zero-defect manufacturing and end-to-end production traceability contribute to their adoption, while improved throughput rates and reduced scrap costs drive continued investment.
Computer Vision Image Software Market Regional Highlights:
North America Computer Vision Image Software Market Insights:
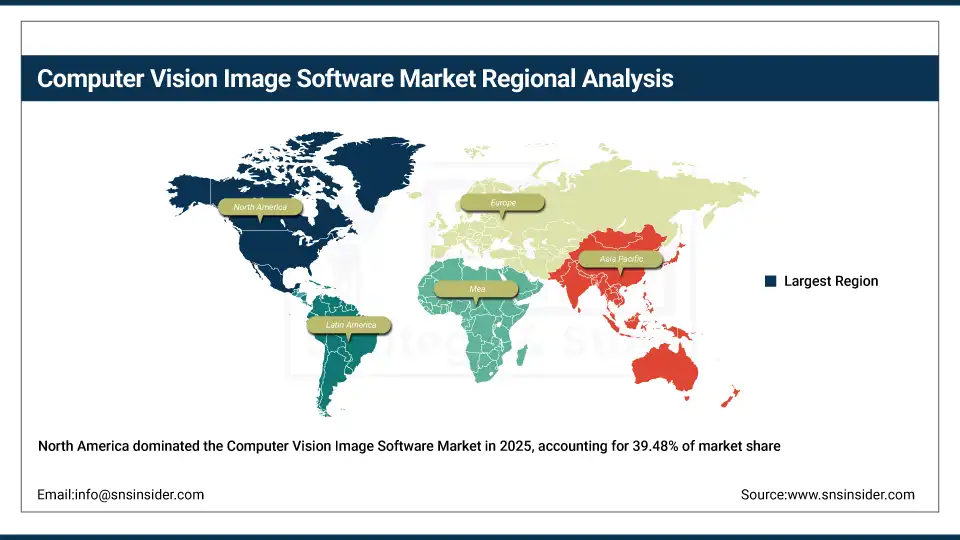
North America held the largest revenue share of over 39.48% in 2025 of the computer vision image software market due to a mature enterprise AI adoption culture, stringent demand for high-performance visual inspection and object recognition solutions, and increased awareness of computer vision ROI across the healthcare, automotive, defense, and retail sectors. Drivers include ubiquitous deployment of cloud computing infrastructure, an established broadband network, growing GPU hardware availability and greater acceptance of AI-powered automation solutions stemming from accelerated digital transformation initiatives. At the same time, various federal AI investment programs, responsible AI deployment guidelines, and enormous investments in computer vision technology from enterprises and government agencies are anchoring computer vision image software platforms and services in the market, and ensuring multibillion dollar revenues around the world.
Get Customized Report as per Your Business Requirement - Enquiry Now
Asia Pacific Computer Vision Image Software Market Insights:
Asia Pacific is the fastest-growing segment in the computer vision image software market with a CAGR of 15.12%, as the awareness about AI-powered visual intelligence solutions, government-backed national AI development programs, and manufacturing automation infrastructure modernization in developing nations is growing. Factors including rapid expansion of electronics production ecosystems, rising middle-class demand for AI-enhanced consumer experiences, and growing uptake of smart factory and intelligent surveillance applications are stimulating the market growth. Cloud-based computer vision APIs and edge inference platforms have been instrumental in improving deployment accessibility, especially in rural and semi-urban manufacturing and logistics settings. Public-private partnerships and government AI investment programs also help in advancing computer vision adoption and digital industrial transformation. Increase in demand in Asia Pacific region owing to rising AI technology spending against historical levels and growing affordability and accessibility of pre-trained vision model platforms across China, Japan, South Korea, and India.
Europe Computer Vision Image Software Market Insights:
The computer vision image software market in Europe is the second-dominating region after North America on account of an increase in the adoption of AI-powered industrial automation, robust data protection regulations including GDPR and the EU AI Act, and increasing enterprise adoption of smart manufacturing and intelligent quality inspection systems across leading industrial economies. Rising implementation of national digital transformation strategies, advanced Industry 4.0 investment frameworks, favorable EU funding for AI innovation projects, and cross-border machine vision technology collaborations are also contributing to the sustained growth of the market in leading European countries.
Latin America (LATAM) and Middle East & Africa (MEA) Computer Vision Image Software Market Insights:
In Latin America, and Middle East & Africa, the growing investments in retail automation, agricultural precision monitoring, and public safety surveillance infrastructure along with increase in mobile and internet connectivity support the computer vision image software market growth. The rising popularity of affordable cloud-based vision APIs and multilingual image recognition platform capabilities, along with government-led smart city development programs, will aid computer vision accessibility and enterprise adoption. The increasing urban population and improving digital infrastructure in these regions are continuing to encourage market growth.
Computer Vision Image Software Market Competitive Landscape:
Microsoft Corporation (est. 1975) is a global technology leader delivering comprehensive AI and cloud computing solutions through its Azure intelligent cloud platform. It uses its Azure Computer Vision cognitive services portfolio and extensive enterprise client relationships to produce cutting-edge image recognition and object detection technology with seamless integration into existing enterprise IT and business intelligence workflows.
-
In January 2025, it expanded its Azure AI Vision portfolio with enhanced Florence-2 foundation model capabilities, introducing improved image segmentation, visual grounding, and dense captioning features designed to accelerate enterprise computer vision application development across healthcare, retail, and manufacturing verticals.
NVIDIA Corporation (est. 1993) is a world-leading visual computing technology company and the dominant provider of GPU hardware and AI software frameworks that power modern computer vision image software systems. It invests in end-to-end visual intelligence platforms including NVIDIA Metropolis, TAO Toolkit, and DeepStream SDK with the aim of enabling enterprises and developers to train, optimize, and deploy AI-powered image recognition applications at scale across cloud and edge environments.
-
In March 2025, launched its next-generation Jetson Thor edge AI computing platform with integrated computer vision acceleration capabilities across smart manufacturing, autonomous systems, and intelligent video analytics applications, enhancing real-time multi-camera perception performance and reducing edge inference latency.
Google LLC (est. 1998) is a global technology and AI research leader that delivers advanced computer vision capabilities through its Google Cloud Vision AI, Vertex AI, and Gemini multimodal foundation model platforms. The company's Vision AI product suite focuses on highly accurate pre-trained and customizable image classification, object localization, and document understanding APIs, and features a strong commitment to responsible AI governance and continuous model innovation to complement its strong market presence across enterprise and developer ecosystems globally.
-
In February 2025, introduced Gemini-powered multimodal computer vision enhancements to its Vertex AI platform, strengthening enterprise visual reasoning, image-to-text grounding, and contextual scene analysis capabilities and expanding adoption among large-scale enterprise and research institution customers.
Computer Vision Image Software Market Key Players:
-
Microsoft Corporation
-
NVIDIA Corporation
-
Google LLC
-
Intel Corporation
-
IBM Corporation
-
Cognex Corporation
-
Basler AG
-
Keyence Corporation
-
Zebra Technologies Corporation
-
Qualcomm Technologies, Inc.
-
Landing AI (LandingLens)
-
Viso Suite (Viso.ai)
-
Neurala, Inc.
-
Sighthound, Inc.
-
Encord (formerly Cord Technologies)
-
Roboflow, Inc.
-
Scale AI, Inc.
-
Dataloop Ltd.
| Report Attributes | Details |
|---|---|
| Market Size in 2025 | USD 14.72 Billion |
| Market Size by 2035 | USD 52.49 Billion |
| CAGR | CAGR of 13.56% From 2026 to 2035 |
| Base Year | 2025 |
| Forecast Period | 2026-2035 |
| Historical Data | 2022-2024 |
| Report Scope & Coverage | Market Size, Segments Analysis, Competitive Landscape, Regional Analysis, DROC & SWOT Analysis, Forecast Outlook |
| Key Segments | •By Type (Hardware RNG, Software RNG) •By Application (Gaming, Lottery, Cryptography, Simulation, Others) •By End-User (Casinos, Online Gaming Platforms, Financial Institutions, Research Institutions, Others) |
| Regional Analysis/Coverage | North America (US, Canada, Mexico), Europe (Germany, France, UK, Italy, Spain, Poland, Turkey, Rest of Europe), Asia Pacific (China, India, Japan, South Korea, Singapore, Australia, Rest of Asia Pacific), Middle East & Africa (UAE, Saudi Arabia, Qatar, South Africa, Rest of Middle East & Africa), Latin America (Brazil, Argentina, Rest of Latin America) |
| Company Profiles | Microchip Technology Inc., Texas Instruments Incorporated, NXP Semiconductors, STMicroelectronics, Analog Devices, Inc., Infineon Technologies AG, Renesas Electronics Corporation, ON Semiconductor, Qualcomm Technologies, Inc., Intel Corporation |
Frequently Asked Questions
North America dominated the Computer Vision Image Software Market in 2025, accounting for 39.48% of the global revenue.
The Software segment dominated the market due to its central role in enabling image recognition, deep learning integration, and analytics, with continuous platform enhancements by companies like OpenCV.ai, Cognex, and Google Cloud Vision.
A major growth driver is the increasing integration of AI and edge computing, which enables real-time processing for applications such as autonomous vehicles, industrial inspection, and smart surveillance, enhancing responsiveness and efficiency.
The market size of the Computer Vision Image Software Market was USD 14.72 billion in 2025.
The expected CAGR of the Computer Vision Image Software Market from 2026 to 2035 is 13.56%.
Get in Touch
