Anti-reflective Coatings Market Report Scope & Overview:
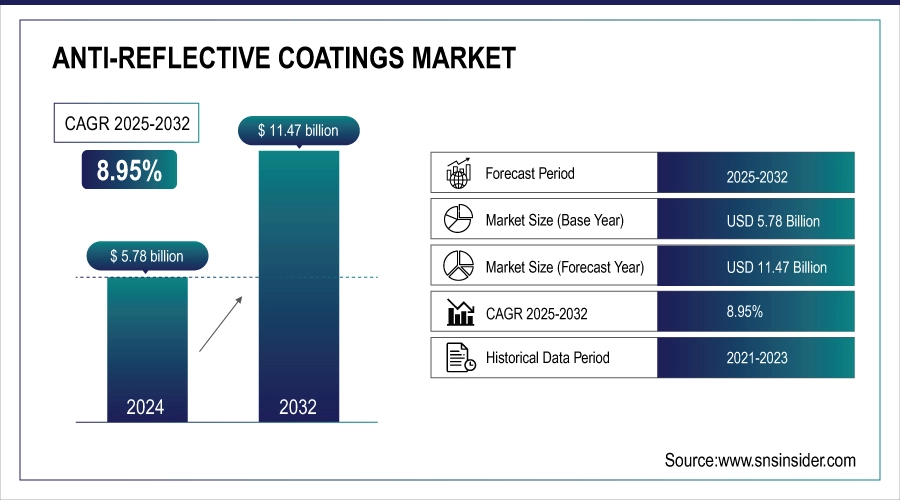
The Anti-reflective Coatings market size was valued at USD 5.78 billion in 2024 and is expected to reach USD 11.47 billion by 2032, growing at a CAGR of 8.95% over the forecast period of 2025-2032.
Rising demand for HD displays, sophisticated eyewear and solar technologies is propelling the anti-reflective coatings market. The AR-coating market led by companies such as ZEISS and Essilor Luxottica will widen the applications of thin-film coatings for anti-reflective coatings in AR/VR optics, while new solar panel coating announced by DOE may enable an increase photovoltaic (PV) coated efficiency up to 4%. Increasing use of scratch-resistant coatings and transparent coatings in lenses along with optical coating used in automotive HUDs, display coating for foldable smartphones is contributing toward substantial growth to anti-reflective coatings market.
To Get more information On Anti-reflective Coatings Market - Request Free Sample Report
Anti-reflective coatings market size is driven by architectural applications destining anti-reflection glass, and energy saving glass coating as mentioned in DOE Building Technologies Office. Share is gained for non-reflective coatings and anti-reflective coatings market trend are eco-friendly manufacturing. As per the study, regional R&D stimulates new transparent coatings and durable AR layers to make it a fiercely competitive field going forward.
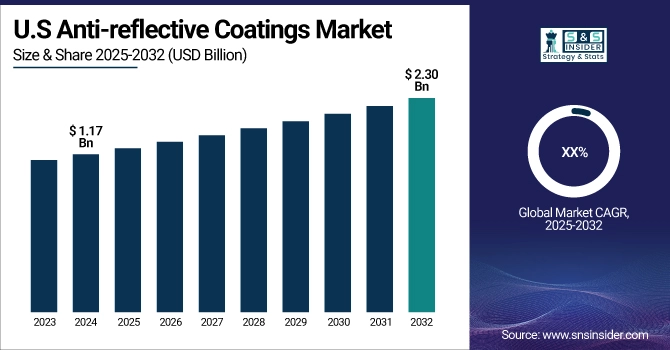
The U.S. leads, holding a market share of about 83% with a market size of USD 1.17 billion in 2024 and is projected to reach a value of USD 2.30 billion by 2032, drawing major investments by EssilorLuxottica and Corning in durable scratch-resistant coatings for lenses and smartphones. Canada follows with increased demand for anti-reflective glass in commercial buildings. Consistent upgrades in optical coatings for automotive displays sustain North America’s stable position in the anti-reflective coatings market.
Market Dynamics:
Drivers:
-
Emerging Demand for Thin-Film Coatings in Medical Optics Fuels Anti-Reflective Coatings Market Growth
Growth of the anti-reflective coatings market is driven by increasing use in endoscopes and surgical lenses. Olympus introduced enhanced clarity in medical optics with advanced AR layers that minimize glare as seen under bright surgical lights. Furthermore, specialty makers claim tough coatings that do not scratch easily leading to longer lasting lenses. These advances meet hospitals' need for better imaging and the premium product-line requirements, which underscore how higher-performance AR coatings are responding to this high-value medical market.
-
Transparent Coatings Innovations Expand Display Coatings in Next-Generation Automotive Dashboards
Demand for sophisticated display and transparent coating is generated by the infotainment screens with clear AR layers. Hyundai mentions the inclusion of purpose-optimized AR layers to enhance sunlight visibility in curved dashboards, responding consumer desire for better visuals. These automotive innovations are illustrative of a special application for anti-glare coatings beyond the smartphone. With more displays becoming integral to car design, the anti-reflective coatings companies address opportunities for them to contribute towards OEMs demanding premium optical performance driving accelerated innovation in this area.
Restraints:
-
Complex Production of Optical Coatings Limits Wider Non-Reflective Coatings Availability
It is technically difficult to manufacture optical coatings for free form shapes of curved lenses, which severely restricts the stock of non-reflective coating. In a statement, Edmund Optics says the need to retain uniform AR layers above aspheric or freeform optics is too precise, which added cost and limited production tool capacity. It is the mid-volume producers that these technical barriers hurt most making availability lower in niche areas. This complicacy impacts delivery times and variety of product, thereby limiting the scope for a new product launch in anti-reflective coatings market trends.
Segmentation Analysis:
By Technology
Sputtering held a dominant anti-reflective coatings market share of 63.50% in 2024, owing to accurate, uniform thin film deposition required for displays and optics. Applied Materials said that sputtering allows for complex multi-layer AR designs in semiconductors and foldable screens. The U.S. Department of Energy also states; sputtered AR layers enhance solar glass performance in a variety of weather conditions. These advantages make sputtering favorable with manufacturers, which adds to its leadership in the anti-reflective coatings market over high-end consumer electronics and renewable energy applications.
Electron beam evaporation is the fastest growing with the highest CAGR of 9.12% during the forecast period over 2025-2032, due premium curved optics and space application. Edmund Optics notes increased demand for e-beam AR coatings in medical imaging and telescopes using high density, defect free coatings. E-beam is also the preference of NASA’s mirror projects for finer reflection control. These applications drive faster adoption, making electron beam evaporation the fastest growing technology in anti-reflective coatings market.
By Layer Type
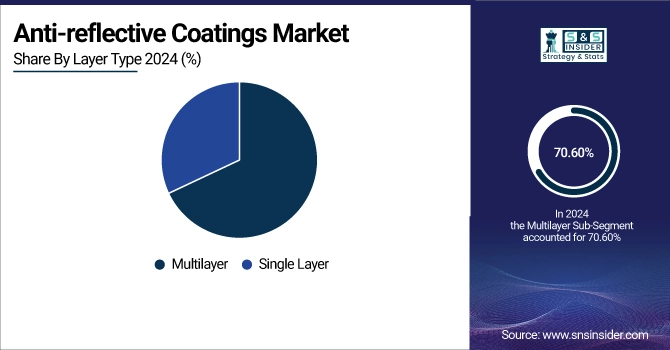
Multilayer held a dominant anti-reflective coatings market share of 70.60% in 2024 on account of glare reduction improvements for consumer electronics and solar panels. ZEISS touts its multilayer AR stacks for camera lenses and foldable phones to boost brightness and scratch resistance. The U.S. Department of Energy reports that module efficiency gains were measured when multi layered films are deposited on top and back surfaces to increase light absorption resulting in increased power output. These multiple benefits ensure that multilayer coatings are the coating of choice for manufacturers looking to provide premium optical performance in the anti-reflective coatings market.
Multilayer is the fastest growing with the highest CAGR of 8.99% during the forecast period over 2025-2032, due to advanced automotive HUDs and bifacial solar glass applications. Samsung and Hyundai use complex multilayer AR films to enhance clarity on curved dashboards and displays. First Solar pastes on multilayer coatings for better capturing of diffuse light, boosting efficiency. These advancements in high growth applicable end-use industries are expected to create the highest relevance for multilayer coatings technology throughout the anti-reflective coatings market.
By Material
Silicon dioxide (SiO₂) held a dominant anti-reflective coatings market share of 45.80% in 2024 owing to clear and cost-efficient optical characteristics. AGC Inc has independently verified that SiO₂ is widely used in architectural glass and smartphone screens to cut reflections. The U.S. Department of Energy cites its contribution to solar glass for balancing cost and light-transmission properties. This useful equilibrium ensures that silicon dioxide will remain the material of choice for throughput, every-day industrial actor in large-end-use-segment areas within the anti-reflective coatings industry.
Titanium dioxide (TiO₂) is the fastest growing with the highest CAGR of 9.58% during the forecast period over 2025-2032, due to high index multi-layer optical designs. ZEISS leverage TiO₂ in high end camera lenses and AR headsets, where compact, dense stacks of layers are key. The use of TiO₂-based AR films in automotive glazing for safety and clarity is well established at Mercedes-Benz. These high-end products ensure rapid growth of titanium dioxide for niche demand in the anti-reflective coatings market.
By End-use Application
Eyewear & optics held a dominant anti-reflective coatings market share of 36.10% in 2024 on the basis of increased need for vision care and the rising preference for premium AR lenses. According to EssilorLuxottica, producers are introducing scratch-resistant and glare-ridding coatings, which help improve the durability of the lenses. The Vision Council reports that over 164 million U.S. adults use RX eyewear, which will keep the demand for the product category stable. The U.S. Department of Energy indicates that AR-coated lenses lessen the strain on the lighting indoors, which makes eyewear and optics the most lucrative domain in the anti-reflective coatings market.
Electronics & displays is the fastest growing with the highest CAGR of 9.28% during the forecast period over 2025-2032, due to foldable OLED screens and AR devices. Samsung’s foldable phones include multilayer AR films to enhance brightness and battery performance. Apple is also developing AR layers in tablets and laptops. The U.S. Department of Energy also backs display coatings that reduce indoor reflection, which in turn saves energy. These advancements maintain electronics and displays as the most flourishing application in anti-reflective coatings.
Regional Analysis
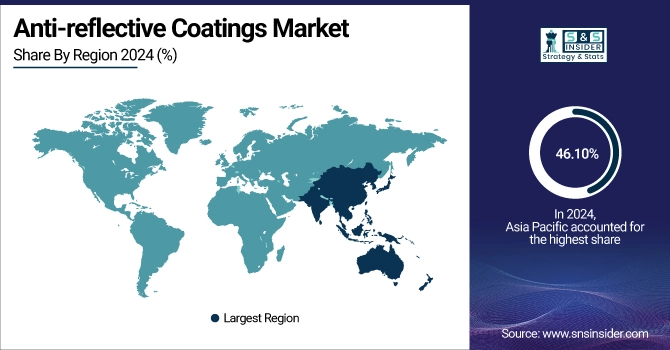
Asia Pacific is the dominating and fastest-growing region in the anti-reflective coatings market with a significant market share of 46.10% and the highest forecast CAGR of 9.18% during 2025–2032. China dominates with high-volume electronics production needing advanced display coatings for smartphones and TVs. Japan follows with Sony’s premium cameras using complex non-reflective coatings. India’s solar boom drives demand for solar panel coatings to boost power output. These trends ensure robust anti-reflective coatings market growth across Asia Pacific.
Get Customized Report as per Your Business Requirement - Enquiry Now
North America is the second-dominating region in the anti-reflective coatings market with a significant market share of 24.50% due to rising premium eyewear and advanced display coatings adoption. The U.S. leads, holding a market share of about 83% with a market size of USD 1.17 billion in 2024 and is projected to reach a value of USD 2.30 billion by 2032, drawing major investments by EssilorLuxottica and Corning in durable scratch-resistant coatings for lenses and smartphones. Canada follows with increased demand for anti-reflective glass in commercial buildings. Consistent upgrades in optical coatings for automotive displays sustain North America’s stable position in the anti-reflective coatings market.
Europe is the third dominating region in the anti-reflective coatings market with a significant market share of 20.70% driven by strong automotive and renewable solar panel coatings adoption. Germany dominates with ZEISS leading precision thin-film coatings for lenses and AR devices. France supports large-scale use of photovoltaic coatings through government-backed solar projects. These factors strengthen the regional anti-reflective coatings market trends as European manufacturers invest in low-glare, eco-friendly glass coatings for buildings and premium optics.
Key Players:
The major anti-reflective coatings market competitors include Carl Zeiss AG (ZEISS), EssilorLuxottica SA, HOYA Corporation, PPG Industries, Inc., AGC Inc., Nippon Sheet Glass Co., Ltd (NSG Group), DuPont de Nemours Inc., Merck KGaA, Royal DSM (Koninklijke DSM N.V.), Andover Corporation, Optics Balzers AG, Evaporated Coatings Inc., Quantum Coating Inc., Optical Coatings Japan, iCoat Company LLC, Edmund Optics Inc., EKSMA Optics UAB, JDS Uniphase Corporation (Viavi Solutions), Applied Materials, Inc., and NiPro Optics.
Recent Developments:
-
In July 2025, AGC introduced “Clearsight” anti-reflective architectural glass reducing surface reflectance to 0.9%, boosting daylight transmission in commercial buildings.
-
In January 2025, ZEISS launched DuraVision Gold UV, a premium anti-reflective coating featuring integrated CleanGuard technology for 3× faster cleanability and a subtle golden residual reflectance with up to 90% less lens yellowness in low-light conditions.
| Report Attributes | Details |
|---|---|
| Market Size in 2024 | USD 5.78 billion |
| Market Size by 2032 | USD 11.47 billion |
| CAGR | CAGR of 8.95% From 2025 to 2032 |
| Base Year | 2024 |
| Forecast Period | 2025-2032 |
| Historical Data | 2021-2023 |
| Report Scope & Coverage | Market Size, Segments Analysis, Competitive Landscape, Regional Analysis, DROC & SWOT Analysis, Forecast Outlook |
| Key Segments | •By Technology (Electron Beam Evaporation, Sputtering, Others) •By Layer Type (Single Layer, Multilayer) •By Material (Silicon Dioxide (SiO₂), Magnesium Fluoride (MgF₂), Titanium Dioxide (TiO₂), Zirconium Dioxide (ZrO₂), Aluminum Oxide (Al₂O₃), Others) •By End-use Application (Eyewear & Optics, Electronics & Displays, Solar, Automotive, Others) |
| Regional Analysis/Coverage | North America (US, Canada, Mexico), Europe (Germany, France, UK, Italy, Spain, Poland, Turkey, Rest of Europe), Asia Pacific (China, India, Japan, South Korea, Singapore, Australia, Rest of Asia Pacific), Middle East & Africa (UAE, Saudi Arabia, Qatar, South Africa, Rest of Middle East & Africa), Latin America (Brazil, Argentina, Rest of Latin America) |
| Company Profiles | Carl Zeiss AG (ZEISS), EssilorLuxottica SA, HOYA Corporation, PPG Industries, Inc., AGC Inc., Nippon Sheet Glass Co., Ltd (NSG Group), DuPont de Nemours Inc., Merck KGaA, Royal DSM (Koninklijke DSM N.V.), Andover Corporation, Optics Balzers AG, Evaporated Coatings Inc., Quantum Coating Inc., Optical Coatings Japan, iCoat Company LLC, Edmund Optics Inc., EKSMA Optics UAB, JDS Uniphase Corporation (Viavi Solutions), Applied Materials, Inc., and NiPro Optics |
Frequently Asked Questions
Silicon dioxide (SiO?) leads for affordability and clarity, while titanium dioxide (TiO?) sees fastest growth in multilayer optical and automotive glass coatings.
Asia Pacific dominates with 46.10% share, led by electronics and solar; North America and Europe follow with strong eyewear and automotive applications.
Anti-glare coatings reduce reflections, enhance visibility in AR/VR devices, curved automotive dashboards, and medical optics, supporting premium product adoption and user safety.
Eyewear & optics, electronics & displays, solar energy, and automotive sectors boost demand for anti-glare coatings and transparent coatings, sustaining robust market expansion.
The Anti-reflective Coatings Market shows strong growth driven by advanced thin-film, scratch-resistant, and solar panel coatings, reaching USD 11.47 billion by 2032.
Get in Touch
