Building Envelope Market Report Scope & Overview:
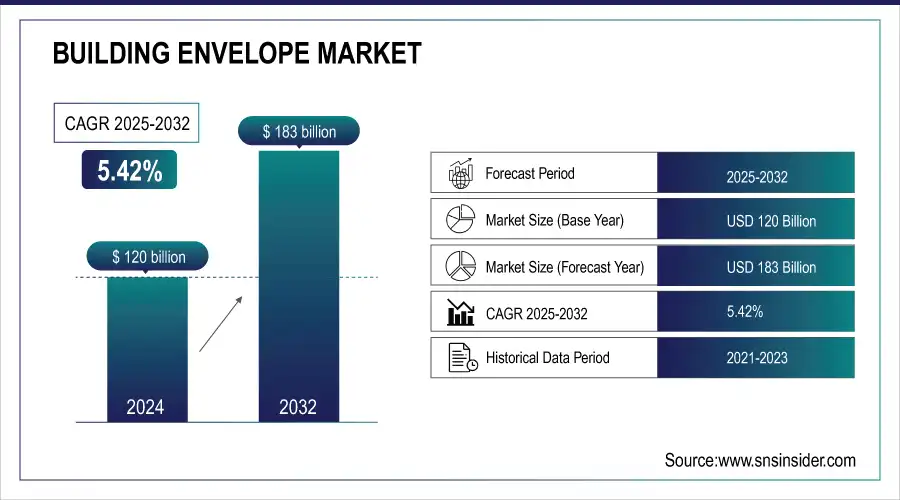
The Building Envelope Market size was valued at USD 120 Billion in 2024 and is projected to reach USD 183 Billion by 2032, growing at a CAGR of 5.42% during 2025-2032.
The Building Envelope Market refers to the sector focused on the design, manufacturing, and installation of components that separate a building’s interior from the external environment. This includes walls, roofs, windows, doors, and cladding systems, which are critical for energy efficiency, structural integrity, weather protection, and occupant comfort. Building Envelope Market Growth is being driven by rising awareness of sustainable construction, increasing demand for energy-efficient buildings, and advancements in materials and smart technologies. Current Building Envelope Market Trends include the adoption of high-performance insulation, glass facades, weather-resistant materials, and integration of digital and smart building technologies. The market is also influenced by regulatory frameworks, urbanization trends, and investment by key players in innovative solutions.
In February 2025, Alloy Development opened NYC’s first Passive House-certified public schools in Brooklyn, featuring energy-efficient, fire-resistant designs. The project highlights superinsulated walls, airtight construction, and high-performance windows, setting a benchmark for sustainable urban buildings.
Key Building Envelope Market Trends
-
Increasing adoption of energy-efficient materials and systems to reduce carbon footprint and comply with stringent green building regulations.
-
Integration of IoT, sensors, and smart coatings for real-time monitoring of energy usage, thermal comfort, and building performance.
-
Rise of high-performance materials like aerogels, composite panels, and self-healing coatings that enhance durability, insulation, and weather resistance.
-
Growing trend toward upgrading existing buildings with modern façade systems, windows, and insulation to improve energy efficiency.
-
Emphasis on envelope solutions that can withstand rising extreme weather events, including storms, heatwaves, and heavy rainfall.
-
Shift toward off-site manufacturing of façade panels and wall systems for faster installation, cost reduction, and consistent quality.
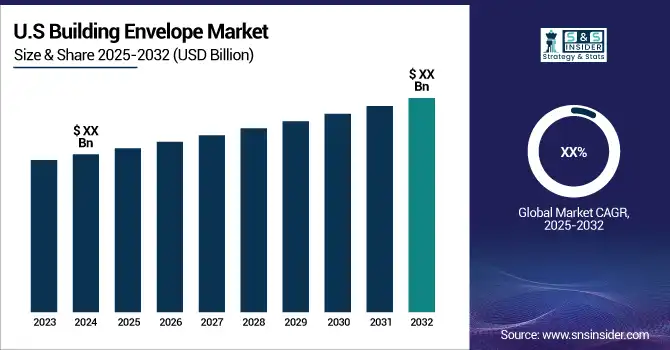
The U.S. Building Envelope Market is projected to experience steady growth from USD 30.10 billion in 2024 to USD 44.16 billion by 2032, registering a CAGR of 4.91% during the forecast period. The growth can be attributed to rise in investment in energy-efficient construction, sustainable building materials, and increasing demand for high-performance façade and cladding systems. Market expansion signifies the broader advancement of commercial as well as residential facilities today in an effort to minimize the consumption of energy as well as the improvement of building longevity. The North American building envelope market is driven by the U.S. as the top shareholder.
Building Envelope Market Growth Drivers:
-
Global Energy Efficiency Regulations Are Driving the Adoption of High-Performance Building Envelopes to Reduce Energy Use and Carbon Emissions
The Building Envelope Systems Industry is witnessing a significant transformation as sustainability and energy efficiency regulations become a central focus in the building sector. The Global Building Envelope Market is increasingly shaped by these standards, as buildings account for nearly 40% of global energy consumption and carbon emissions. Governments and regulatory bodies worldwide are tightening energy efficiency requirements, emphasizing the critical role of building envelopes in thermal insulation and reducing energy loss. For instance, in 2023, over 23 countries revised their energy codes to prioritize envelope performance, promoting the use of high-performance walls, roofs, and windows. These measures not only lower operational energy demands but also drive innovation in eco-friendly materials and construction technologies, advancing global decarbonization efforts while enhancing occupant comfort and long-term building sustainability.
Building Envelope Market Restraints:
-
High Upfront Costs Limit Adoption of Advanced Building Envelope Systems Despite Long-Term Energy Savings
High initial costs remain a notable barrier to adopting advanced building envelope systems, despite their long-term energy-saving benefits. But, technologies such as low-emissivity glass, insulated wall panels, and high-performance roofing materials cost more upfront than traditional building alternatives. For instance, approximately up to USD 120,000 for a retrofitted 500-square-meter commercial space, which are not financially friendy for smaller-scale developers or for projects that have a slighter tighter budget. While these systems can realistically save 20–40% of the annual heating and cooling energy use in residential homes over their lifetime, this high expenditure usually causes long lead times for their implementation. Resulting, while there are obvious benefits associated with its efficiency and sustainability, the high upfront capital cost restricts widespread use, especially in areas with limited construction budgets or where aligned financing solutions for green building technology are lacking.
Building Envelope Market Opportunities:
-
Enhancing Energy Efficiency Through Retrofitting by Upgrading Building Envelopes for Sustainable and Cost-Effective Urban Infrastructure
Retrofitting existing buildings by upgrading their building envelopes has become a crucial strategy for improving energy efficiency and reducing operational costs. Many older structures, particularly those constructed before modern energy codes, suffer from poor insulation, air leakage, and inefficient windows or cladding. Upgrading the insulation of walls, roofs, windows, and doors can cut down heating and cooling needs, provide for greater interior comfort, and improve the quality of indoor or outdoor air. Research has shown that it can reduce energy consumption in existing buildings by between 30–50% depending on the retrofitting measures taken. Such efforts also advance sustainability objectives in urban areas with aging infrastructure by reducing greenhouse gas emissions. Around the world, governments are offering more incentives for retrofits an opportunity to upgrade their building stock while satisfying climate commitments.
Key Building Envelope Market Segment Analysis
-
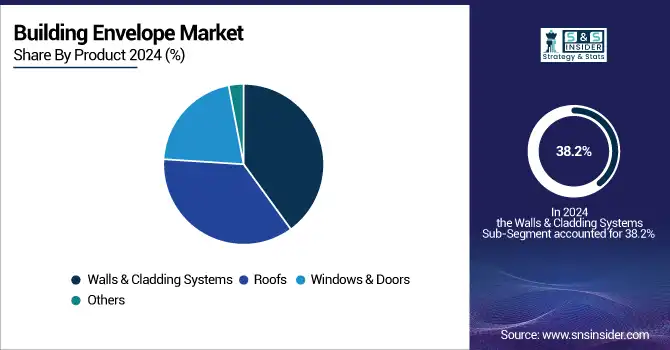
By Product, walls & cladding systems dominated with a 38.2% revenue share in 2024; roofs fastest growing.
-
By End Use, residential led with a 42.4% revenue share in 2024; commercial segment fastest growing.
-
By Material Type, metal dominated with 42% in 2024; composites fastest growing.
-
By Function/Performance, thermal insulation systems held 38% in 2024; weatherproofing & waterproofing fastest growing.
By Product, in the Building Envelope Market, Walls and Cladding Dominate, While Roofs Represent the Fastest-Growing Segment
In the building envelope market, walls and cladding systems emerged as the dominant product segment in 2024. This is indicative of the ongoing need for exterior that provides structural soundness, great looks and thermal performance in residential and commercial construction. The downside of the improved thermal as well as sound insulation and weather resistance are ever-increasing buildings which can also be done with walls and cladding to other than just improve the attractiveness of a property. The walls and cladding are the largest segment in this category, but the roof segment is growing at the fastest rate. Growing focus on energy-efficient roofing materials, innovative designs, and increasing penetration of sustainable and lightweight solutions in roofing are boosting adoption of roofs, making it the fastest growing product type in building envelope.
By End Use, Residential Sector Leads Building Envelope Market In 2024, Commercial Segment Fastest-Growing
The residential sector led the building envelope market in 2024, reflecting the ongoing construction and renovation activities across homes and apartment complexes. Demand from residential applications has been driven by the increasing rate of urbanization, rising disposable income and growing knowledge about energy efficiency. More homeowners are turning to new, high-performance envelopes that provide greater insulation, a more attractive appearance, and increased longevity. On the other hand, the commercial segment is set to become the fastest-growing end-use sector. The boom in office spaces, retail complexes, and mixed-use developments has spurred demand for customized building envelope solutions that ensure high performance, and longevity, while being compliant with green building codes and sustainability initiatives in commercial properties.
By Material Type, Metal Dominates While Composites Accelerate Growth in the 2024 Building Envelope Market
Metal has traditionally dominated the building envelope market due to its strength, durability, and adaptability across various construction applications in 2024. They make it highly adopted for both residential buildings and commercial buildings because they resist to extreme weather conditions and gives additional support to the structural framework while laying a contemporary outlook of the building with the help of Metal based envelopes. As a bonus, metals suit sustainable building and are also recyclable. Given metal still being the leading material, composites are the fastest growing material type. This has led to their lightweight characteristics, versatility, and ability to provide better insulation and weatherproofing driving adoption. From an architectural perspective, improvements in composite manufacturing and a renewed commitment to sustainable building materials are facilitating a greater acceptance of composites for use in walls, roofs and cladding materials.
By Function/Performance, Thermal Insulation Leads The 2024 Building Envelope Market, Driven by Energy Efficiency and Occupant Comfort
Thermal insulation systems held a leading position in the building envelope market in 2024, highlighting the critical focus on energy efficiency and occupant comfort. These systems reduce heating and cooling demands, improve indoor air quality, and contribute to sustainability goals by lowering energy consumption. By reducing heating and cooling loads, improving indoor air quality, and consuming less energy, these systems also help meet critical sustainability objectives. Irrespective of the building type, be it residential, commercial, or industrial, thermal insulation is of utmost importance, impacting construction decisions and choice of material. Although in terms of product, insulation holds the major share of the market, weatherproofing and waterproofing systems are the fastest-growing segment. Demand for envelopes to prevent water entry, moisture, and environmental deterioration for long-term building performance has been fuelled by greater recognition of climate resilience, more experience with extreme weather, and tighter building codes.
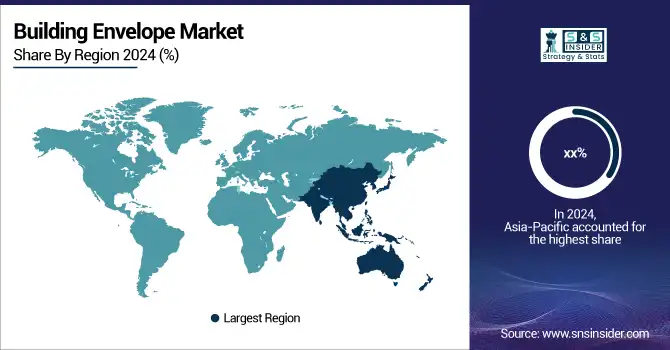
Asia-Pacific Building Envelope Market Insights
In 2024, the Asia-Pacific building envelope market showed significant momentum due to rapid urbanization, industrialization, and large-scale construction activities. China, India, Japan and South Korea are key architectural drivers, with significant investment across residential, industrial, and infrastructure projects. Usage of energy-efficient building technologies, sustainable materials, and advanced façade solutions is gradually increasing. This could be due to governments incentivizing green construction and the retrofitting of older buildings with energy standards that are more suitable to modern living. In addition, the increasing awareness regarding environmental impact and stringent building codes in prominent countries promote the higher consumption of thermal insulation, acoustic systems, and weatherproofing products.
North America Building Envelope Market Insights
North America dominated the global building envelope market in 2024 with a 33% share, reflecting strong adoption across residential, commercial, and industrial sectors. Strong requirements via building regulations and government initiatives for energy-efficient building by the U.S. are driving high demand for high-performance insulation, acoustic, and building envelope systems in the region. Market growth is further propelled by large-scale retrofitting initiatives and infrastructure modernization projects. The dominance of North America is mainly due to advanced construction technology, readily available skilled labor and awareness about sustainability. In Canada and Mexico, adoption is slowly growing under government-backed technology programs to facilitate energy-efficient buildings and green infrastructure projects. The concentration on industrial activity and a high-quality of building material, confirming the leading status of the region in the whole world.
Europe Building Envelope Market Insights
In 2024, Europe’s building envelope market experienced steady growth, driven by strict regulations and policies promoting energy efficiency and sustainability. Germany, France and Italy have: stringent building codes and retrofitting programs aimed at reducing energy expenditure and consumption in residential and commercial buildings. Demand is also boosted by investments into green infrastructure, renewable energy integration and use of high-performance construction materials. Awareness campaigns and sustainable building incentives are also propping the market.
Middle East & Africa Building Envelope Market Insights
The Middle East & Africa building envelope market in 2024 is gradually expanding due to increasing urbanization, industrial development, and infrastructure projects. Development of the GCC countries and South Africa are Key economies driving for adoption of which Modern Construction Technology & creation of Energy-Efficient Building Materials will be the key trends. Although the market is still in an emerging phase, forces like limited supply chains, poor recycling infrastructure, and dependency on imports limit the market from growing fast. This is due to the fact that governments are becoming more concerned with sustainable construction and investing in energy-efficient materials.
Latin America Building Envelope Market Insights
In 2024, Latin America’s building envelope market is gradually developing, supported by expanding construction and industrial sectors. Brazil and Chile are leading the charge in widescale adoption, especially with sustainability initiatives and retrofitting programs. Market growth is driven by modernization of infrastructure with renovation of buildings, increased number of residential and commercial buildings, and increasing aware for energy efficiency. However, the region still faces challenges such as a lack of local manufacturing, irregular supply of material and lack of recycling infrastructure. In spite of these limitations, there is a continuous increase in the demand for thermal insulation, acoustic systems and high-performance cladding solutions.
Competitive Landscape for Building Envelope Market:
Owens Corning, founded in 1938 and headquartered in Toledo, Ohio, is a global leader in building materials and composite solutions. They manufacture insulation, roofing, and fiberglass products that increase energy efficiency, ease, durability, and sustainability for residential, commercial, and industrial purposes. Owens Corning outpaces the building and construction marketplace with innovative products and solutions backed by an intensive commitment to sustainability that save energy and resources, improving the performance of homes, buildings and communities across the globe. The firm consistently promotes innovations in construction materials and industrial composites with an emphasis on R&D.
In Feb 2025, Owens Corning, a residential and commercial building products leader, announced an investment in shingle manufacturing capacity with the addition of a new facility in the southeastern United States. The strategic investment will expand the company’s Roofing manufacturing network, enhancing Owens Corning’s ability to meet the strong and growing demand for its shingles.
Building Envelope Market Key Players:
Some of the Building Envelope Market Companies
-
Saint-Gobain
-
Owens Corning
-
Kingspan Group
-
Rockwool International
-
BASF SE
-
DuPont de Nemours
-
GAF Materials Corporation
-
Sika AG
-
Etex Corp
-
3M Company
-
Knauf Insulation
-
Yuanda China
-
Dow Chemical Company
-
Henkel AG
-
H.B. Fuller
-
National Gypsum
-
Johns Manville
-
DOW CORNING
-
Huntsman Corporation
-
Bostik (Arkema)
Report Attributes | Details |
Market Size in 2024 | USD 120 Billion |
Market Size by 2032 | USD 183 Billion |
CAGR | CAGR of 5.42% From 2025 to 2032 |
Base Year | 2024 |
Forecast Period | 2025-2032 |
Historical Data | 2021-2023 |
Report Scope & Coverage | Market Size, Segments Analysis, Competitive Landscape, Regional Analysis, DROC & SWOT Analysis, Forecast Outlook |
Key Segments | • By Product (Walls & Cladding Systems, Roofs, Windows & Doors, Others) • By End Use (Residential, Commercial, Industrial) • By Material Type (Metal, Glass, Concrete, Wood, Composites, Others) • By Function/Performance (Thermal Insulation Systems, Acoustic Insulation Systems, Weatherproofing & Waterproofing, Fire-Resistant Systems, Structural Support Systems) |
Regional Analysis/Coverage | North America (US, Canada, Mexico), Europe (Germany, France, UK, Italy, Spain, Poland, Turkey, Rest of Europe), Asia Pacific (China, India, Japan, South Korea, Singapore, Australia, Rest of Asia Pacific), Middle East & Africa (UAE, Saudi Arabia, Qatar, South Africa, Rest of Middle East & Africa), Latin America (Brazil, Argentina, Rest of Latin America) |
Company Profiles | Saint-Gobain, Owens Corning, Kingspan Group, Rockwool International, BASF SE, DuPont de Nemours, GAF Materials Corporation, Sika AG, Etex Corp, 3M Company, Knauf Insulation, Yuanda China, Dow Chemical Company, Henkel AG, H.B. Fuller, National Gypsum, Johns Manville, DOW CORNING, Huntsman Corporation, Bostik (Arkema) |
Table Of Contents
1. Introduction
1.1 Market Definition & Scope
1.2 Research Assumptions & Abbreviations
1.3 Research Methodology
2. Executive Summary
2.1 Market Snapshot
2.2 Market Absolute $ Opportunity Assessment & Y-o-Y Analysis, 2021–2032
2.3 Market Size & Forecast, By Segmentation, 2021–2032
2.3.1 Market Size By Product
2.3.2 Market Size By End Use
2.3.3 Market Size By Material Type
2.3.4 Market Size By Function/Performance
2.4 Market Share & BPS Analysis By Region, 2024
2.5 Industry Growth Scenarios – Conservative, Likely & Optimistic
2.6 Industry CxO’s Perspective
3. Market Overview
3.1 Market Dynamics
3.1.1 Drivers
3.1.2 Restraints
3.1.3 Opportunities
3.1.4 Key Market Trends
3.2 Industry PESTLE Analysis
3.3 Key Industry Forces (Porter’s) Impacting Market Growth
3.4 Industry Life Cycle Assessment
3.5 Parent Market Overview
3.6 Market Risk Assessment
4. Statistical Insights & Trends Reporting
4.1 Green Building & Regulatory Compliance Analysis
4.2 Technological Innovation & Material R&D Pipeline
4.3 End-Use Sector Profitability & Demand Mapping
4.4 Supply Chain Vulnerability & Material Sourcing Risk Assessment
4.5 Digital Integration & Smart Envelope Solutions Insights
4.6 Strategic Collaborations, Mergers & Expansion Tracker
5. Copper Scrap Market Segmental Analysis & Forecast, By Product, 2021 – 2032, Value (USD Billion)
5.1 Introduction
5.2 Walls & Cladding Systems
5.2.1 Key Trends
5.2.2 Market Size & Forecast, 2021 – 2032
5.3 Roofs
5.3.1 Key Trends
5.3.2 Market Size & Forecast, 2021 – 2032
5.4 Windows & Doors
5.4.1 Key Trends
5.4.2 Market Size & Forecast, 2021 – 2032
5.5 Others
5.5.1 Key Trends
5.5.2 Market Size & Forecast, 2021 – 2032
6. Copper Scrap Market Segmental Analysis & Forecast, By End Use, 2021 – 2032, Value (USD Billion)
6.1 Introduction
6.2 Residential
6.2.1 Key Trends
6.2.2 Market Size & Forecast, 2021 – 2032
6.3 Commercial
6.3.1 Key Trends
6.3.2 Market Size & Forecast, 2021 – 2032
6.4 Industrial
6.4.1 Key Trends
6.4.2 Market Size & Forecast, 2021 – 2032
7. Copper Scrap Market Segmental Analysis & Forecast, By Material Type, 2021 – 2032, Value (USD Billion)
7.1 Introduction
7.2 Metal
7.2.1 Key Trends
7.2.2 Market Size & Forecast, 2021 – 2032
7.3 Glass
7.3.1 Key Trends
7.3.2 Market Size & Forecast, 2021 – 2032
7.4 Concrete
7.4.1 Key Trends
7.4.2 Market Size & Forecast, 2021 – 2032
7.5 Wood
7.5.1 Key Trends
7.5.2 Market Size & Forecast, 2021 – 2032
7.6 Composites
7.6.1 Key Trends
7.6.2 Market Size & Forecast, 2021 – 2032
7.7 Others
7.7.1 Key Trends
7.7.2 Market Size & Forecast, 2021 – 2032
8. Copper Scrap Market Segmental Analysis & Forecast, By Function/Performance, 2021 – 2032, Value (USD Billion)
8.1 Introduction
8.2 Thermal Insulation Systems
8.2.1 Key Trends
8.2.2 Market Size & Forecast, 2021 – 2032
8.3 Acoustic Insulation Systems
8.3.1 Key Trends
8.3.2 Market Size & Forecast, 2021 – 2032
8.4 Weatherproofing & Waterproofing
8.4.1 Key Trends
8.4.2 Market Size & Forecast, 2021 – 2032
8.5 Fire-Resistant Systems
8.5.1 Key Trends
8.5.2 Market Size & Forecast, 2021 – 2032
8.6 Structural Support Systems
8.6.1 Key Trends
8.6.2 Market Size & Forecast, 2021 – 2032
9. Copper Scrap Market Segmental Analysis & Forecast by Region, 2021 – 2025, Value (USD Billion)
9.1 Introduction
9.2 North America
9.2.1 Key Trends
9.2.2 Copper Scrap Market Size & Forecast, By Product, 2021 – 2032
9.2.3 Copper Scrap Market Size & Forecast, By End Use, 2021 – 2032
9.2.4 Copper Scrap Market Size & Forecast, By Material Type, 2021 – 2032
9.2.5 Copper Scrap Market Size & Forecast, By Function/Performance, 2021 – 2032
9.2.6 Copper Scrap Market Size & Forecast, By Country, 2021 – 2032
9.2.6.1 USA
9.2.6.1.1 Copper Scrap Market Size & Forecast, By Product, 2021 – 2032
9.2.6.1.2 Copper Scrap Market Size & Forecast, By End Use, 2021 – 2032
9.2.6.1.3 Copper Scrap Market Size & Forecast, By Material Type, 2021 – 2032
9.2.6.1.4 Copper Scrap Market Size & Forecast, By Function/Performance, 2021 – 2032
9.2.6.2 Canada
9.2.6.2.1 Copper Scrap Market Size & Forecast, By Product, 2021 – 2032
9.2.6.2.2 Copper Scrap Market Size & Forecast, By End Use, 2021 – 2032
9.2.6.2.3 Copper Scrap Market Size & Forecast, By Material Type, 2021 – 2032
9.2.6.2.4 Copper Scrap Market Size & Forecast, By Function/Performance, 2021 – 2032
9.3 Europe
9.3.1 Key Trends
9.3.2 Copper Scrap Market Size & Forecast, By Product, 2021 – 2032
9.3.3 Copper Scrap Market Size & Forecast, By End Use, 2021 – 2032
9.3.4 Copper Scrap Market Size & Forecast, By Material Type, 2021 – 2032
9.3.5 Copper Scrap Market Size & Forecast, By Function/Performance, 2021 – 2032
9.3.6 Copper Scrap Market Size & Forecast, By Country, 2021 – 2032
9.3.6.1 Germany
9.3.6.1.1 Copper Scrap Market Size & Forecast, By Product, 2021 – 2032
9.3.6.1.2 Copper Scrap Market Size & Forecast, By End Use, 2021 – 2032
9.3.6.1.3 Copper Scrap Market Size & Forecast, By Material Type, 2021 – 2032
9.3.6.1.4 Copper Scrap Market Size & Forecast, By Function/Performance, 2021 – 2032
9.3.6.2 UK
9.3.6.2.1 Copper Scrap Market Size & Forecast, By Product, 2021 – 2032
9.3.6.2.2 Copper Scrap Market Size & Forecast, By End Use, 2021 – 2032
9.3.6.2.3 Copper Scrap Market Size & Forecast, By Material Type, 2021 – 2032
9.3.6.2.4 Copper Scrap Market Size & Forecast, By Function/Performance, 2021 – 2032
9.3.6.3 France
9.3.6.3.1 Copper Scrap Market Size & Forecast, By Product, 2021 – 2032
9.3.6.3.2 Copper Scrap Market Size & Forecast, By End Use, 2021 – 2032
9.3.6.3.3 Copper Scrap Market Size & Forecast, By Material Type, 2021 – 2032
9.3.6.3.4 Copper Scrap Market Size & Forecast, By Function/Performance, 2021 – 2032
9.3.6.4 Italy
9.3.6.4.1 Copper Scrap Market Size & Forecast, By Product, 2021 – 2032
9.3.6.4.2 Copper Scrap Market Size & Forecast, By End Use, 2021 – 2032
9.3.6.4.3 Copper Scrap Market Size & Forecast, By Material Type, 2021 – 2032
9.3.6.4.4 Copper Scrap Market Size & Forecast, By Function/Performance, 2021 – 2032
9.3.6.5 Spain
9.3.6.5.1 Copper Scrap Market Size & Forecast, By Product, 2021 – 2032
9.3.6.5.2 Copper Scrap Market Size & Forecast, By End Use, 2021 – 2032
9.3.6.5.3 Copper Scrap Market Size & Forecast, By Material Type, 2021 – 2032
9.3.6.5.4 Copper Scrap Market Size & Forecast, By Function/Performance, 2021 – 2032
9.3.6.6 Russia
9.3.6.6.1 Copper Scrap Market Size & Forecast, By Product, 2021 – 2032
9.3.6.6.2 Copper Scrap Market Size & Forecast, By End Use, 2021 – 2032
9.3.6.6.3 Copper Scrap Market Size & Forecast, By Material Type, 2021 – 2032
9.3.6.6.4 Copper Scrap Market Size & Forecast, By Function/Performance, 2021 – 2032
9.3.6.7 Poland
9.3.6.7.1 Copper Scrap Market Size & Forecast, By Product, 2021 – 2032
9.3.6.7.2 Copper Scrap Market Size & Forecast, By End Use, 2021 – 2032
9.3.6.7.3 Copper Scrap Market Size & Forecast, By Material Type, 2021 – 2032
9.3.6.7.4 Copper Scrap Market Size & Forecast, By Function/Performance, 2021 – 2032
9.3.6.8 Rest of Europe
9.3.6.8.1 Copper Scrap Market Size & Forecast, By Product, 2021 – 2032
9.3.6.8.2 Copper Scrap Market Size & Forecast, By End Use, 2021 – 2032
9.3.6.8.3 Copper Scrap Market Size & Forecast, By Material Type, 2021 – 2032
9.3.6.8.4 Copper Scrap Market Size & Forecast, By Function/Performance, 2021 – 2032
9.4 Asia-Pacific
9.4.1 Key Trends
9.4.2 Copper Scrap Market Size & Forecast, By Product, 2021 – 2032
9.4.3 Copper Scrap Market Size & Forecast, By End Use, 2021 – 2032
9.4.4 Copper Scrap Market Size & Forecast, By Material Type, 2021 – 2032
9.4.5 Copper Scrap Market Size & Forecast, By Function/Performance, 2021 – 2032
9.4.6 Copper Scrap Market Size & Forecast, By Country, 2021 – 2032
9.4.6.1 China
9.4.6.1.1 Copper Scrap Market Size & Forecast, By Product, 2021 – 2032
9.4.6.1.2 Copper Scrap Market Size & Forecast, By End Use, 2021 – 2032
9.4.6.1.3 Copper Scrap Market Size & Forecast, By Material Type, 2021 – 2032
9.4.6.1.4 Copper Scrap Market Size & Forecast, By Function/Performance, 2021 – 2032
9.4.6.2 India
9.4.6.2.1 Copper Scrap Market Size & Forecast, By Product, 2021 – 2032
9.4.6.2.2 Copper Scrap Market Size & Forecast, By End Use, 2021 – 2032
9.4.6.2.3 Copper Scrap Market Size & Forecast, By Material Type, 2021 – 2032
9.4.6.2.4 Copper Scrap Market Size & Forecast, By Function/Performance, 2021 – 2032
9.4.6.3 Japan
9.4.6.3.1 Copper Scrap Market Size & Forecast, By Product, 2021 – 2032
9.4.6.3.2 Copper Scrap Market Size & Forecast, By End Use, 2021 – 2032
9.4.6.3.3 Copper Scrap Market Size & Forecast, By Material Type, 2021 – 2032
9.4.6.3.4 Copper Scrap Market Size & Forecast, By Function/Performance, 2021 – 2032
9.4.6.4 South Korea
9.4.6.4.1 Copper Scrap Market Size & Forecast, By Product, 2021 – 2032
9.4.6.4.2 Copper Scrap Market Size & Forecast, By End Use, 2021 – 2032
9.4.6.4.3 Copper Scrap Market Size & Forecast, By Material Type, 2021 – 2032
9.4.6.4.4 Copper Scrap Market Size & Forecast, By Function/Performance, 2021 – 2032
9.4.6.5 Australia
9.4.6.5.1 Copper Scrap Market Size & Forecast, By Product, 2021 – 2032
9.4.6.5.2 Copper Scrap Market Size & Forecast, By End Use, 2021 – 2032
9.4.6.5.3 Copper Scrap Market Size & Forecast, By Material Type, 2021 – 2032
9.4.6.5.4 Copper Scrap Market Size & Forecast, By Function/Performance, 2021 – 2032
9.4.6.6 ASEAN Countries
9.4.6.6.1 Copper Scrap Market Size & Forecast, By Product, 2021 – 2032
9.4.6.6.2 Copper Scrap Market Size & Forecast, By End Use, 2021 – 2032
9.4.6.6.3 Copper Scrap Market Size & Forecast, By Material Type, 2021 – 2032
9.4.6.6.4 Copper Scrap Market Size & Forecast, By Function/Performance, 2021 – 2032
9.4.6.7 Rest of Asia-Pacific
9.4.6.7.1 Copper Scrap Market Size & Forecast, By Product, 2021 – 2032
9.4.6.7.2 Copper Scrap Market Size & Forecast, By End Use, 2021 – 2032
9.4.6.7.3 Copper Scrap Market Size & Forecast, By Material Type, 2021 – 2032
9.4.6.7.4 Copper Scrap Market Size & Forecast, By Function/Performance, 2021 – 2032
9.5 Latin America
9.5.1 Key Trends
9.5.2 Copper Scrap Market Size & Forecast, By Product, 2021 – 2032
9.5.3 Copper Scrap Market Size & Forecast, By End Use, 2021 – 2032
9.5.4 Copper Scrap Market Size & Forecast, By Material Type, 2021 – 2032
9.5.5 Copper Scrap Market Size & Forecast, By Function/Performance, 2021 – 2032
9.5.6 Copper Scrap Market Size & Forecast, By Country, 2021 – 2032
9.5.6.1 Brazil
9.5.6.1.1 Copper Scrap Market Size & Forecast, By Product, 2021 – 2032
9.5.6.1.2 Copper Scrap Market Size & Forecast, By End Use, 2021 – 2032
9.5.6.1.3 Copper Scrap Market Size & Forecast, By Material Type, 2021 – 2032
9.5.6.1.4 Copper Scrap Market Size & Forecast, By Function/Performance, 2021 – 2032
9.5.6.2 Argentina
9.5.6.2.1 Copper Scrap Market Size & Forecast, By Product, 2021 – 2032
9.5.6.2.2 Copper Scrap Market Size & Forecast, By End Use, 2021 – 2032
9.5.6.2.3 Copper Scrap Market Size & Forecast, By Material Type, 2021 – 2032
9.5.6.2.4 Copper Scrap Market Size & Forecast, By Function/Performance, 2021 – 2032
9.5.6.3 Mexico
9.5.6.3.1 Copper Scrap Market Size & Forecast, By Product, 2021 – 2032
9.5.6.3.2 Copper Scrap Market Size & Forecast, By End Use, 2021 – 2032
9.5.6.3.3 Copper Scrap Market Size & Forecast, By Material Type, 2021 – 2032
9.5.6.3.4 Copper Scrap Market Size & Forecast, By Function/Performance, 2021 – 2032
9.5.6.4 Colombia
9.5.6.4.1 Copper Scrap Market Size & Forecast, By Product, 2021 – 2032
9.5.6.4.2 Copper Scrap Market Size & Forecast, By End Use, 2021 – 2032
9.5.6.4.3 Copper Scrap Market Size & Forecast, By Material Type, 2021 – 2032
9.5.6.4.4 Copper Scrap Market Size & Forecast, By Function/Performance, 2021 – 2032
9.5.6.5 Rest of Latin America
9.5.6.5.1 Copper Scrap Market Size & Forecast, By Product, 2021 – 2032
9.5.6.5.2 Copper Scrap Market Size & Forecast, By End Use, 2021 – 2032
9.5.6.5.3 Copper Scrap Market Size & Forecast, By Material Type, 2021 – 2032
9.5.6.5.4 Copper Scrap Market Size & Forecast, By Function/Performance, 2021 – 2032
9.6 Middle East & Africa
9.6.1 Key Trends
9.6.2 Copper Scrap Market Size & Forecast, By Product, 2021 – 2032
9.6.3 Copper Scrap Market Size & Forecast, By End Use, 2021 – 2032
9.6.4 Copper Scrap Market Size & Forecast, By Material Type, 2021 – 2032
9.6.5 Copper Scrap Market Size & Forecast, By Function/Performance, 2021 – 2032
9.6.6 Copper Scrap Market Size & Forecast, By Country, 2021 – 2032
9.6.6.1 UAE
9.6.6.1.1 Copper Scrap Market Size & Forecast, By Product, 2021 – 2032
9.6.6.1.2 Copper Scrap Market Size & Forecast, By End Use, 2021 – 2032
9.6.6.1.3 Copper Scrap Market Size & Forecast, By Material Type, 2021 – 2032
9.6.6.1.4 Copper Scrap Market Size & Forecast, By Function/Performance, 2021 – 2032
9.6.6.2 Saudi Arabia
9.6.6.2.1 Copper Scrap Market Size & Forecast, By Product, 2021 – 2032
9.6.6.2.2 Copper Scrap Market Size & Forecast, By End Use, 2021 – 2032
9.6.6.2.3 Copper Scrap Market Size & Forecast, By Material Type, 2021 – 2032
9.6.6.2.4 Copper Scrap Market Size & Forecast, By Function/Performance, 2021 – 2032
9.6.6.3 Qatar
9.6.6.3.1 Copper Scrap Market Size & Forecast, By Product, 2021 – 2032
9.6.6.3.2 Copper Scrap Market Size & Forecast, By End Use, 2021 – 2032
9.6.6.3.3 Copper Scrap Market Size & Forecast, By Material Type, 2021 – 2032
9.6.6.3.4 Copper Scrap Market Size & Forecast, By Function/Performance, 2021 – 2032
9.6.6.4 Egypt
9.6.6.4.1 Copper Scrap Market Size & Forecast, By Product, 2021 – 2032
9.6.6.4.2 Copper Scrap Market Size & Forecast, By End Use, 2021 – 2032
9.6.6.4.3 Copper Scrap Market Size & Forecast, By Material Type, 2021 – 2032
9.6.6.4.4 Copper Scrap Market Size & Forecast, By Function/Performance, 2021 – 2032
9.6.6.5 South Africa
9.6.6.5.1 Copper Scrap Market Size & Forecast, By Product, 2021 – 2032
9.6.6.5.2 Copper Scrap Market Size & Forecast, By End Use, 2021 – 2032
9.6.6.5.3 Copper Scrap Market Size & Forecast, By Material Type, 2021 – 2032
9.6.6.5.4 Copper Scrap Market Size & Forecast, By Function/Performance, 2021 – 2032
9.6.6.6 Rest of Middle East & Africa
9.6.6.6.1 Copper Scrap Market Size & Forecast, By Product, 2021 – 2032
9.6.6.6.2 Copper Scrap Market Size & Forecast, By End Use, 2021 – 2032
9.6.6.6.3 Copper Scrap Market Size & Forecast, By Material Type, 2021 – 2032
9.6.6.6.4 Copper Scrap Market Size & Forecast, By Function/Performance, 2021 – 2032
10. Competitive Landscape
10.1 Key Players' Positioning
10.2 Competitive Developments
10.2.1 Key Strategies Adopted (%), By Key Players, 2024
10.2.2 Year-Wise Strategies & Development, 2021 – 2025
10.2.3 Number of Strategies Adopted by Key Players, 2024
10.3 Market Share Analysis, 2024
10.4 Product/Service & End-Use Industry Benchmarking
10.4.1 Product/Service Specifications & Features By Key Players
10.4.2 Product/Service Heatmap By Key Players
10.4.3 End-Use Industry Heatmap By Key Players
10.5 Industry Start-Up & Innovation Landscape
10.6 Key Company Profiles
10.6.1 Saint-Gobain
10.6.1.1 Company Overview & Snapshot
10.6.1.2 Product/Service Portfolio
10.6.1.3 Key Company Financials
10.6.1.4 SWOT Analysis
10.6.2 Owens Corning
10.6.2.1 Company Overview & Snapshot
10.6.2.2 Product/Service Portfolio
10.6.2.3 Key Company Financials
10.6.2.4 SWOT Analysis
10.6.3 Kingspan Group
10.6.3.1 Company Overview & Snapshot
10.6.3.2 Product/Service Portfolio
10.6.3.3 Key Company Financials
10.6.3.4 SWOT Analysis
10.6.4 Rockwool International
10.6.4.1 Company Overview & Snapshot
10.6.4.2 Product/Service Portfolio
10.6.4.3 Key Company Financials
10.6.4.4 SWOT Analysis
10.6.5 BASF SE
10.6.5.1 Company Overview & Snapshot
10.6.5.2 Product/Service Portfolio
10.6.5.3 Key Company Financials
10.6.5.4 SWOT Analysis
10.6.6 DuPont de Nemours
10.6.6.1 Company Overview & Snapshot
10.6.6.2 Product/Service Portfolio
10.6.6.3 Key Company Financials
10.6.6.4 SWOT Analysis
10.6.7 GAF Materials Corporation
10.6.7.1 Company Overview & Snapshot
10.6.7.2 Product/Service Portfolio
10.6.7.3 Key Company Financials
10.6.7.4 SWOT Analysis
10.6.8 Sika AG
10.6.8.1 Company Overview & Snapshot
10.6.8.2 Product/Service Portfolio
10.6.8.3 Key Company Financials
10.6.8.4 SWOT Analysis
10.6.9 Etex Corp
10.6.9.1 Company Overview & Snapshot
10.6.9.2 Product/Service Portfolio
10.6.9.3 Key Company Financials
10.6.9.4 SWOT Analysis
10.6.10 3M Company
10.6.10.1 Company Overview & Snapshot
10.6.10.2 Product/Service Portfolio
10.6.10.3 Key Company Financials
10.6.10.4 SWOT Analysis
10.6.11 Knauf Insulation
10.6.11.1 Company Overview & Snapshot
10.6.11.2 Product/Service Portfolio
10.6.11.3 Key Company Financials
10.6.11.4 SWOT Analysis
10.6.12 Yuanda China
10.6.12.1 Company Overview & Snapshot
10.6.12.2 Product/Service Portfolio
10.6.12.3 Key Company Financials
10.6.12.4 SWOT Analysis
10.6.13 Dow Chemical Company
10.6.13.1 Company Overview & Snapshot
10.6.13.2 Product/Service Portfolio
10.6.13.3 Key Company Financials
10.6.13.4 SWOT Analysis
10.6.14 Henkel AG
10.6.14.1 Company Overview & Snapshot
10.6.14.2 Product/Service Portfolio
10.6.14.3 Key Company Financials
10.6.14.4 SWOT Analysis
10.6.15 H.B. Fuller
10.6.15.1 Company Overview & Snapshot
10.6.15.2 Product/Service Portfolio
10.6.15.3 Key Company Financials
10.6.15.4 SWOT Analysis
10.6.16 National Gypsum
10.6.16.1 Company Overview & Snapshot
10.6.16.2 Product/Service Portfolio
10.6.16.3 Key Company Financials
10.6.16.4 SWOT Analysis
10.6.17 Johns Manville
10.6.17.1 Company Overview & Snapshot
10.6.17.2 Product/Service Portfolio
10.6.17.3 Key Company Financials
10.6.17.4 SWOT Analysis
10.6.18 DOW CORNING
10.6.18.1 Company Overview & Snapshot
10.6.18.2 Product/Service Portfolio
10.6.18.3 Key Company Financials
10.6.18.4 SWOT Analysis
10.6.19 Huntsman Corporation
10.6.19.1 Company Overview & Snapshot
10.6.19.2 Product/Service Portfolio
10.6.19.3 Key Company Financials
10.6.19.4 SWOT Analysis
10.6.20 Bostik (Arkema)
10.6.20.1 Company Overview & Snapshot
10.6.20.2 Product/Service Portfolio
10.6.20.3 Key Company Financials
10.6.20.4 SWOT Analysis
11. Analyst Recommendations
11.1 SNS Insider Opportunity Map
11.2 Industry Low-Hanging Fruit Assessment
11.3 Market Entry & Growth Strategy
11.4 Analyst Viewpoint & Suggestions On Market Growth
12. Assumptions
13. Disclaimer
14. Appendix
14.1 List Of Tables
14.2 List Of Figures
Key Segments:
By Product
-
Walls & Cladding Systems
-
Roofs
-
Windows & Doors
-
Others
By End Use
-
Residential
-
Commercial
-
Industrial
By Material Type
-
Metal
-
Glass
-
Concrete
-
Wood
-
Composites
-
Others
By Function/Performance
-
Thermal Insulation Systems
-
Acoustic Insulation Systems
-
Weatherproofing & Waterproofing
-
Fire-Resistant Systems
-
Structural Support Systems
Request for Segment Customization as per your Business Requirement: Segment Customization Request
Regional Coverage:
North America
-
US
-
Canada
-
Mexico
Europe
-
Germany
-
France
-
UK
-
Italy
-
Spain
-
Poland
-
Turkey
-
Rest of Europe
Asia Pacific
-
China
-
India
-
Japan
-
South Korea
-
Singapore
-
Australia
-
Rest of Asia Pacific
Middle East & Africa
-
UAE
-
Saudi Arabia
-
Qatar
-
South Africa
-
Rest of Middle East & Africa
Latin America
-
Brazil
-
Argentina
-
Rest of Latin America
Request for Country Level Research Report: Country Level Customization Request
Available Customization
With the given market data, SNS Insider offers customization as per the company’s specific needs. The following customization options are available for the report:
-
Detailed Volume Analysis
-
Criss-Cross segment analysis (e.g. Product X Application)
-
Competitive Product Benchmarking
-
Geographic Analysis
-
Additional countries in any of the regions
-
Customized Data Representation
-
Detailed analysis and profiling of additional market players
An accurate research report requires proper strategizing as well as implementation. There are multiple factors involved in the completion of good and accurate research report and selecting the best methodology to compete the research is the toughest part. Since the research reports we provide play a crucial role in any company’s decision-making process, therefore we at SNS Insider always believe that we should choose the best method which gives us results closer to reality. This allows us to reach at a stage wherein we can provide our clients best and accurate investment to output ratio.
Each report that we prepare takes a timeframe of 350-400 business hours for production. Starting from the selection of titles through a couple of in-depth brain storming session to the final QC process before uploading our titles on our website we dedicate around 350 working hours. The titles are selected based on their current market cap and the foreseen CAGR and growth.
The 5 steps process:
Step 1: Secondary Research:
Secondary Research or Desk Research is as the name suggests is a research process wherein, we collect data through the readily available information. In this process we use various paid and unpaid databases which our team has access to and gather data through the same. This includes examining of listed companies’ annual reports, Journals, SEC filling etc. Apart from this our team has access to various associations across the globe across different industries. Lastly, we have exchange relationships with various university as well as individual libraries.

Step 2: Primary Research
When we talk about primary research, it is a type of study in which the researchers collect relevant data samples directly, rather than relying on previously collected data. This type of research is focused on gaining content specific facts that can be sued to solve specific problems. Since the collected data is fresh and first hand therefore it makes the study more accurate and genuine.
We at SNS Insider have divided Primary Research into 2 parts.
Part 1 wherein we interview the KOLs of major players as well as the upcoming ones across various geographic regions. This allows us to have their view over the market scenario and acts as an important tool to come closer to the accurate market numbers. As many as 45 paid and unpaid primary interviews are taken from both the demand and supply side of the industry to make sure we land at an accurate judgement and analysis of the market.
This step involves the triangulation of data wherein our team analyses the interview transcripts, online survey responses and observation of on filed participants. The below mentioned chart should give a better understanding of the part 1 of the primary interview.

Part 2: In this part of primary research the data collected via secondary research and the part 1 of the primary research is validated with the interviews from individual consultants and subject matter experts.
Consultants are those set of people who have at least 12 years of experience and expertise within the industry whereas Subject Matter Experts are those with at least 15 years of experience behind their back within the same space. The data with the help of two main processes i.e., FGDs (Focused Group Discussions) and IDs (Individual Discussions). This gives us a 3rd party nonbiased primary view of the market scenario making it a more dependable one while collation of the data pointers.
Step 3: Data Bank Validation
Once all the information is collected via primary and secondary sources, we run that information for data validation. At our intelligence centre our research heads track a lot of information related to the market which includes the quarterly reports, the daily stock prices, and other relevant information. Our data bank server gets updated every fortnight and that is how the information which we collected using our primary and secondary information is revalidated in real time.

Step 4: QA/QC Process
After all the data collection and validation our team does a final level of quality check and quality assurance to get rid of any unwanted or undesired mistakes. This might include but not limited to getting rid of the any typos, duplication of numbers or missing of any important information. The people involved in this process include technical content writers, research heads and graphics people. Once this process is completed the title gets uploader on our platform for our clients to read it.
Step 5: Final QC/QA Process:
This is the last process and comes when the client has ordered the study. In this process a final QA/QC is done before the study is emailed to the client. Since we believe in giving our clients a good experience of our research studies, therefore, to make sure that we do not lack at our end in any way humanly possible we do a final round of quality check and then dispatch the study to the client.