Application Performance Monitoring Market Report Scope & Overview:
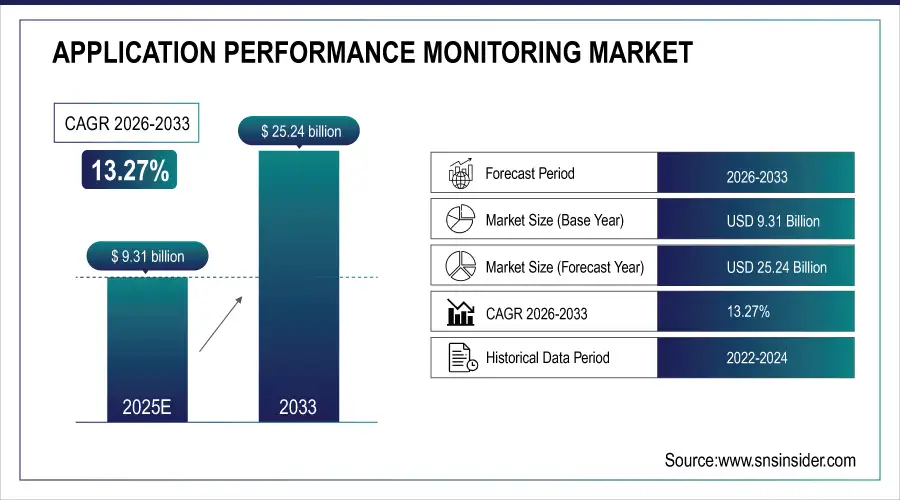
The Application Performance Monitoring Market was valued at USD 9.31 Billion in 2025E and is expected to reach USD 25.24 Billion by 2033, growing at a CAGR of 13.27% over the forecast period 2026-2033.
The Application Performance Monitoring market focuses on tools and platforms that help organizations track, analyze, and optimize the performance of software applications. Driven by digital transformation and rising complexity in cloud-native environments, APM solutions provide real-time insights into user experience, infrastructure, and application behavior. Growing adoption of microservices, DevOps practices, and AI-powered analytics continues to accelerate demand, as businesses seek to ensure reliability, reduce downtime, and enhance operational efficiency across diverse, distributed systems.
Application Performance Monitoring Market Size and Forecast
-
Market Size in 2025E: USD 9.31 Billion
-
Market Size by 2033: USD 25.24 Billion
-
CAGR: 13.27% from 2026 to 2033
-
Base Year: 2025E
-
Forecast Period: 2026–2033
-
Historical Data: 2022–2024
To Get More Information on Application Performance Monitoring Market- Request Sample Report
Application Performance Monitoring Market Trends
-
Rising need to ensure seamless application uptime and performance in digital-first environments is driving the Application Performance Monitoring (APM) market.
-
Growing adoption of cloud-native, microservices, and containerized architectures is boosting demand for advanced monitoring platforms.
-
Expansion of AI-driven observability, anomaly detection, and root-cause analysis tools is enhancing operational efficiency.
-
Increasing complexity of hybrid and multi-cloud ecosystems is fueling reliance on unified APM solutions.
-
Focus on improving user experience, reducing downtime, and optimizing resource utilization is shaping market growth.
-
Rising cybersecurity concerns and performance issues linked to distributed applications are influencing technology enhancements.
-
Partnerships among APM vendors, cloud providers, and DevOps teams are accelerating innovation and market penetration.

Application Performance Monitoring Market Growth Drivers:
-
Growing need for real-time application visibility to support seamless digital experiences and maintain consistent performance across complex distributed technology environments
Growing need for real-time visibility across modern, distributed applications is accelerating the adoption of advanced Application Performance Monitoring solutions. As digital platforms expand, organizations rely heavily on microservices, APIs, and cloud-native architectures, which introduce greater operational complexity. Continuous monitoring becomes essential to detect anomalies, optimize resource utilization, and ensure flawless user experiences. APM tools enable granular insights into performance bottlenecks, dependencies, and latency issues, allowing teams to resolve problems before they impact users. With rising expectations for speed and reliability, businesses increasingly prioritize proactive monitoring as a foundation for maintaining competitiveness and operational efficiency in the digital era.
Application Performance Monitoring Market Restraints:
-
Complexity of modern IT environments creating deployment challenges and increasing resistance toward adopting full-scale monitoring solutions
Complexity of modern IT environments creates deployment challenges and increases hesitation toward full-scale APM adoption. As enterprises operate hybrid architectures, multi-cloud systems, and containerized applications, integrating monitoring across all layers becomes technically demanding. Many organizations face difficulty mapping dependencies, configuring data collection, and managing high volumes of telemetry data. Limited availability of skilled professionals further complicates implementation. This complexity results in extended deployment timelines, higher maintenance efforts, and uncertainty in achieving expected outcomes. Consequently, businesses may rely on partial monitoring practices instead of holistic solutions, hindering the market’s overall growth potential.
Application Performance Monitoring Market Opportunities:
-
Increasing adoption of AI-driven analytics and automation creating new opportunities for intelligent performance optimization and predictive monitoring capabilities worldwide
Increasing adoption of AI-driven analytics and automation creates significant opportunities for transforming APM into proactive and predictive performance management solutions. AI models help detect anomalies automatically, forecast potential failures, and prioritize remediation steps based on impact. This shift enhances operational efficiency while reducing reliance on manual monitoring. Automated root-cause analysis accelerates troubleshooting and improves system reliability. As businesses generate massive performance datasets, leveraging AI becomes essential to derive meaningful insights. Vendors are increasingly embedding machine learning, autonomous diagnostics, and automated remediation, positioning AI-enhanced APM as a high-growth opportunity across enterprise IT ecosystems.
Application Performance Monitoring Market Segmentation
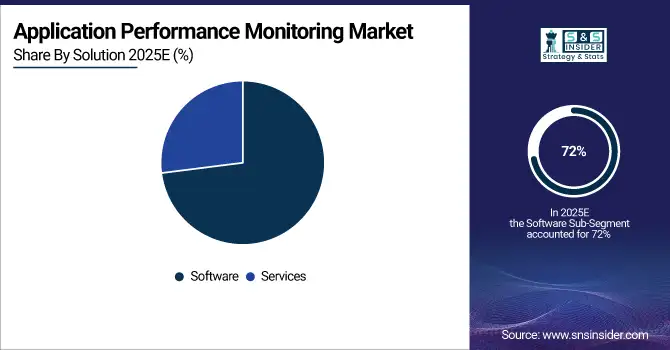
By Solution, Software segment dominated the Market, while Services are expected to grow at the fastest CAGR
The software segment led the application performance monitoring market, with 72% market share in 2025. This segment includes tools and platforms that are designed to monitor, detect, and resolve performance issues in applications. Software solutions offer detailed analytics, automated alerts, and tracking of user behavior, allowing businesses to maintain optimal application functionality. Major companies in this segment include Dynatrace, AppDynamics, and New Relic, catering to industries like e-commerce, financial services, and IT operations. For instance, retail companies use AppDynamics to monitor user engagement and improve website performance during busy shopping periods.
The services segment is anticipated to become the fastest-growing segment in the application performance monitoring market during 2026-2033, driven by the growing complexity of modern IT infrastructures. These services add value to software by ensuring smooth deployment, configuration, and ongoing optimization. For example, IBM Services helps financial institutions integrate APM tools with their IT systems to ensure compliance and minimize downtime. Similarly, Accenture provides consulting and managed services to improve performance in healthcare IT systems. As organizations focus on digital transformation and reliable applications, the services segment is growing rapidly, complementing the software solutions in the APM ecosystem.
By Deployment, On-Premise segment led the Market, with Cloud expected to grow at the fastest CAGR
The on-premise segment led the market in 2025 with a 58% market share, due to its strong security, control, and compliance features. Organizations, especially those in sectors like finance, healthcare, and government, prefer on-premise solutions because they can maintain full control over their data, which is essential for meeting regulatory requirements and ensuring privacy. For example, banks use on-premise APM tools to monitor and secure their transaction systems, hospitals deploy them for managing electronic health record (EHR) systems, and government agencies rely on them for tracking secure communication platforms.
The cloud segment is going to be the fastest-growing in the APM market during 2026-2033, driven by scalability, cost-effectiveness, and real-time monitoring capabilities. As organizations move to hybrid and cloud-native environments, the demand for cloud-based APM solutions has increased. Cloud APM offers a pay-as-you-go model, eliminating the need for heavy infrastructure investment and enabling quick deployment and global monitoring of applications. For example, e-commerce platforms use cloud APM to monitor website performance during peak traffic periods, SaaS providers utilize it for consistent service availability across regions and media streaming companies depend on it for real-time monitoring of video delivery systems to maintain seamless user experiences.
Regional Analysis
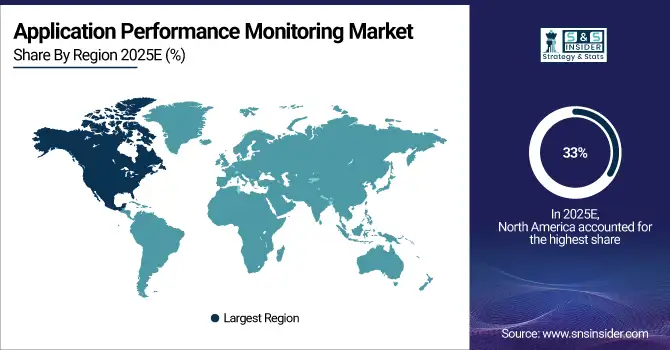
North America Application Performance Monitoring Market Insights
In 2025, North America dominated with a 33% market share in the application performance monitoring market. This dominance can be attributed to the widespread use of cloud computing, DevOps practices, and digital transformation across various industries such as IT, healthcare, and finance. Key companies like Dynatrace, New Relic, and AppDynamics play a significant role in this region by providing solutions to monitor and improve the performance of essential business applications.
Do You Need any Customization Research on Application Performance Monitoring Market - Enquire Now
Asia Pacific Application Performance Monitoring Market Insights
APAC is projected to become the fastest-growing region in the APM market during 2026-2033. Industries like e-commerce, telecommunications, and manufacturing are increasingly implementing APM solutions to enhance digital services and customer satisfaction. Companies like Huawei, Alibaba Cloud, and Infosys are utilizing APM tools to optimize application performance in the region.
Europe Application Performance Monitoring Market Insights
The Europe Application Performance Monitoring Market is expanding as enterprises accelerate digital transformation and adopt cloud-native applications, microservices, and hybrid IT infrastructures. Rising demand for real-time visibility, improved end-user experience, and proactive issue resolution is strengthening adoption across finance, retail, manufacturing, and telecom. Growing regulatory emphasis on service reliability and data integrity further boosts APM integration.
Middle East & Africa and Latin America Application Performance Monitoring Market Insights
The Middle East & Africa and Latin America Application Performance Monitoring Market is gaining traction as organizations increase cloud adoption, modernize IT infrastructure, and expand digital services across banking, telecom, retail, and government sectors. Rising demand for application reliability, faster troubleshooting, and improved customer experience accelerates APM deployment.
Application Performance Monitoring Market Competitive Landscape:
New Relic
New Relic is a leading observability and application performance monitoring (APM) provider, delivering end-to-end visibility across cloud, on-premise, and hybrid environments. Its platform integrates real-user monitoring, APM, session replay, and AI-driven analytics, helping organizations optimize application performance, troubleshoot issues faster, and enhance user experience. New Relic emphasizes full-stack observability and innovation, supporting enterprises in digital transformation and ensuring resilient, high-performing applications.
-
2024: New Relic launched a fully integrated, AI-driven Digital Experience Monitoring (DEM) solution — combining real-user monitoring, mobile & web, APM 360, session replay, and AI monitoring for end-to-end visibility across application stacks.
-
2024: Recognized as a Leader in the 2024 Gartner Magic Quadrant for Digital Experience Monitoring, reflecting its strong APM + observability capabilities and innovation in DEM.
Cisco AppDynamics
Cisco AppDynamics provides enterprise-grade application performance monitoring and observability solutions, enabling full-stack visibility for complex, distributed environments. Its platform helps organizations detect anomalies, optimize performance, and streamline operations across cloud-native, hybrid, and on-premise applications. AppDynamics focuses on intelligent instrumentation, automation, and AI-driven monitoring, allowing IT teams to proactively prevent issues, maintain service reliability, and enhance end-user experience across mission-critical business applications.
-
2024: Cisco released Smart Agent for AppDynamics to simplify distributed-application instrumentation and agent lifecycle management, making full-stack observability easier to deploy across applications and infrastructures.
Datadog
Datadog is a cloud monitoring and observability leader, providing unified visibility across logs, metrics, traces, and applications for modern IT environments. Its platform integrates AI-driven agents, machine learning insights, and telemetry for cloud-native, hybrid, and ML workloads. Datadog empowers DevOps and IT teams to detect anomalies, optimize application performance, and accelerate incident response, supporting organizations in achieving high reliability, operational efficiency, and end-user satisfaction at scale.
-
2025: At DASH 2025, Datadog launched new AI-powered Bits AI agents and enhanced APM/observability stack, including LLM observability, AI-agent monitoring, and integrated telemetry across logs, traces, and metrics.
-
2025: Named a Leader in the 2025 Gartner Magic Quadrant for Digital Experience Monitoring, reflecting its strong ability to execute and comprehensive APM/observability suite.
Splunk
Splunk provides data-to-everything observability, analytics, and monitoring solutions, helping organizations gain insights from machine data to improve performance, security, and operational efficiency. Its platform supports cloud-native, hybrid, and enterprise workloads, enabling IT, DevOps, and business teams to analyze logs, metrics, and traces in real time. Splunk emphasizes AI-driven observability, operational resilience, and strategic insights to optimize applications, enhance customer experience, and drive digital transformation.
-
2025: Announced enhancements in Splunk Observability Cloud (APM + observability) to strengthen monitoring capabilities for cloud-native and hybrid applications.
Key Players
The major key players in the Application Performance Monitoring Market are:
-
IBM (IBM Instana, IBM APM)
-
New Relic (New Relic One, New Relic Browser)
-
Dynatrace (Dynatrace Full-Stack Monitoring, Dynatrace Application Security)
-
AppDynamics (AppDynamics APM, AppDynamics Database Monitoring)
-
Cisco (Cisco AppDynamics, Cisco ACI Analytics)
-
Splunk Inc. (Splunk Observability Cloud, Splunk IT Service Intelligence)
-
Micro Focus (Silk Central, LoadRunner)
-
Broadcom Inc. (CA APM, CA Application Delivery Analysis)
-
Elastic Search B.V. (Elastic APM, Elastic Stack)
-
Datadog (Datadog APM, Datadog Real User Monitoring)
-
Riverbed Technology (SteelCentral APM, SteelHead)
-
SolarWinds (SolarWinds APM, SolarWinds Network Performance Monitor)
-
Oracle (Oracle Management Cloud, Oracle Cloud Infrastructure APM)
-
ServiceNow (ServiceNow APM, ServiceNow Performance Analytics)
-
Red Hat (Red Hat OpenShift Monitoring, Red Hat Insights)
-
AppOptics (AppOptics APM, AppOptics Infrastructure Monitoring)
-
Honeycomb (Honeycomb APM, Honeycomb Distributed Tracing)
-
Instana (Instana APM, Instana Real User Monitoring)
-
Scout APM (Scout APM, Scout Error Tracking)
-
Sentry (Sentry APM, Sentry Error Tracking)
| Report Attributes | Details |
|---|---|
| Market Size in 2025E | USD 9.31 Billion |
| Market Size by 2033 | USD 25.24 Billion |
| CAGR | CAGR of 13.27% From 2026 to 2033 |
| Base Year | 2025E |
| Forecast Period | 2026-2033 |
| Historical Data | 2022-2024 |
| Report Scope & Coverage | Market Size, Segments Analysis, Competitive Landscape, Regional Analysis, DROC & SWOT Analysis, Forecast Outlook |
| Key Segments | • By Solution (Software, Services) • By Deployment (Cloud, On-Premise) • By Enterprise Size (SMEs, Large Enterprises) • By Access Type (Web APM, Mobile APM) • By End User (BFSI, E-Commerce, Manufacturing, Healthcare, Retail, IT and Telecommunications, Media and Entertainment, Academics, Government, Others) |
| Regional Analysis/Coverage | North America (US, Canada, Mexico), Europe (Eastern Europe [Poland, Romania, Hungary, Turkey, Rest of Eastern Europe] Western Europe] Germany, France, UK, Italy, Spain, Netherlands, Switzerland, Austria, Rest of Western Europe]), Asia Pacific (China, India, Japan, South Korea, Vietnam, Singapore, Australia, Rest of Asia Pacific), Middle East & Africa (Middle East [UAE, Egypt, Saudi Arabia, Qatar, Rest of Middle East], Africa [Nigeria, South Africa, Rest of Africa], Latin America (Brazil, Argentina, Colombia, Rest of Latin America) |
| Company Profiles | IBM, New Relic, Dynatrace, AppDynamics, Cisco, Splunk Inc., Micro Focus, Broadcom Inc., Elastic Search B.V., Data Dog, Riverbed Technology, SolarWinds, Oracle, ServiceNow, Red Hat, AppOptics, Honeycomb, Instana, Scout APM, Sentry |
Frequently Asked Questions
The Application Performance Monitoring Market is expected to grow at a CAGR of 13.27% during 2026–2033, driven by rising digital transformation and cloud adoption.
The Application Performance Monitoring Market was valued at USD 9.31 Billion in 2025, reflecting increasing demand for real-time application visibility and performance monitoring solutions.
Growing adoption of cloud-native, microservices, and AI-driven analytics for real-time monitoring and improved application performance is the primary growth factor.
The Software segment dominated the Application Performance Monitoring Market, while Cloud deployment is expected to grow at the fastest CAGR during the forecast period.
North America dominated the market in 2025, holding the largest share due to advanced IT infrastructure and widespread adoption of APM solutions.
Get in Touch
