Atomic Spectroscopy Market Size Analysis:
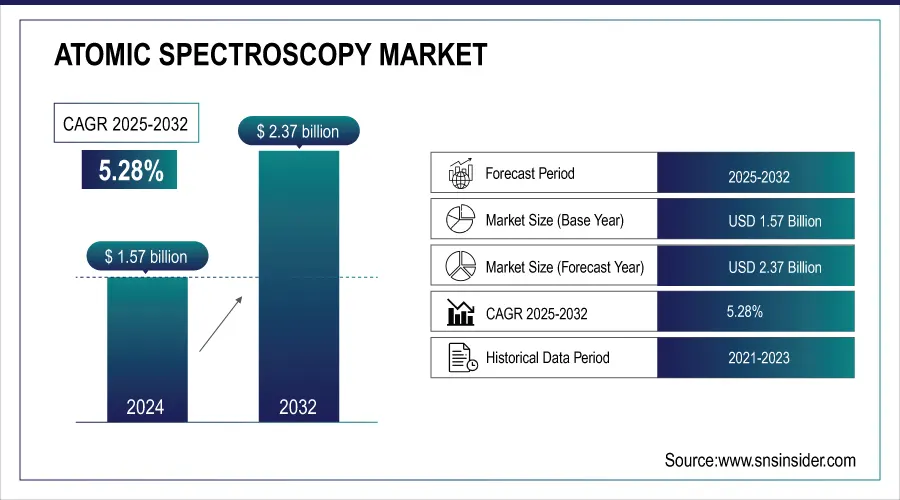
The Atomic Spectroscopy Market size was valued at USD 1.65 Billion in 2025E and is projected to reach USD 2.49 Billion by 2033, growing at a CAGR of 5.28% during 2026-2033.
To Get more information on Atomic Spectroscopy Market - Request Free Sample Report
The Atomic Spectroscopy market is experiencing steady growth owing to its essential use in detection and quantification of trace metals in a variety of industries, including environmental testing, pharmaceuticals & chemicals, food safety, and nuclear energy. This is further bolstered with the increasing focus toward precision analysis, regulatory compliance and rapid identification of toxic and heavy metals, which is anticipated to keep AAS a preferred choice for accurate elemental analysis. New ideas like the usage of laser-induced plasma on uranium enrichment detection clearly indicate the importance of novel spectroscopic methods in nuclear applications. With increased global interest in energy stability, pollution prevention and industrial security, demand for cost-efficient, reliable and accurate metal analysis tools is on the upswing, and AAS continues to play a leading role in modern analytical instrumentation markets.
July 2025 – Researchers from Oregon State University have successfully developed laser-plasma technology that could detect rapidly uranium enrichment directly on the spot. Assists in monitoring nuclear nonproliferation and Gen-IV reactors.
Market Size and Forecast: 2025E
-
Market Size in 2025E USD 1.65 Billion
-
Market Size by 2033 USD 2.49 Billion
-
CAGR of 5.28% From 2026 to 2033
-
Base Year 2025E
-
Forecast Period 2026-2033
-
Historical Data 2021-2024
Atomic Spectroscopy Market Trends:
-
Adoption of advanced background correction techniques such as Zeeman effect and High-Resolution Continuum Source (HR-CS) correction for improved detection accuracy.
-
Rising demand for high-precision, multi-element analysis in complex sample matrices across pharmaceuticals, environmental monitoring, and materials testing.
-
Integration of molecular-level and atomic-scale spectroscopy for trace-level detection and enhanced material characterization.
-
Expansion of AAS applications into hydrogen storage, catalytic surface analysis, and quantum sensing.
-
Increasing convergence of nanotechnology and atomic spectroscopy driving innovation in next-generation research and industrial sectors.
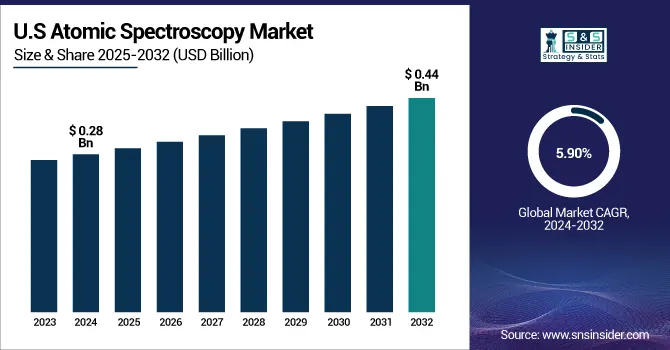
The U.S Atomic Spectroscopy Market size was valued at USD 0.28 Billion in 2025E and is projected to reach USD 0.44 Billion by 2033, growing at a CAGR of 5.90% during 2026-2033. Atomic Spectroscopy Market growth driven by the rapid demand for accuracy in metal assessment, AAS is widely used in diverse segments ranging from pharmaceuticals, food safety to environmental and nuclear energy. Furthermore, installation of new and enhanced AAS instrumentation, growing regulatory compliance, and increasing demand for on-site and real-time elemental detection are increasing the uptake of AAS technology across laboratories and research facilities.
The Atomic Spectroscopy market key trend includes automated and sophisticated software incorporation for more precision, functionality, and real-time data analysis. There has also been a recent trend towards miniaturization of AAS systems to expand the feasibility for on-site testing in environmental and industrial applications. In addition, growing emphasis on the detection of trace metal in pharmaceuticals, food, and water and increasing applications in nuclear energy and materials investigation are also driving innovation and broadening the scope of AAS technology worldwide.
Atomic Spectroscopy Market Growth Drivers:
-
Advanced Background Correction Techniques Fuel Precision Demand in the Atomic Spectroscopy Market
Increase in need for high-level of analytic accuracy is promoting the use of novel background correction methods in the Atomic Spectroscopy (AAS) market. Recent advancements in Zeeman effect correction and High-Resolution Continuum Source (HR-CS) correction technologies allow for the reliable detection of minor or minor-constituent elements in complicated and interference-laden sample matrices. The data are enhanced for sensitivity and allow for multi-element applications including non-metal detection. Coupling these advanced techniques is emerging to be a major driver that is propelling modern AAS instrumentation -- due the demand for greater precision and speed by industries such as pharmaceuticals, environmental monitoring and materials testing.
July 2025 – A new eBook from Analytik Jena US discusses innovations in Atomic Spectroscopy including Zeeman and HR-CS background correction methods. The guide highlights advanced AAS systems such as the ZEEnit® and contrAA® for improved detection accuracy and simultaneous multi-elemental analysis.
Atomic Spectroscopy Market Restraints:
-
High Equipment Costs and Operational Complexity Restrain Adoption in the Atomic Spectroscopy Market
Atomic Spectroscopy (AAS) market demonstrates analytical precision but has restraints due to high cost of advanced instruments and operational complexity. Sophisticated AAS systems, in particular, those fitted with Zeeman or HR-CS correction, are capable of providing excellent sensitivity but require a large capital investment that does not make them accessible to small laboratories and institutions with limited budgets. In addition, the requirement for trained technicians to use and maintain these instruments limits their widespread use even more. Combined, these factors slow down market penetration, particularly in emerging parts of the world, and cost-sensitive market segments.
Atomic Spectroscopy Market Opportunities:
-
Advancements in Molecular-Level Spectroscopy Propel Opportunities in the Atomic Spectroscopy Market
The growing capabilities of molecular-level spectroscopy, as demonstrated by the recent observation of hydrogen and deuterium in atomic-scale picocavities, are opening new opportunities in the Atomic Spectroscopy (AAS) market. As precision at the single-molecule level becomes increasingly important for applications such as hydrogen storage, catalytic surface analysis, and quantum sensing, the demand for highly sensitive and accurate elemental analysis tools is rising. AAS stands to benefit by evolving alongside these advanced spectroscopic techniques, enabling trace-level detection and improved material characterization. This convergence of nanotechnology and atomic-scale spectroscopy creates significant opportunities for AAS in next-generation research, energy materials development, and quantum applications, expanding its relevance across high-growth scientific and industrial sectors.
May 2025 – Researchers achieved the first single-molecule spectroscopy of hydrogen and deuterium in atomic-scale picocavities, revealing isotope-dependent vibrational effects. This breakthrough advances hydrogen storage analysis and quantum photonic technologies.
Atomic Spectroscopy Market Segment Analysis:
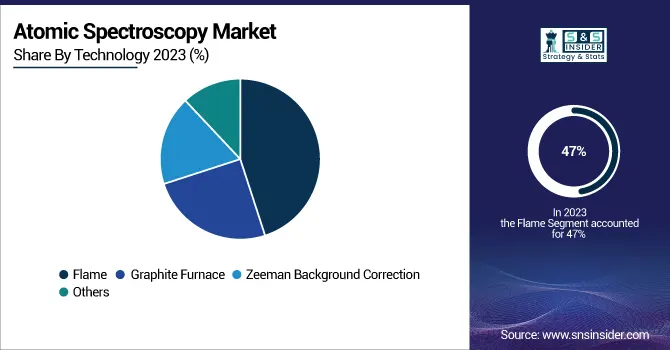
By Technology
In 2025E, the Flame segment accounted for approximately 47% of the Atomic Spectroscopy Market share, owing to its low cost, ease of use, and ability to perform routine elemental analysis. Flame AAS systems provide reliable, repeatable results and are extensively utilized for environmental testing, agricultural analysis, and academic research to identify metals from liquid samples. Due to their reduced operating costs and quicker analysis times, they are often a go-to option for labs with moderate throughput requirements. Zeeman Background segment in the speediest inclination of growth Atomic Spectroscopy Market over 2026-2033, receiving 8.58% in the growth in Zeeman Background Correction segment driven by high demand for accurate element tracing as a result of matrix interference effect when high solubility ion generating companies are involved. Zeeman correction is ideal for pharmaceutical, environmental, and food applications where detection limits are low and regulatory compliance is necessary, which improves analytical certainty by effectively removing background noise.
By Application
In 2025E, the Environmental Analysis segment accounted for approximately 35% of the Atomic Spectroscopy Market share, This dominance is driven by stringent environmental regulations and the growing need for accurate detection of heavy metals in water, soil, and air samples. AAS is widely used by regulatory bodies and environmental monitoring agencies for its sensitivity, reliability, and cost-effectiveness in identifying contaminants, ensuring public health, and supporting sustainability initiatives. The Pharmaceutical segment is expected to experience the fastest growth in Atomic Spectroscopy Market over 2026-2033 with a CAGR of 6.80%. The growing demand for trace metal analysis in drug formulations, raw materials and manufacturing processes is expected to drive this growth owing to regulatory agencies continuously raising the bar on recommended limits of metal contaminants. The high sensitivity and accuracy with AAS can be used to ensure product safety, quality control, and compliance with both European and American pharmacopeial standards. Additionally, the segment is anticipated to grow rapidly with the increasing production and development of pharmaceutical R&D.
By End -User
In 2025E, the Industrial segment accounted for approximately 37% of the Atomic Spectroscopy Market share, and expected to be the fastest growing during 2026-2033 In 2025E, the Industrial segment accounted for approximately 37% of the Atomic Spectroscopy Market share and is expected to be the fastest-growing segment from 2026 to 2033. This growth is driven by increasing demand for metal analysis in manufacturing, metallurgy, mining, and chemical processing. Industries rely on AAS for its precision, cost-efficiency, and ability to monitor quality, ensure material compliance, and support sustainable operations through accurate detection of trace metals in raw materials and finished products.
By Element
In 2025E, the Heavy Metals (e.g., Pb, Hg, Cd) segment accounted for approximately 38% of the Atomic Spectroscopy Market share, owing to high demand for accurate detection of toxic metals in environmental, food, pharmaceutical and industrial samples. Increased health and safety issues as well as stringent regulatory frameworks have made AAS a method of choice for use in the monitoring and control of heavy metal contamination in range of industry sectors.The Transition Metals (e.g., Fe, Cu, Zn, Ni) segment is expected to experience the fastest growth in Atomic Spectroscopy Market over 2026-2033 with a CAGR of 7.08%. The increasing demand for the product in metallurgy, pharmaceuticals, food processing, and environmental monitoring industries has fueled this growth. Atomic Absorption Spectrometry (AAS) high accuracy and reproducibility quantification of key transition metals that are employed in different industries and biological systems integral to quality control, safety assessments, and compliance with global regulations.
Atomic Spectroscopy Market Regional Analysis:
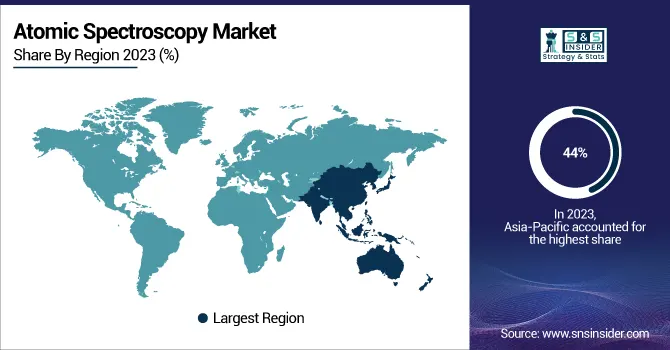
Asia Pacific Atomic Spectroscopy Market Insights
In 2025E, Asia Pacific dominated the Atomic Spectroscopy Market and accounted for 44% of revenue share. This leadership is attributed to rapid industrialization, expanding pharmaceutical and environmental monitoring sectors, and increased government regulations on pollution control. Countries like China, India, and Japan are heavily investing in advanced analytical technologies, driving demand for AAS in quality control, research, and regulatory testing. The region’s growing infrastructure and skilled workforce further support sustained market expansion.
North America Atomic Spectroscopy Market Insights
North America is expected to witness the fastest growth in the Atomic Spectroscopy Market over 2026-2033, with a projected CAGR of 6.92%, owing to stringent environmental and food safety regulations, rising investments in pharmaceutical R&D and growing demand for advanced analytical technologies in the region. The widespread adoption of AAS in laboratories, research institutions, and industrial sectors in the region is further bolstered by the presence of key market players, strong healthcare infrastructure, and technological advancements.
Europe Atomic Spectroscopy Market Insights
In 2025E, Europe emerged as a promising region in the Atomic Spectroscopy Market, due to favorable regulatory environment, increasing environmental monitoring efforts and developed research infrastructure. Countries such as Germany, the UK, and France are also investing in analytical technologies for pharmaceutical, food safety, and industrial quality control applications. Increased focus on sustainability coupled with stringent compliance requirements are also expected to propel AAS market adoption within academic, industrial & government laboratories.
Latin America (LATAM) and Middle East & Africa (MEA) Atomic Spectroscopy Market Insights
LATAM and MEA are experiencing steady growth in the Atomic Spectroscopy Market, driven by rising environmental concerns, expanding mining and industrial sectors, and increased government efforts to improve public health and safety standards. Growing demand for accurate metal detection in water, soil, and food testing, along with gradual improvements in laboratory infrastructure and investments in analytical technologies, are supporting the adoption of AAS across these emerging regions.
Get Customized Report as per Your Business Requirement - Enquiry Now
Atomic Spectroscopy Market Key Players:
The Atomic Spectroscopy Market Companies are
- Agilent Technologies
- PerkinElmer Inc.
- Thermo Fisher Scientific Inc.
- Shimadzu Corporation
- Hitachi High‑Technologies Corporation
- GBC Scientific Equipment
- Analytik Jena AG
- Bruker Corporation
- Rigaku Corporation
- Aurora Biomed
- Buck Scientific
- PG Instruments Limited
- Beijing Beifen‑Ruili Analytical Instrument (Group) Co., Ltd.
- JASCO International Co., Ltd.
- Labindia Instruments Pvt. Ltd.
- Skyray Instrument Inc.
- Teledyne Leeman Labs
- Persee Analytics, Inc.
- Hanon Instruments
- Metrohm AG
Competitive Landscape for Atomic Spectroscopy Market:
Hitachi High‑Tech Corporation is a Tokyo‑based provider of advanced analytical and atomic spectroscopy instruments and solutions, serving research, industrial, environmental, and semiconductor markets with high‑precision elemental and material analysis technologies that support R&D, quality control, and complex inspection applications worldwide.
-
In August 1, 2024, Hitachi High-Tech acquired a majority stake in Nabsys to advance its molecular diagnostics business through electronic genome mapping. The move aims to globalize the OhmX platform for high-resolution structural variation analysis in genomics.
Buck Scientific, Inc. is a U.S. analytical instrument manufacturer founded in 1970, specializing in affordable, reliable atomic absorption spectrometers and other spectroscopy and chromatography systems for elemental analysis, environmental, industrial, educational, and quality control laboratories worldwide.
-
On June 4, 2025, Bruker launched the timsOmni mass spectrometer, designed to enhance biopharma R&D with deep structural analysis of proteoforms and biologics. The system supports advanced protein science and disease research through precision insights and integrated OmniScape software.
| Report Attributes | Details |
|---|---|
| Market Size in 2025E | USD 1.65 Billion |
| Market Size by 2033 | USD 2.49 Billion |
| CAGR | CAGR of 5.28% From 2026 to 2033 |
| Base Year | 2025E |
| Forecast Period | 2026-2033 |
| Historical Data | 2021-2024 |
| Report Scope & Coverage | Market Size, Segments Analysis, Competitive Landscape, Regional Analysis, DROC & SWOT Analysis, Forecast Outlook |
| Key Segments | • By Technology (Flame, Graphite Furnace, Zeeman Background Correction and Others) • By Application (Environmental Analysis, Food and Beverage Testing, Pharmaceutical, Biotechnology and Others) • By End –User (Research Laboratories, Academic Institutions, Industrial and Others) • By Element Category (Heavy Metals (e.g., Pb, Hg, Cd), Alkali & Alkaline Earth Metals (e.g., Na, K, Ca, Mg), Transition Metals (e.g., Fe, Cu, Zn, Ni), Metalloids & Trace Elements (e.g., As, Se, B) and Others) |
| Regional Analysis/Coverage | North America (US, Canada), Europe (Germany, UK, France, Italy, Spain, Russia, Poland, Rest of Europe), Asia Pacific (China, India, Japan, South Korea, Australia, ASEAN Countries, Rest of Asia Pacific), Middle East & Africa (UAE, Saudi Arabia, Qatar, South Africa, Rest of Middle East & Africa), Latin America (Brazil, Argentina, Mexico, Colombia, Rest of Latin America). |
| Company Profiles | The Atomic Spectroscopy Market Companies are Agilent Technologies, PerkinElmer Inc., Thermo Fisher Scientific Inc., Shimadzu Corporation, Hitachi High‑Technologies Corporation, GBC Scientific Equipment, Analytik Jena AG, Bruker Corporation, Rigaku Corporation, Aurora Biomed, Buck Scientific, PG Instruments Limited, Beijing Beifen‑Ruili Analytical Instrument (Group) Co., Ltd., JASCO International Co., Ltd., Labindia Instruments Pvt. Ltd., Skyray Instrument Inc., Teledyne Leeman Labs, Persee Analytics, Inc., Hanon Instruments, Metrohm AG. and Others. |
Frequently Asked Questions
Asia-Pacific dominated the Atomic Spectroscopy Market in 2025E.
The “Flame” segment dominated the Atomic Spectroscopy Market
Rising demand for precise metal analysis in environmental monitoring, pharmaceuticals, and food safety is driving the Atomic Spectroscopy market.
The Atomic Spectroscopy Market size was valued at USD 1.65 Billion in 2025E and is projected to reach USD 2.49 Billion by 2033, growing at a CAGR of 5.28% during 2026-2033.
The Atomic Spectroscopy Market is expected to grow at a CAGR of 5.28% during 2026-2033.
Get in Touch
